Business Decision Making: Data Analysis, Retail Strategy & Survey
VerifiedAdded on 2024/05/27
|25
|4161
|195
Report
AI Summary
This report explores business decision-making within the retail sector, focusing on the impact of multichannel shopping on traditional high street shops and malls. It details a data collection plan involving surveys to gather consumer perspectives, employing methodologies like random sampling. The report summarizes survey data using measures of central tendency (mean, median, mode) and dispersion (standard deviation, range), along with quartile, percentile, and correlation coefficient analysis to draw meaningful conclusions. Spreadsheets and graphs visually represent the survey findings, complemented by trend lines projecting impacts over three years. The report also covers the role of various systems in serving different management levels, network diagram analysis, critical path identification, and the use of financial tools for effective decision-making, including investment appraisal techniques to evaluate projects.
Business decision making
1
1
Paraphrase This Document
Need a fresh take? Get an instant paraphrase of this document with our AI Paraphraser
Table of Contents
Introduction......................................................................................................................................4
Task 1...............................................................................................................................................5
a) Create a plan for data collection..............................................................................................5
b) Present the survey methodology and sampling frame used....................................................6
c) Design a questionnaire for collecting the data.........................................................................7
Task 2...............................................................................................................................................9
a) Summarize the data collected from the survey using representative values (arithmetic mean,
median and mode)........................................................................................................................9
b) Analyse the results of the survey and draw conclusions.......................................................12
c) Analyse the data using measures of dispersion.....................................................................12
d) Explain the data with the help of quartile, percentile and the correlation coefficient to draw
useful conclusions......................................................................................................................14
Task 3.............................................................................................................................................15
a) With the help of spreadsheets produce graphs to help draw valid conclusions from the
survey.........................................................................................................................................15
b) Create trend lines to show the impact over a minimum of 3 years.......................................19
c) Prepare a poster presentation of research findings................................................................20
d) Write a formal report for publication in the Retail Times magazine....................................21
Task 4.............................................................................................................................................22
a) How do the following systems serve the various levels of management in a business? You
are to describe their characteristics and the roles they play in a business.................................22
b) Draw a network diagram and find the critical path...............................................................22
c) Use of financial tools in decision making.............................................................................23
Conclusion.....................................................................................................................................25
References......................................................................................................................................26
2
Introduction:
In the business, there are various decisions which are required to be made and it is required that
decisions must be made by taking into consideration all of the aspects. There will be research
which will be made so that the proper results can be identified and then they can be used in the
decision making. The report will be consisting of all the elements which are to be noted ion the
business. The survey will be carried out so that the views of all can be attained and information
can be collected in an appropriate manner. Various calculations will be made and in them, the
measures of central tendency and dispersion will be used. There will be poster which will be
prepared and in that all of the findings will be included. The investment appraisal techniques will
be used and with the help of that, all of the projects will be evaluated.
3
⊘ This is a preview!⊘
Do you want full access?
Subscribe today to unlock all pages.
Trusted by 1+ million students worldwide
Task 1:
a) Create a plan for data collection.
In the environment, there are various changes which are taking place such as due to the
multichannel shopping the high street shops and malls are getting affected. For this proper
research will be carried out so that the impact of this can be identified. For that data will have to
be collected with the help of the various methods so that the views of the consumers can be
ascertained. This will be carried with the help of the plan which will be formulated. In the given
case there will be survey which will be performed with the help of the 100 people and the results
will be obtained in respect of five weeks (Akhtar, et. al., 2016). There are various sources which
can be used and they involve primary and secondary sources. In the given case the questionnaire
will be used with the help of which all of the preferences will be determined.
Primary sources: The sources by which the information will be collected directly will be
considered under this and there will be no intermediate party which will be involved in it. There
are various forms in which this can be done and they include questionnaire which is the
document in which several questions are framed and then they are provided to the respondent so
that their responses can be collected. In addition to this interview can also be used as in that
direct contact will be established and the chances of information being incorrect or modified will
be eliminated.
4
Paraphrase This Document
Need a fresh take? Get an instant paraphrase of this document with our AI Paraphraser
b) Present the survey methodology and sampling frame used.
In the process of research, there is the need to follow various strategies and techniques so that the
appropriate finding can be made and they all are known as research methodologies. The
company can collect the information with the help of various means and one of them is survey
which will be used by the business. The data which is collected by that is accurate and reliable as
there will be personal contact which will be made under it. There will be the results which will
be attained and with the help of them the views will be identified and then they will be
interpreted in an appropriate manner so that bets decisions can be taken with the help of it
(Patten, 2016). This will help in the attainment of the goals which are set and the further
improvement can be made.
In the process of the survey it will not be possible to consider all of the people and for that, there
is the need to use only a portion and that will be known as the sample. This will have to be
selected by the business and for that various methods are there and they are simple random
sampling, quota sampling, and stratified sampling (Palinkas, et. al., 2015). The company will
have to choose the best among them so that they can perform the survey in a proper manner and
the same in the given case will be random sampling. As that is simple and easy to use by all.
5
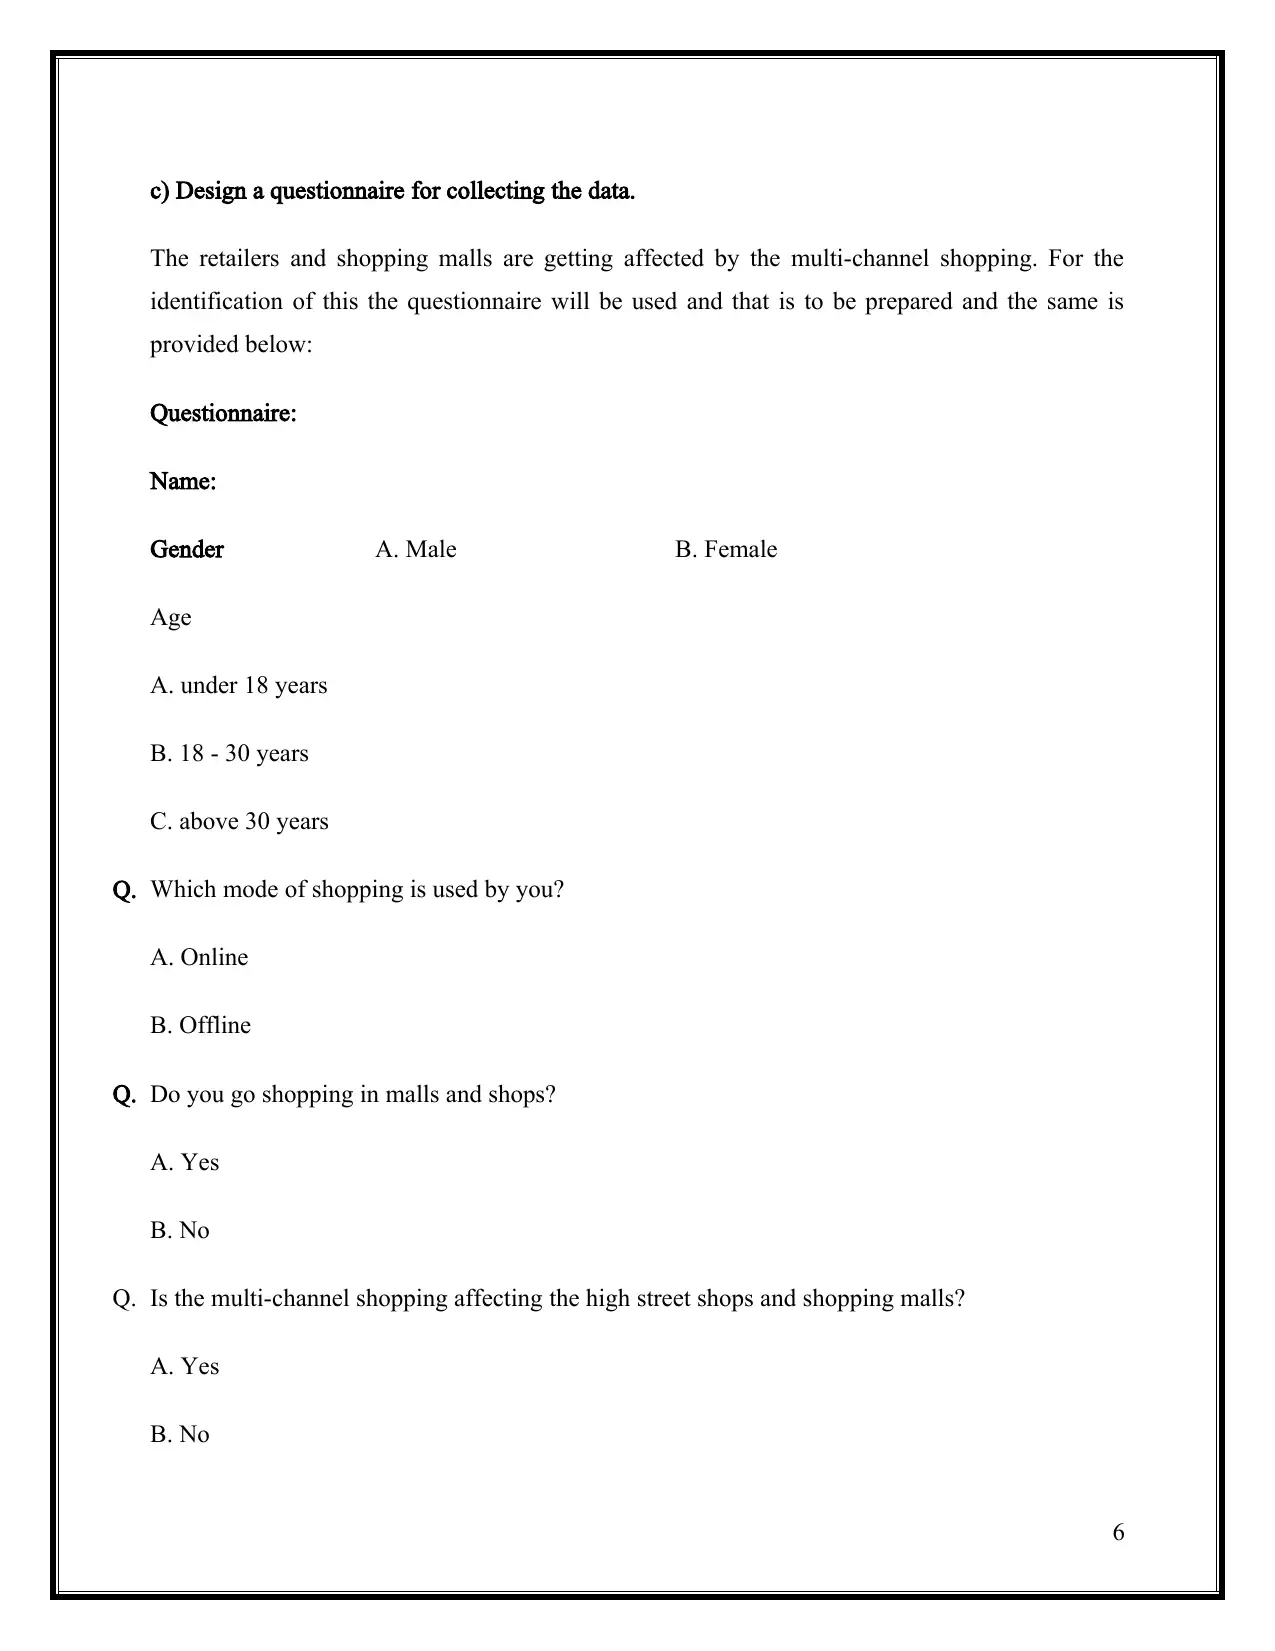
c) Design a questionnaire for collecting the data.
The retailers and shopping malls are getting affected by the multi-channel shopping. For the
identification of this the questionnaire will be used and that is to be prepared and the same is
provided below:
Questionnaire:
Name:
Gender A. Male B. Female
Age
A. under 18 years
B. 18 - 30 years
C. above 30 years
Q. Which mode of shopping is used by you?
A. Online
B. Offline
Q. Do you go shopping in malls and shops?
A. Yes
B. No
Q. Is the multi-channel shopping affecting the high street shops and shopping malls?
A. Yes
B. No
6
⊘ This is a preview!⊘
Do you want full access?
Subscribe today to unlock all pages.
Trusted by 1+ million students worldwide
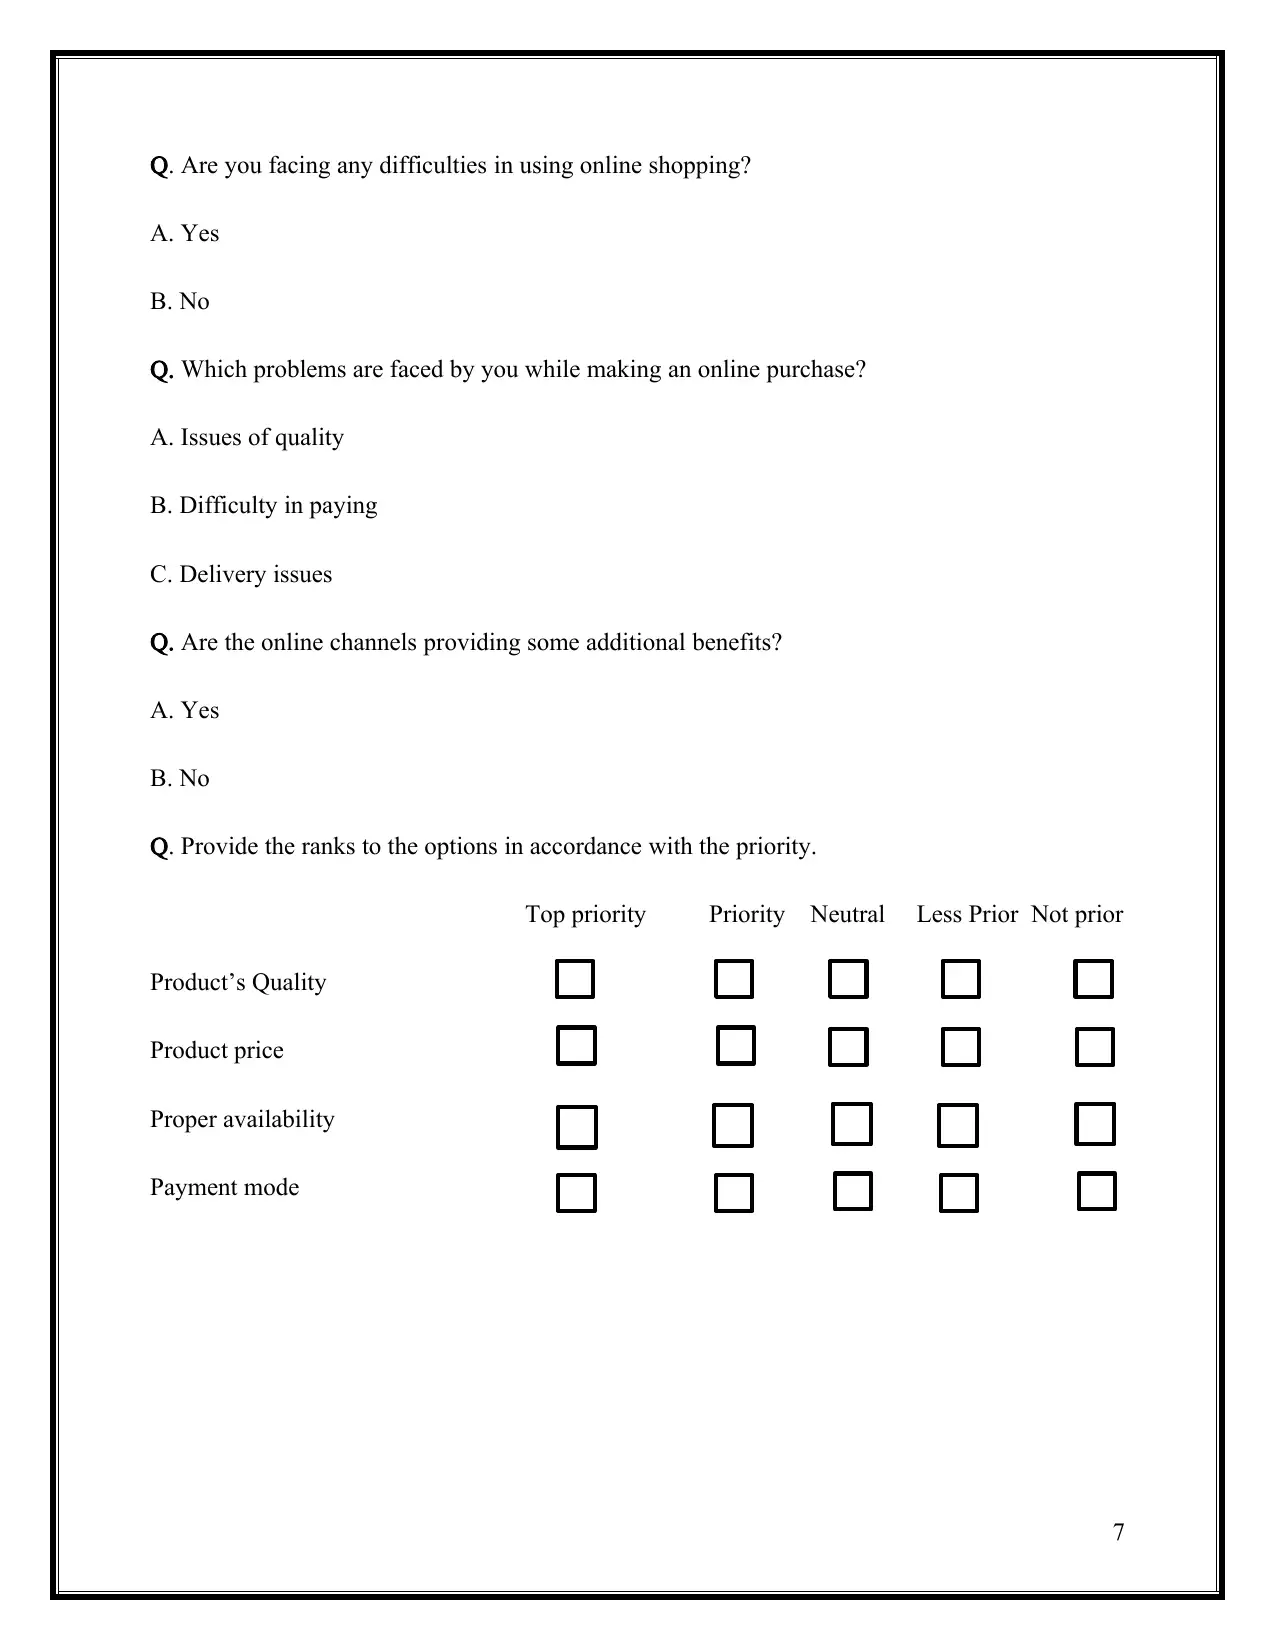
Q. Are you facing any difficulties in using online shopping?
A. Yes
B. No
Q. Which problems are faced by you while making an online purchase?
A. Issues of quality
B. Difficulty in paying
C. Delivery issues
Q. Are the online channels providing some additional benefits?
A. Yes
B. No
Q. Provide the ranks to the options in accordance with the priority.
Top priority Priority Neutral Less Prior Not prior
Product’s Quality
Product price
Proper availability
Payment mode
7
A. Yes
B. No
Q. Which problems are faced by you while making an online purchase?
A. Issues of quality
B. Difficulty in paying
C. Delivery issues
Q. Are the online channels providing some additional benefits?
A. Yes
B. No
Q. Provide the ranks to the options in accordance with the priority.
Top priority Priority Neutral Less Prior Not prior
Product’s Quality
Product price
Proper availability
Payment mode
7
Paraphrase This Document
Need a fresh take? Get an instant paraphrase of this document with our AI Paraphraser
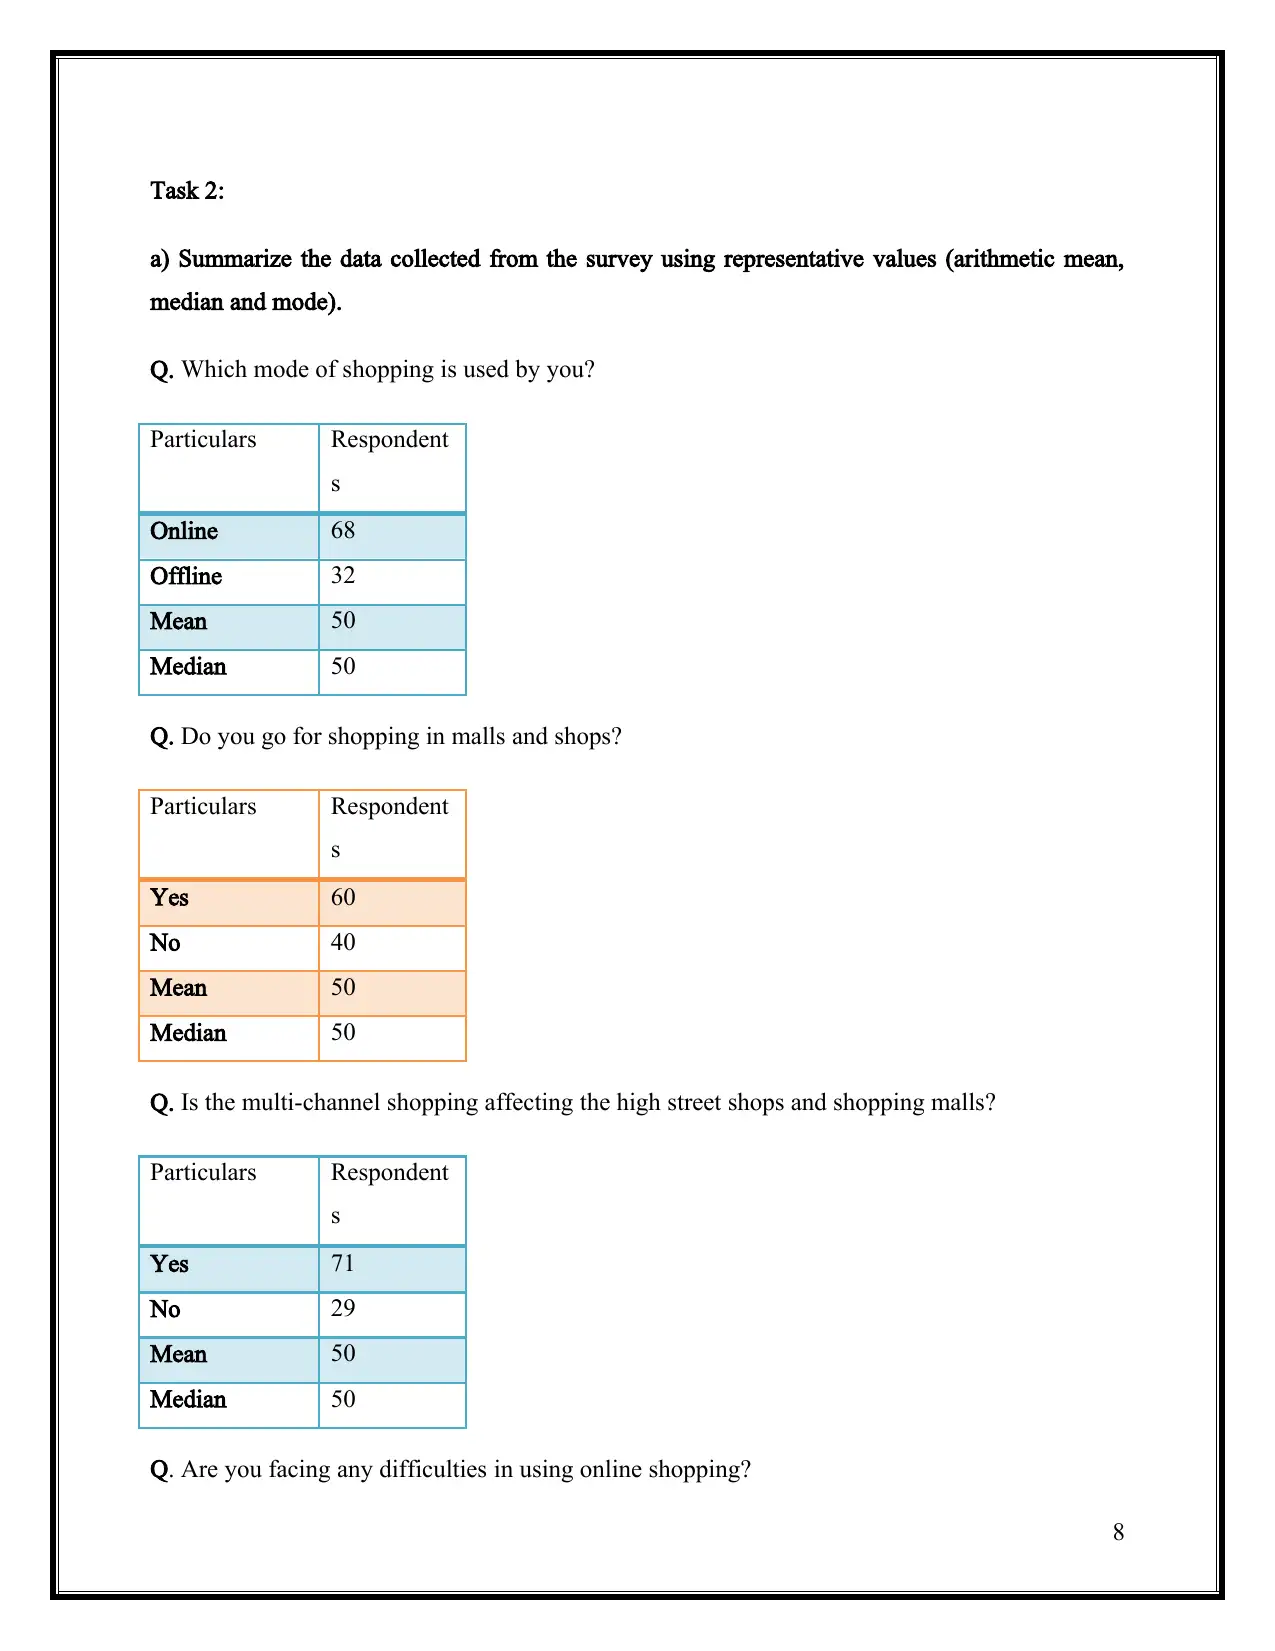
Task 2:
a) Summarize the data collected from the survey using representative values (arithmetic mean,
median and mode).
Q. Which mode of shopping is used by you?
Particulars Respondent
s
Online 68
Offline 32
Mean 50
Median 50
Q. Do you go for shopping in malls and shops?
Particulars Respondent
s
Yes 60
No 40
Mean 50
Median 50
Q. Is the multi-channel shopping affecting the high street shops and shopping malls?
Particulars Respondent
s
Yes 71
No 29
Mean 50
Median 50
Q. Are you facing any difficulties in using online shopping?
8
Particulars Respondent
s
Yes 45
No 55
Mean 50
Median 50
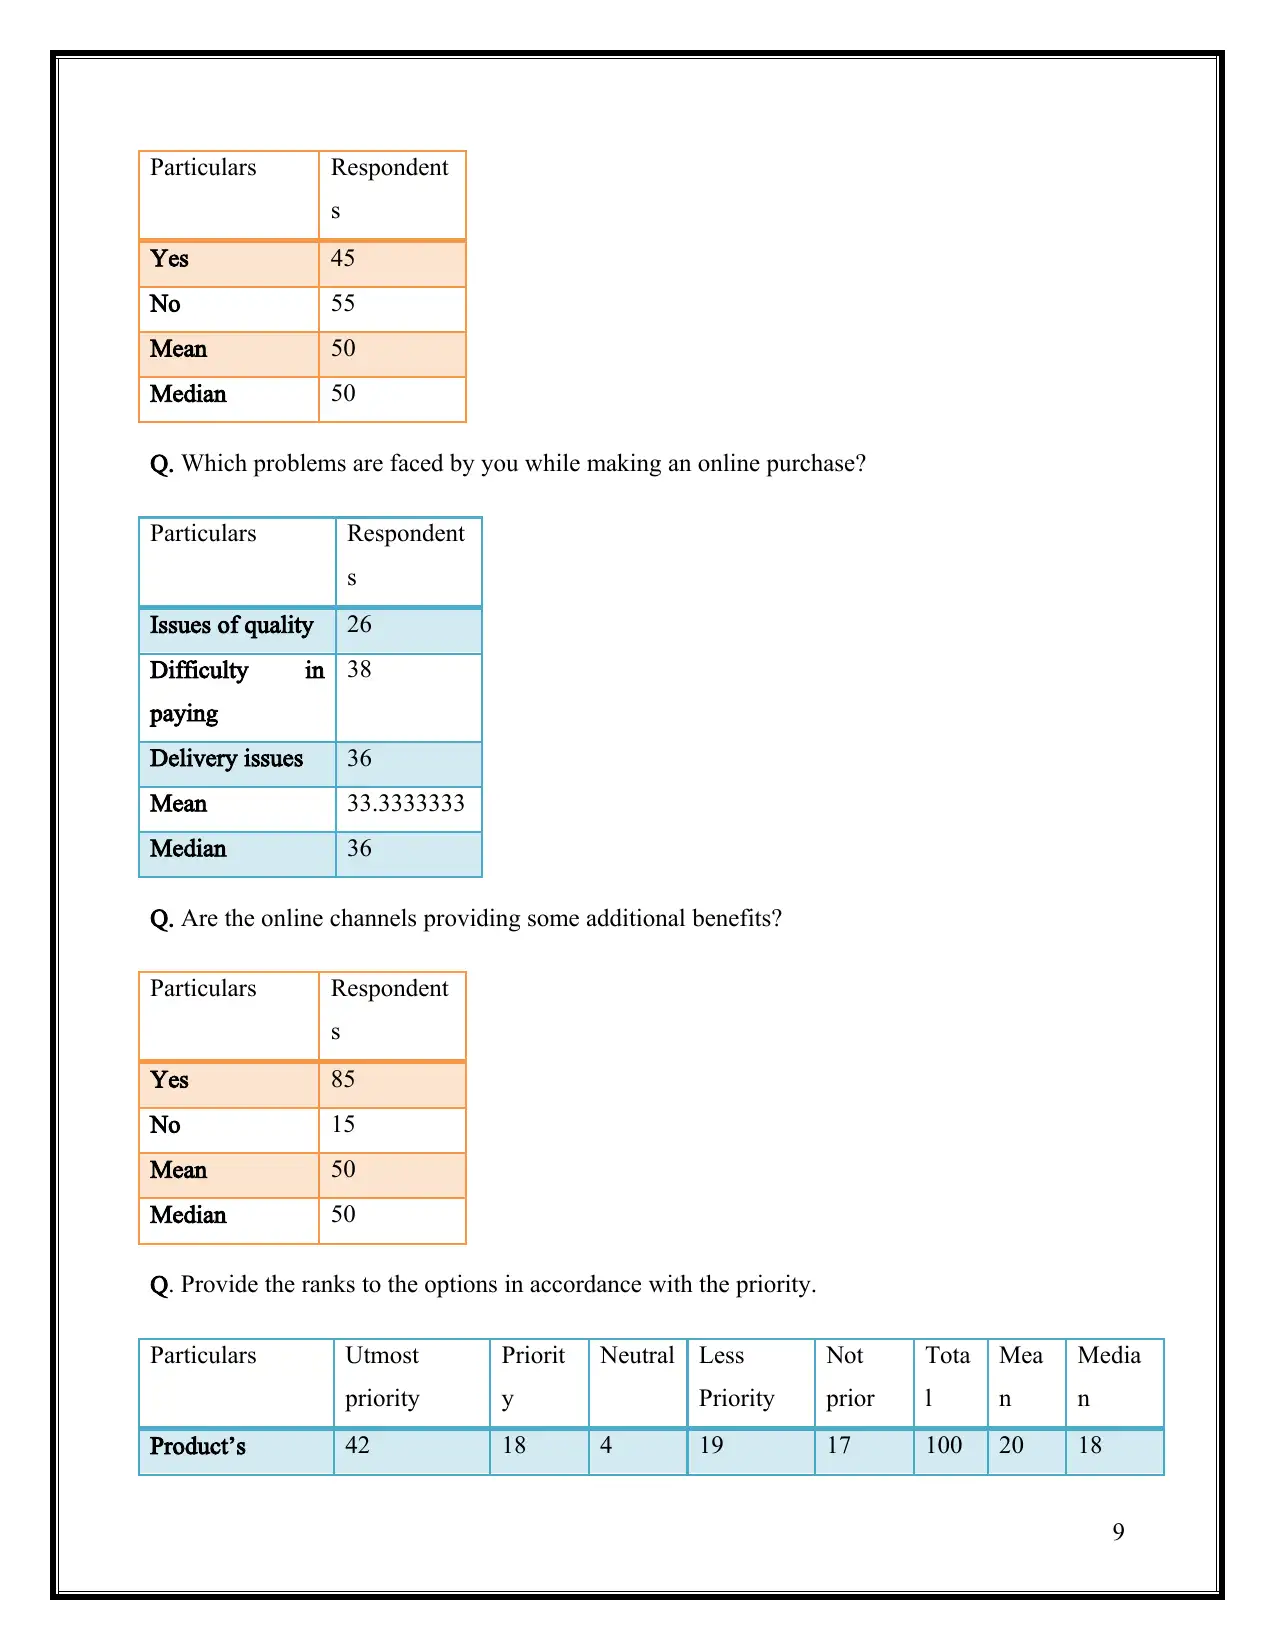
Q. Which problems are faced by you while making an online purchase?
Particulars Respondent
s
Issues of quality 26
Difficulty in
paying
38
Delivery issues 36
Mean 33.3333333
Median 36
Q. Are the online channels providing some additional benefits?
Particulars Respondent
s
Yes 85
No 15
Mean 50
Median 50
Q. Provide the ranks to the options in accordance with the priority.
Particulars Utmost
priority
Priorit
y
Neutral Less
Priority
Not
prior
Tota
l
Mea
n
Media
n
Product’s 42 18 4 19 17 100 20 18
9
s
Yes 45
No 55
Mean 50
Median 50
Q. Which problems are faced by you while making an online purchase?
Particulars Respondent
s
Issues of quality 26
Difficulty in
paying
38
Delivery issues 36
Mean 33.3333333
Median 36
Q. Are the online channels providing some additional benefits?
Particulars Respondent
s
Yes 85
No 15
Mean 50
Median 50
Q. Provide the ranks to the options in accordance with the priority.
Particulars Utmost
priority
Priorit
y
Neutral Less
Priority
Not
prior
Tota
l
Mea
n
Media
n
Product’s 42 18 4 19 17 100 20 18
9
⊘ This is a preview!⊘
Do you want full access?
Subscribe today to unlock all pages.
Trusted by 1+ million students worldwide
Quality
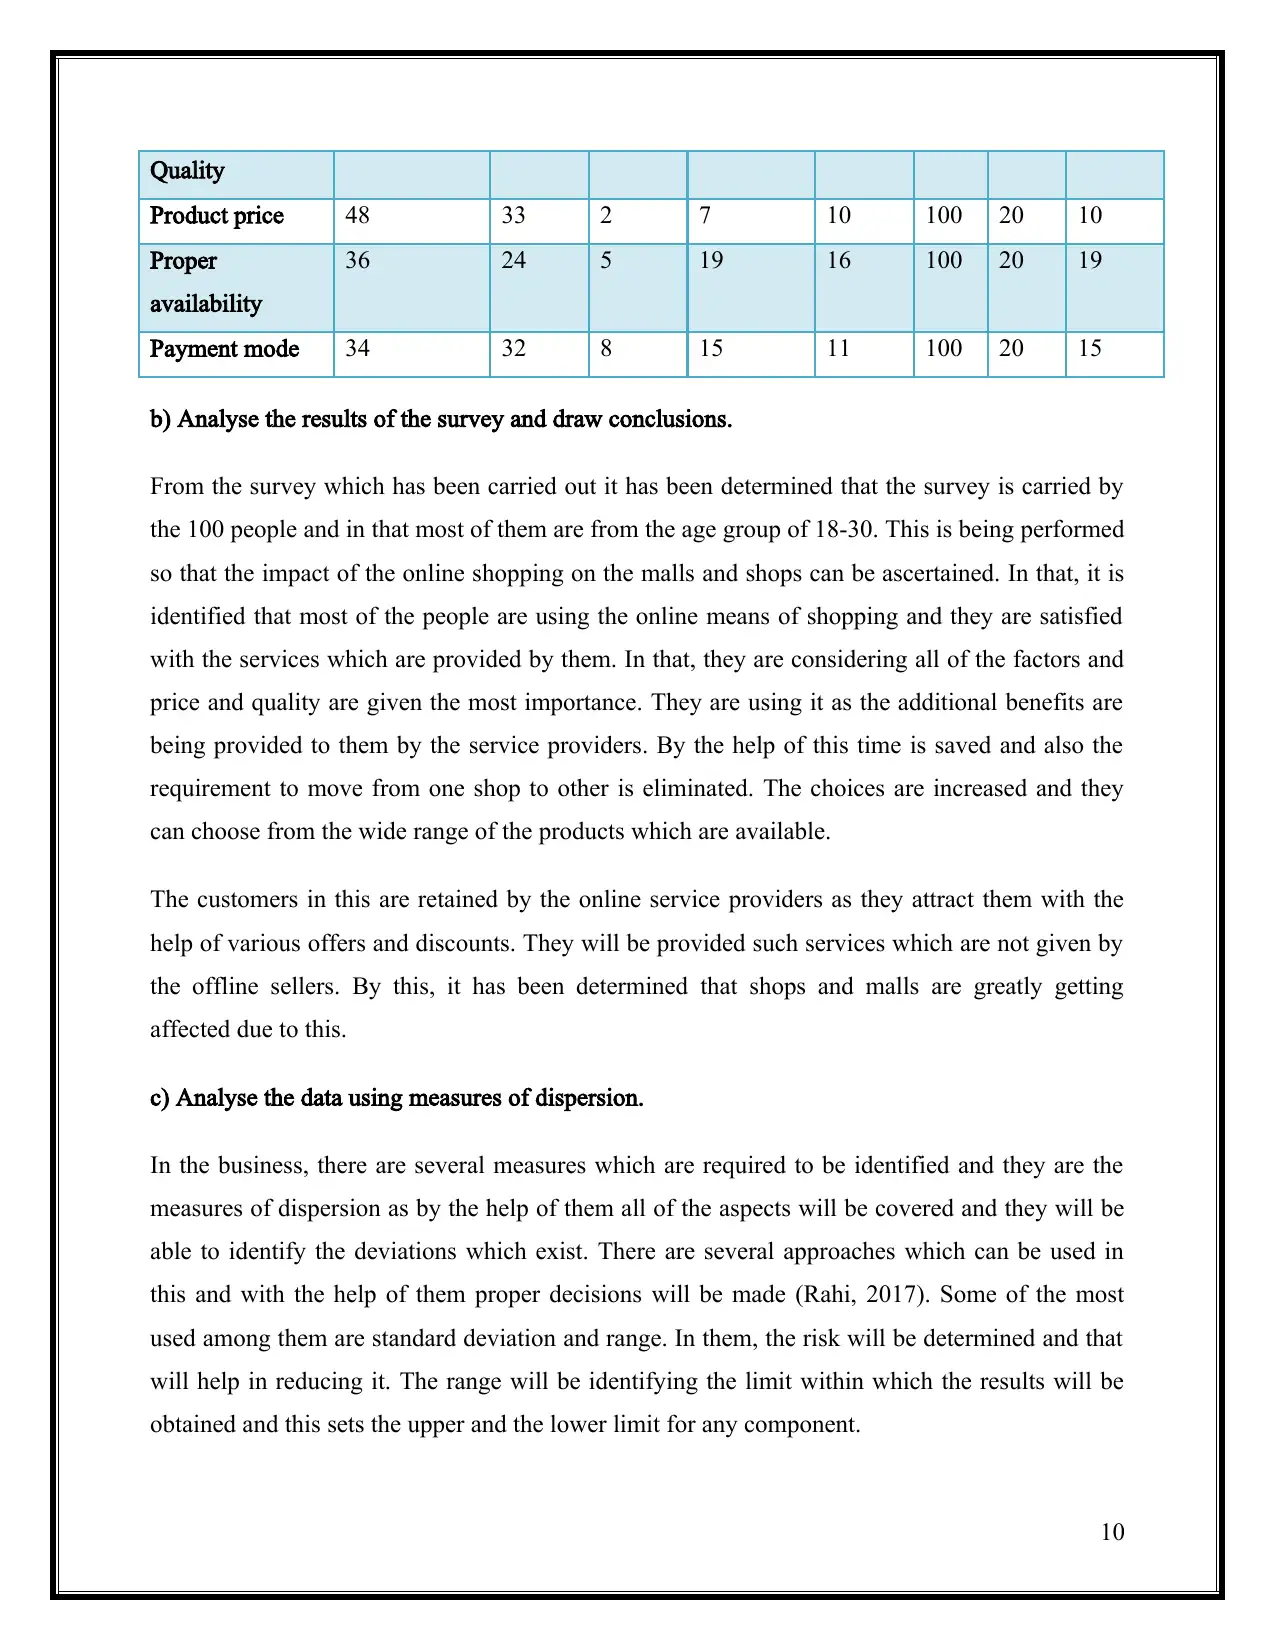
Product price 48 33 2 7 10 100 20 10
Proper
availability
36 24 5 19 16 100 20 19
Payment mode 34 32 8 15 11 100 20 15
b) Analyse the results of the survey and draw conclusions.
From the survey which has been carried out it has been determined that the survey is carried by
the 100 people and in that most of them are from the age group of 18-30. This is being performed
so that the impact of the online shopping on the malls and shops can be ascertained. In that, it is
identified that most of the people are using the online means of shopping and they are satisfied
with the services which are provided by them. In that, they are considering all of the factors and
price and quality are given the most importance. They are using it as the additional benefits are
being provided to them by the service providers. By the help of this time is saved and also the
requirement to move from one shop to other is eliminated. The choices are increased and they
can choose from the wide range of the products which are available.
The customers in this are retained by the online service providers as they attract them with the
help of various offers and discounts. They will be provided such services which are not given by
the offline sellers. By this, it has been determined that shops and malls are greatly getting
affected due to this.
c) Analyse the data using measures of dispersion.
In the business, there are several measures which are required to be identified and they are the
measures of dispersion as by the help of them all of the aspects will be covered and they will be
able to identify the deviations which exist. There are several approaches which can be used in
this and with the help of them proper decisions will be made (Rahi, 2017). Some of the most
used among them are standard deviation and range. In them, the risk will be determined and that
will help in reducing it. The range will be identifying the limit within which the results will be
obtained and this sets the upper and the lower limit for any component.
10
Paraphrase This Document
Need a fresh take? Get an instant paraphrase of this document with our AI Paraphraser
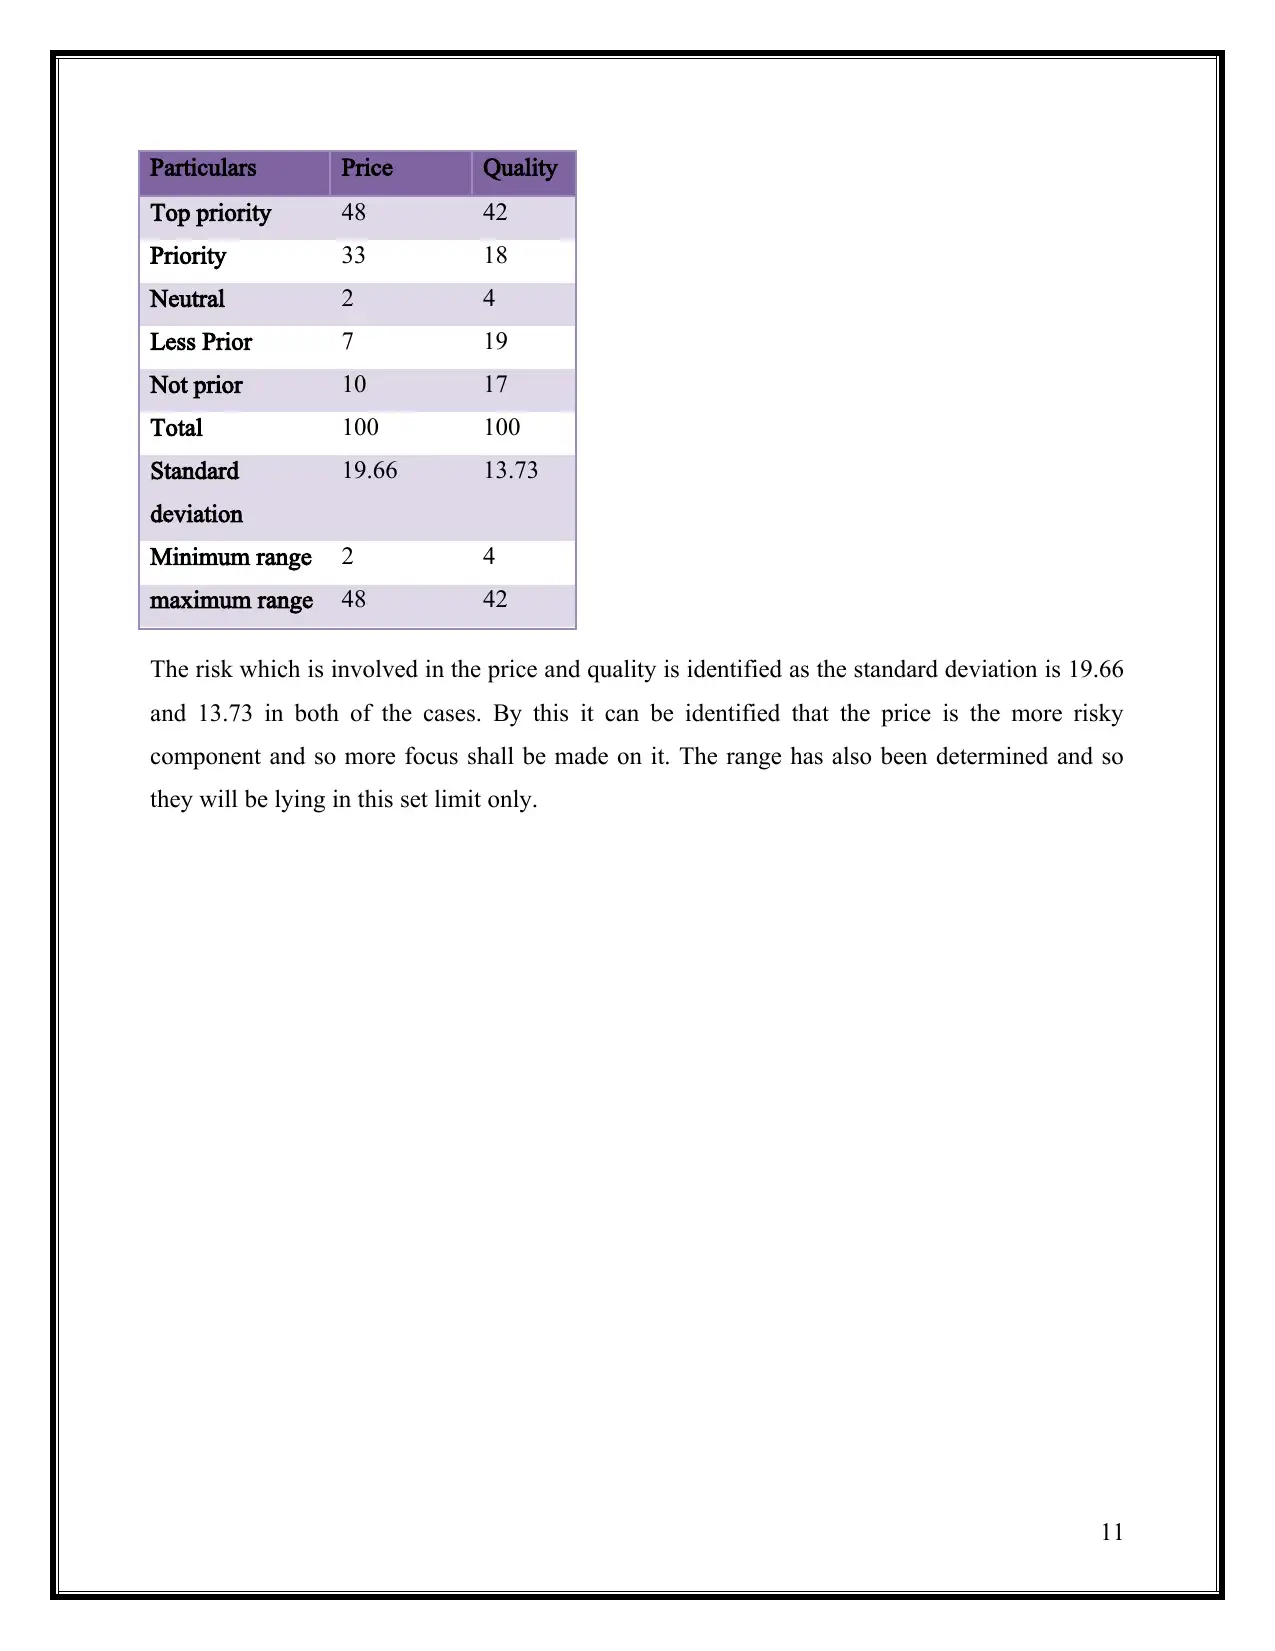
Particulars Price Quality
Top priority 48 42
Priority 33 18
Neutral 2 4
Less Prior 7 19
Not prior 10 17
Total 100 100
Standard
deviation
19.66 13.73
Minimum range 2 4
maximum range 48 42
The risk which is involved in the price and quality is identified as the standard deviation is 19.66
and 13.73 in both of the cases. By this it can be identified that the price is the more risky
component and so more focus shall be made on it. The range has also been determined and so
they will be lying in this set limit only.
11
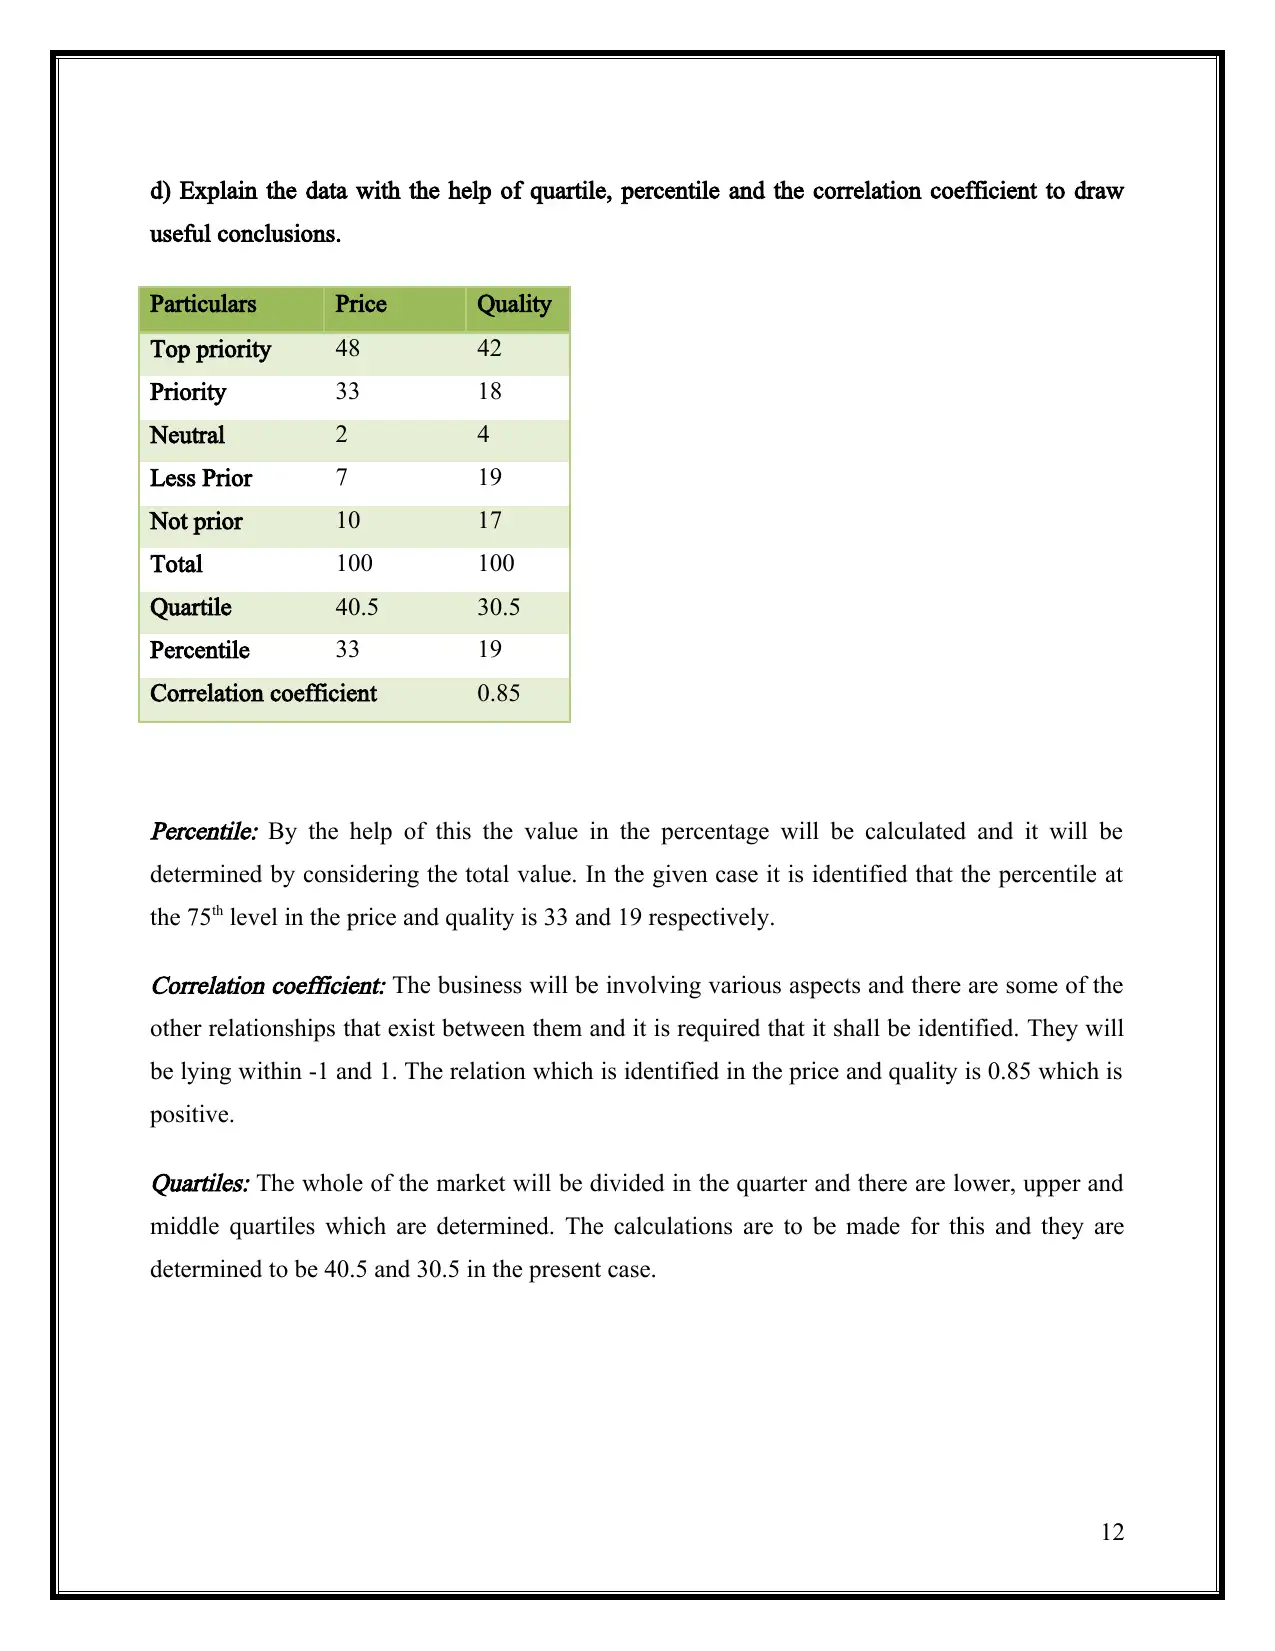
d) Explain the data with the help of quartile, percentile and the correlation coefficient to draw
useful conclusions.
Particulars Price Quality
Top priority 48 42
Priority 33 18
Neutral 2 4
Less Prior 7 19
Not prior 10 17
Total 100 100
Quartile 40.5 30.5
Percentile 33 19
Correlation coefficient 0.85
Percentile: By the help of this the value in the percentage will be calculated and it will be
determined by considering the total value. In the given case it is identified that the percentile at
the 75th level in the price and quality is 33 and 19 respectively.
Correlation coefficient: The business will be involving various aspects and there are some of the
other relationships that exist between them and it is required that it shall be identified. They will
be lying within -1 and 1. The relation which is identified in the price and quality is 0.85 which is
positive.
Quartiles: The whole of the market will be divided in the quarter and there are lower, upper and
middle quartiles which are determined. The calculations are to be made for this and they are
determined to be 40.5 and 30.5 in the present case.
12
⊘ This is a preview!⊘
Do you want full access?
Subscribe today to unlock all pages.
Trusted by 1+ million students worldwide
1 out of 25
Related Documents


Your All-in-One AI-Powered Toolkit for Academic Success.
+13062052269
info@desklib.com
Available 24*7 on WhatsApp / Email
![[object Object]](/_next/static/media/star-bottom.7253800d.svg)
Unlock your academic potential
Copyright © 2020–2026 A2Z Services. All Rights Reserved. Developed and managed by ZUCOL.