Business Statistics Report: Retail Surge's Profit and User Analysis
VerifiedAdded on 2023/06/07
|28
|5646
|421
Report
AI Summary
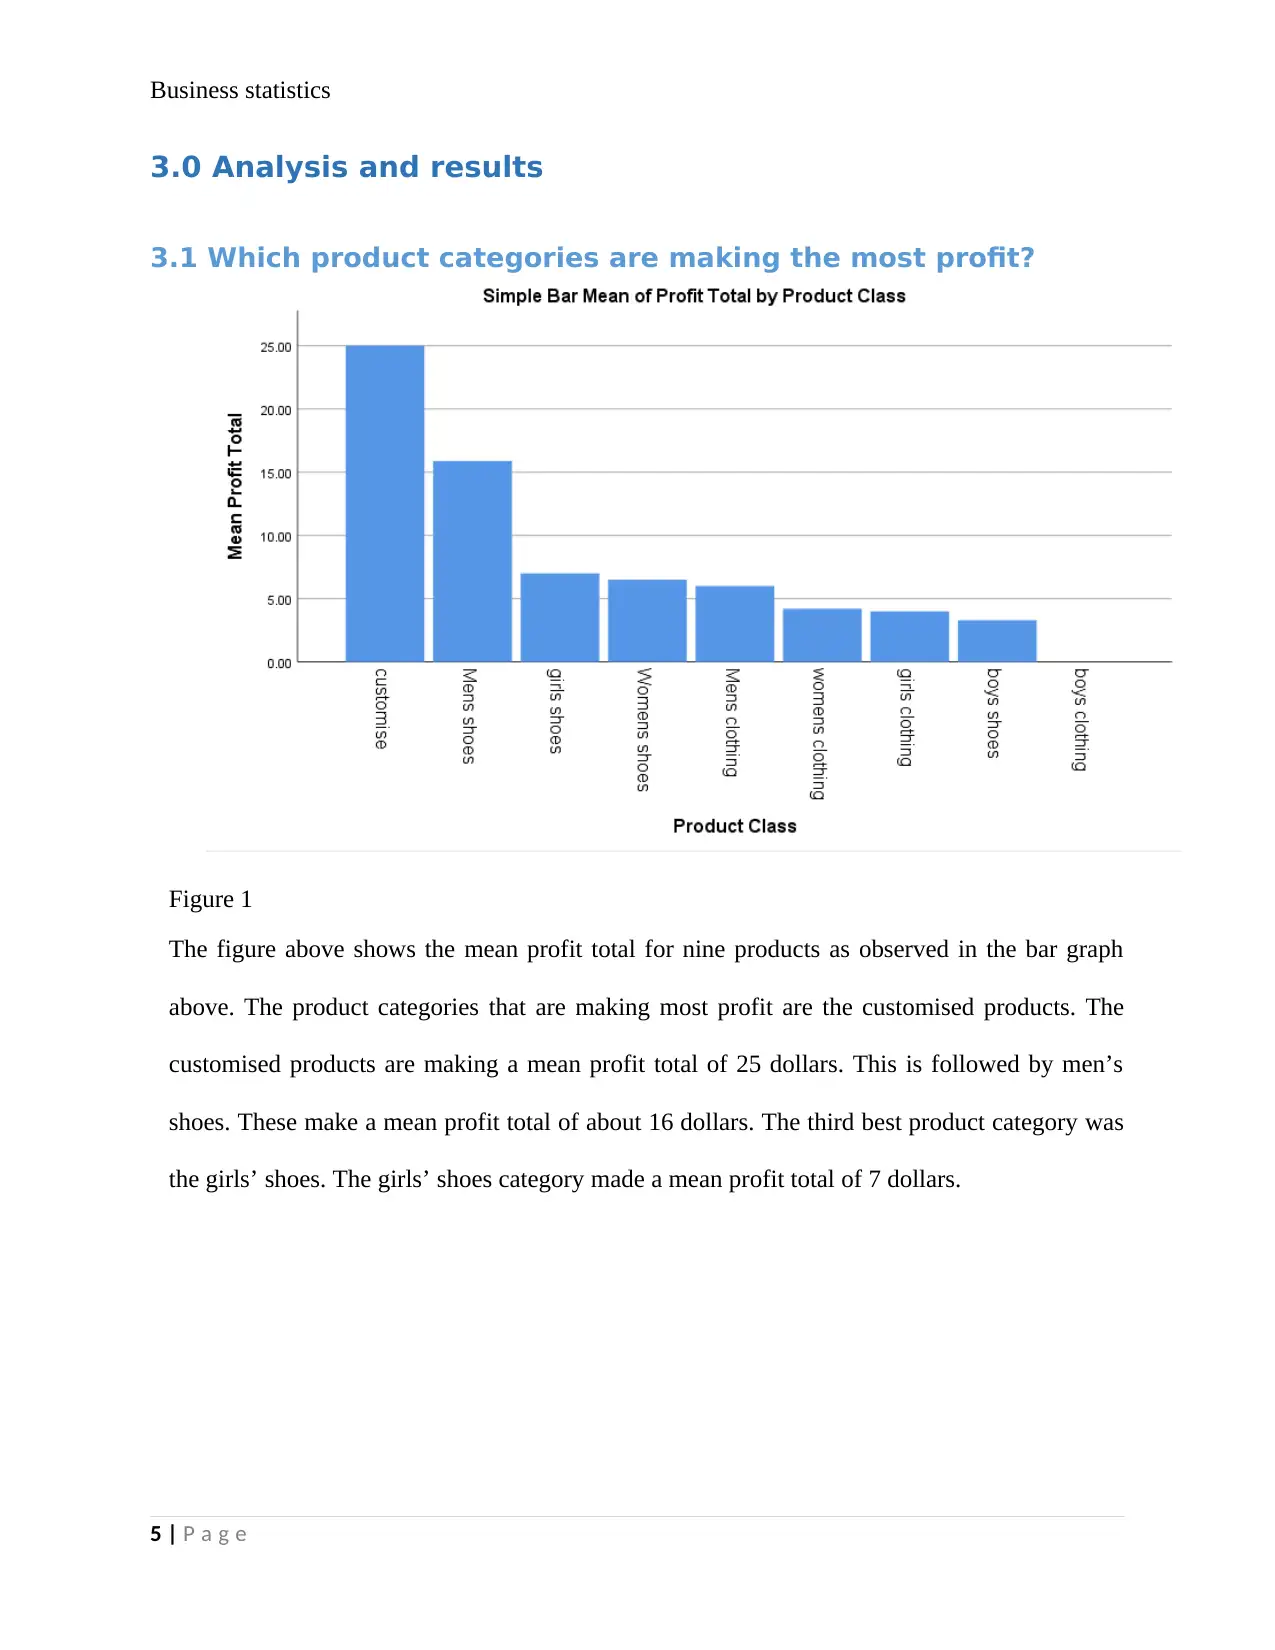
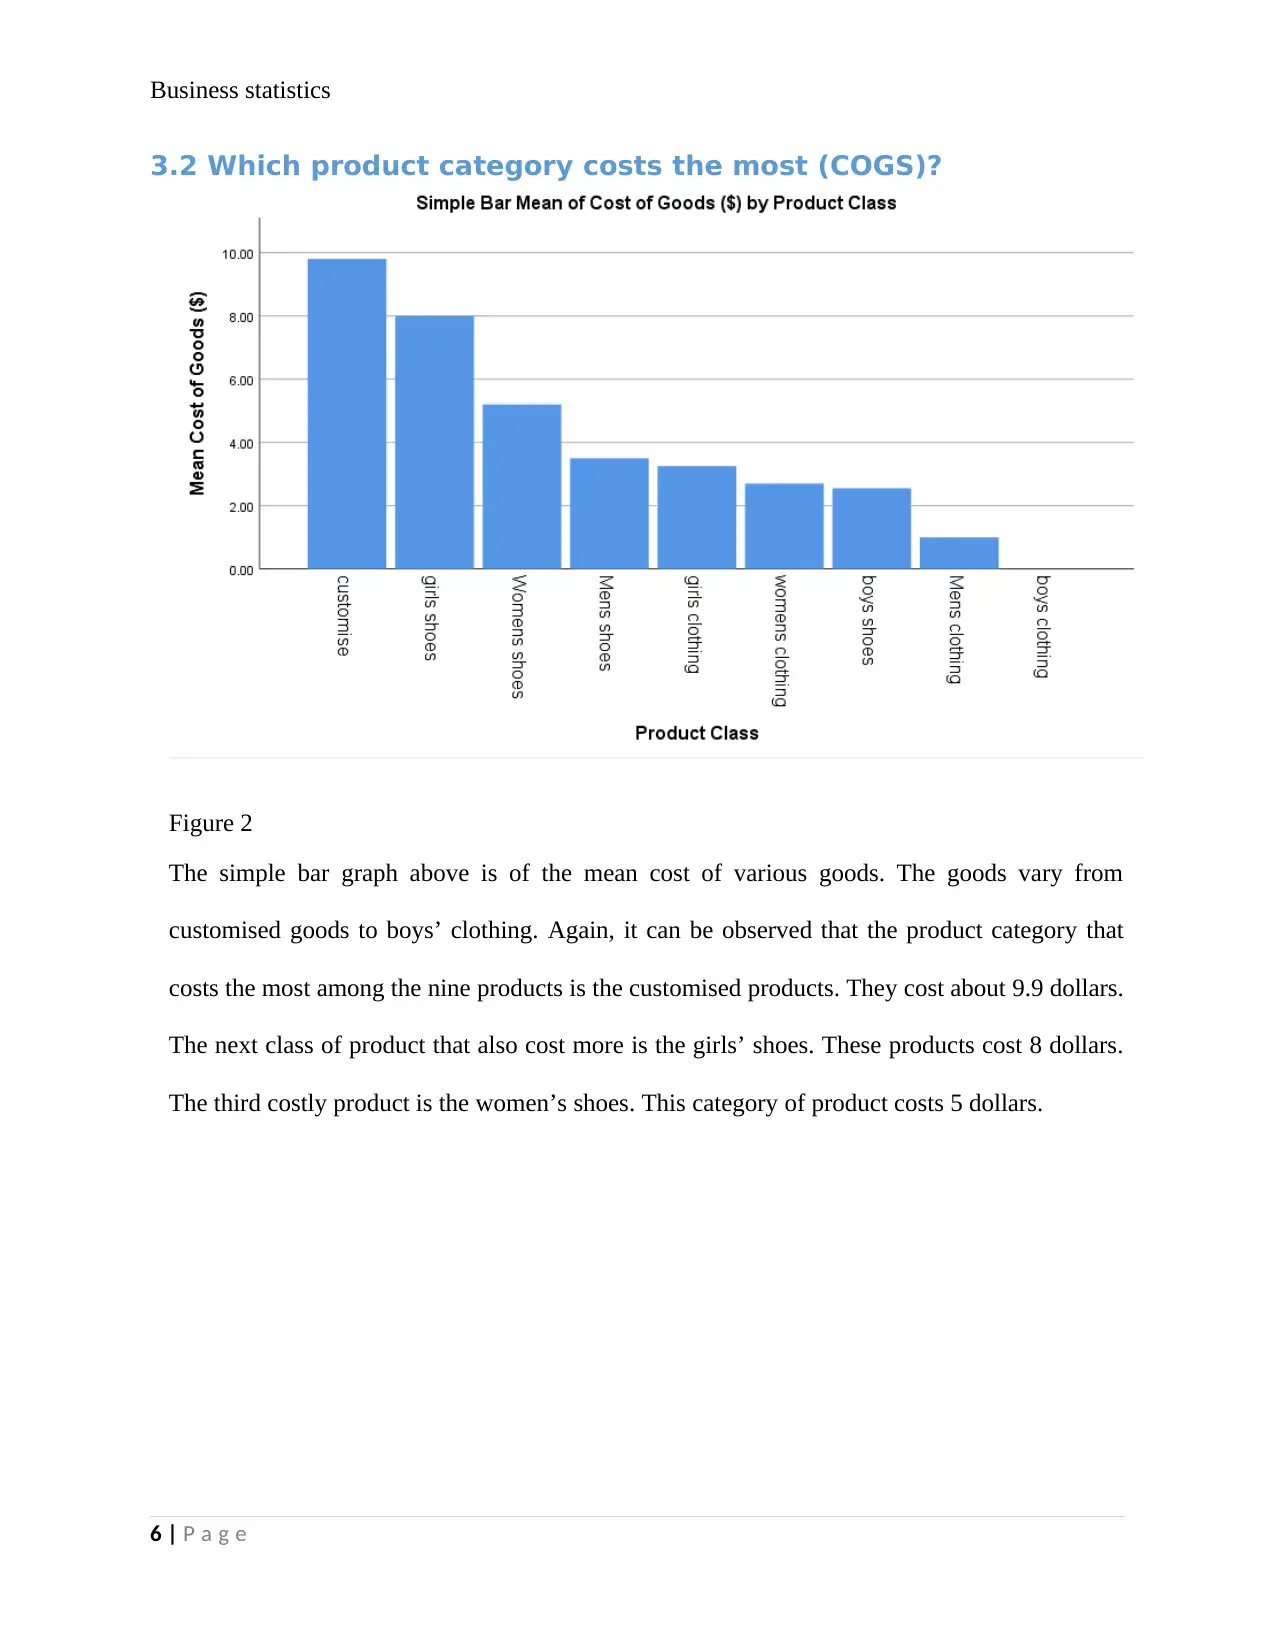
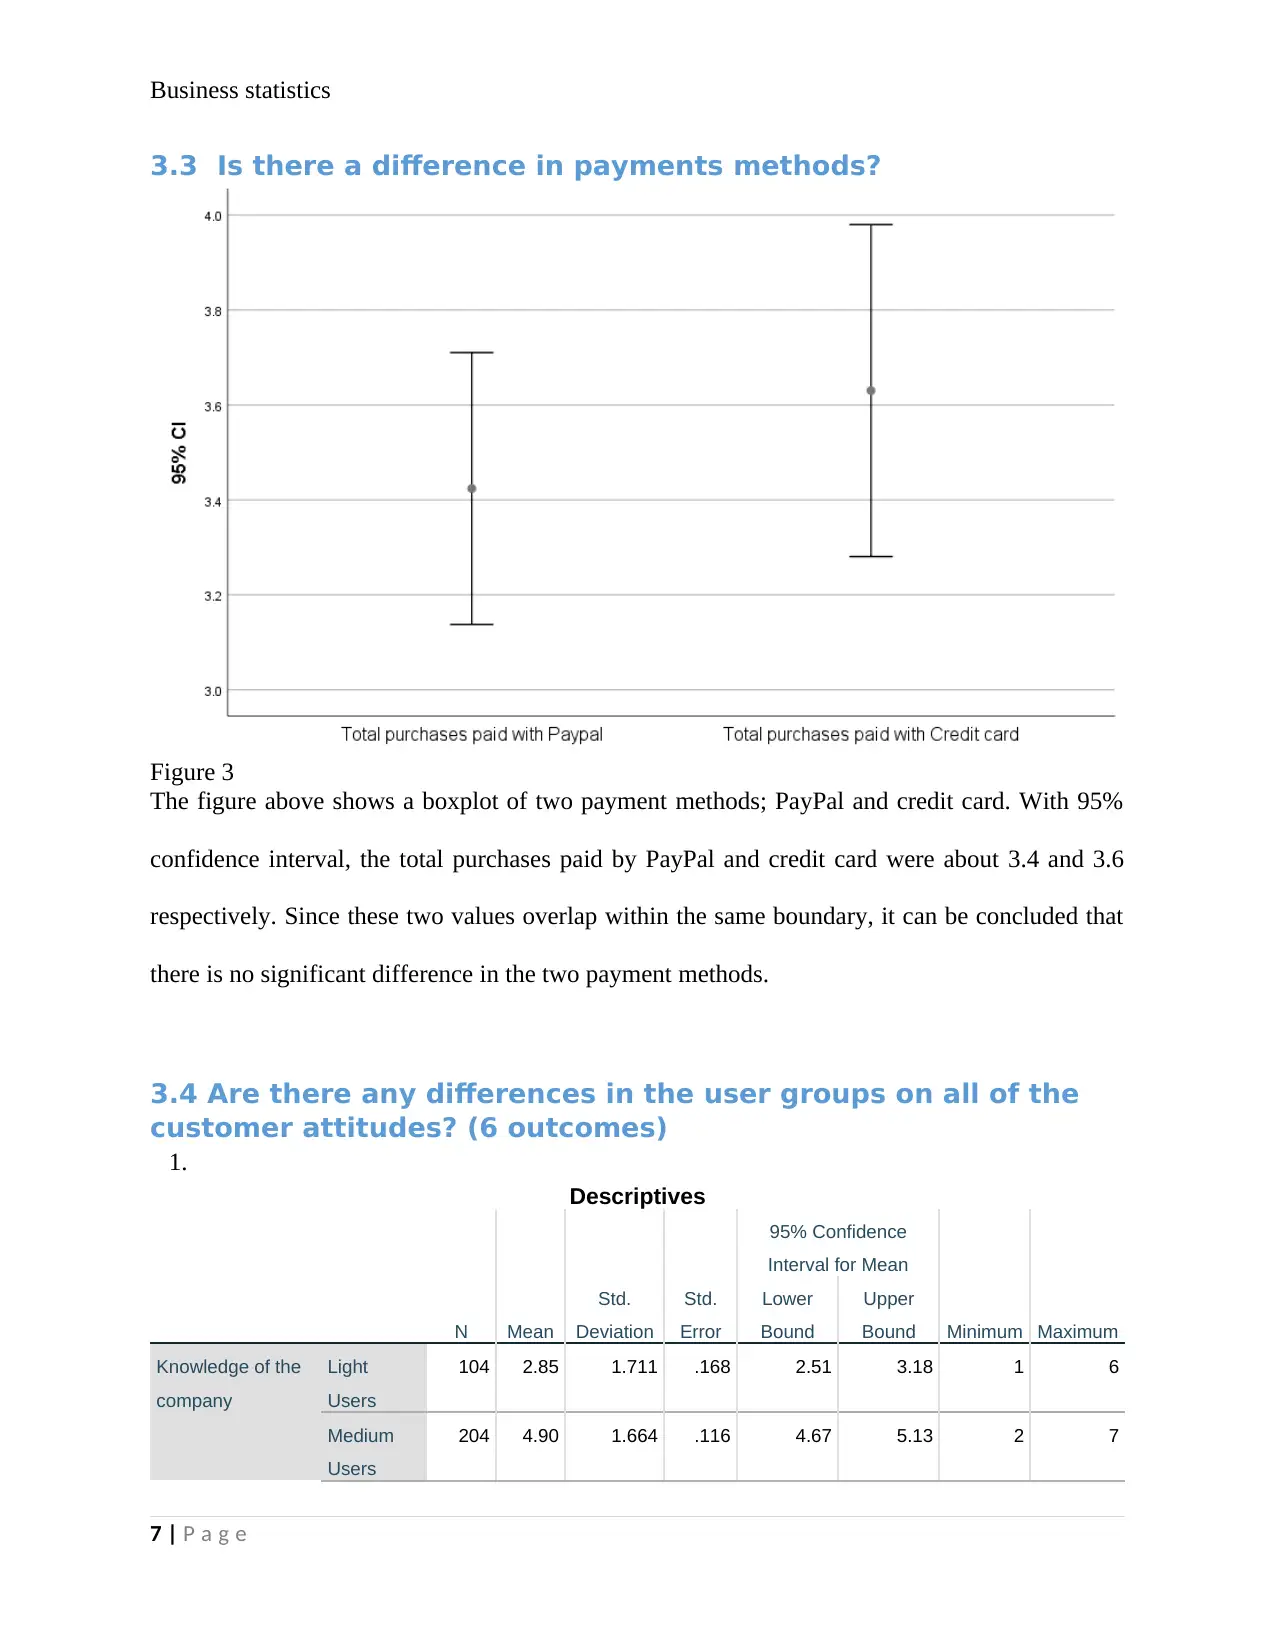
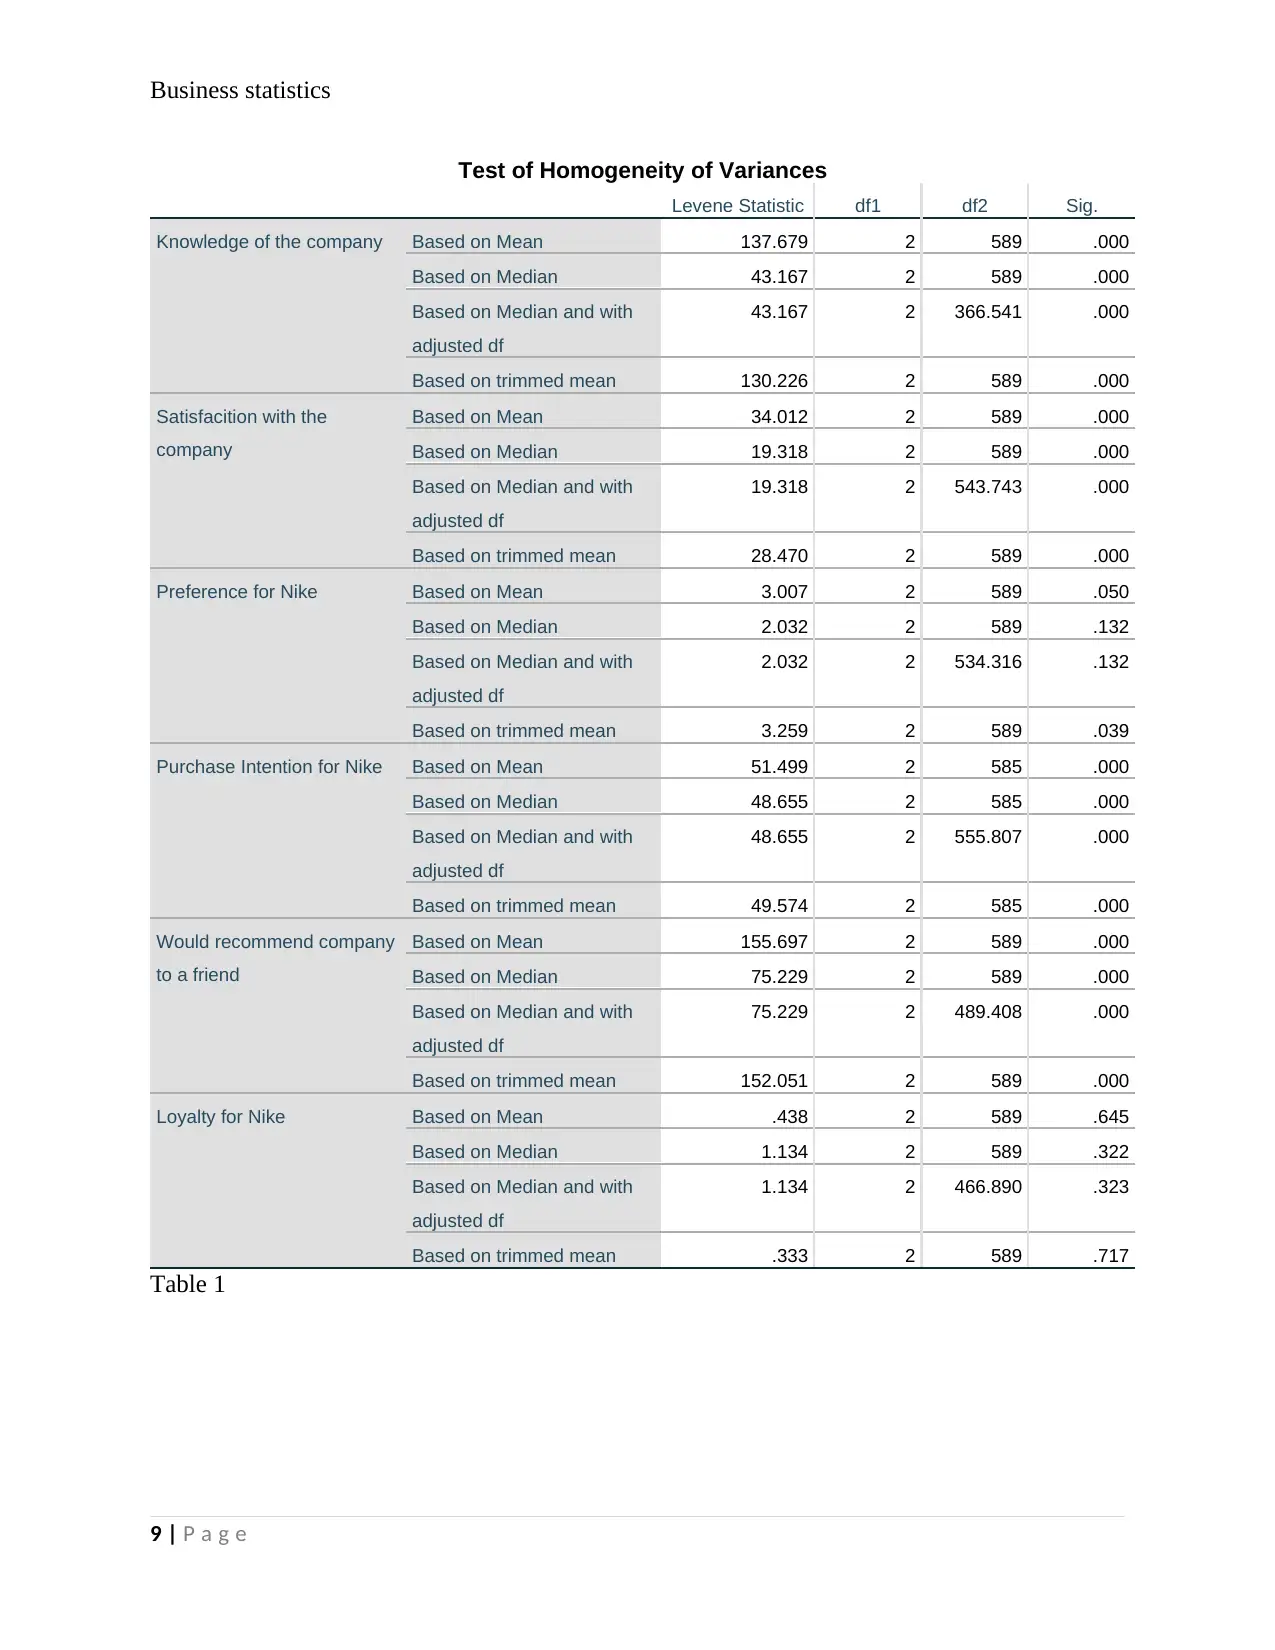
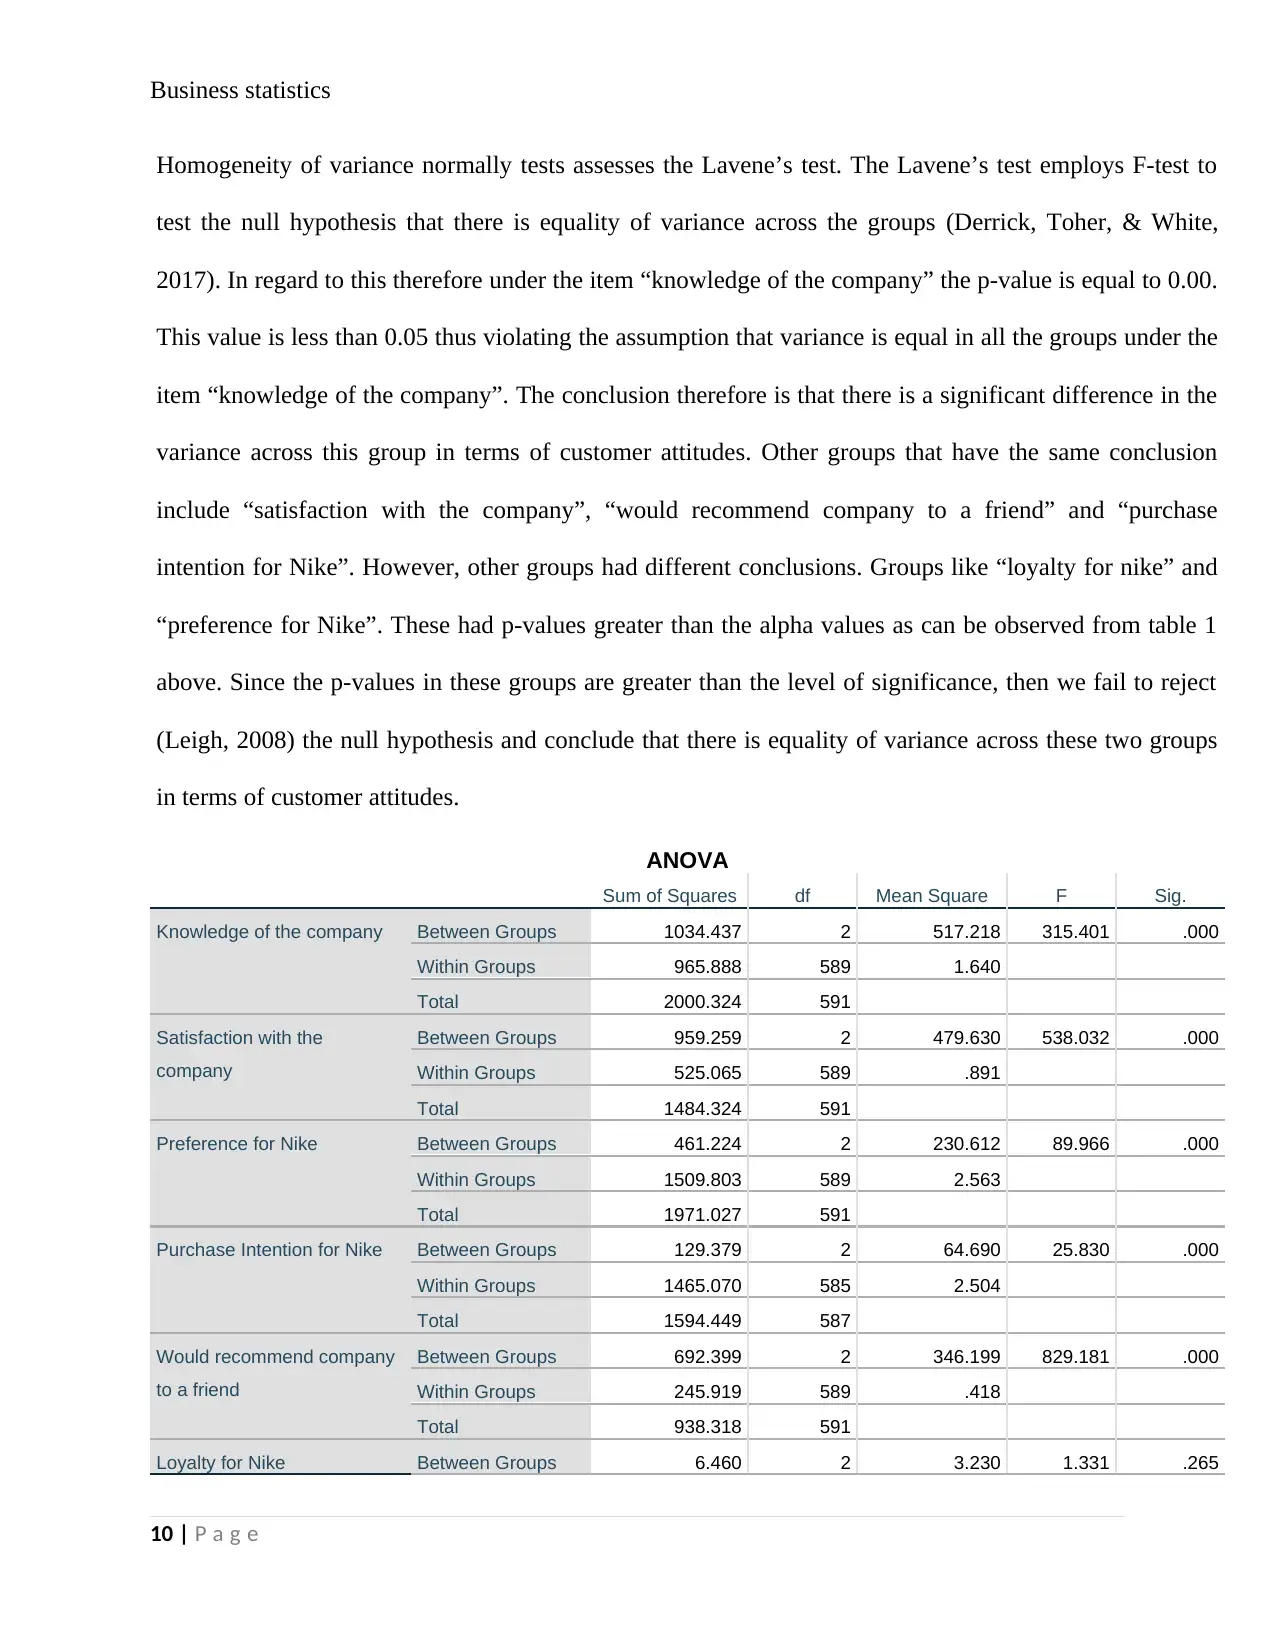
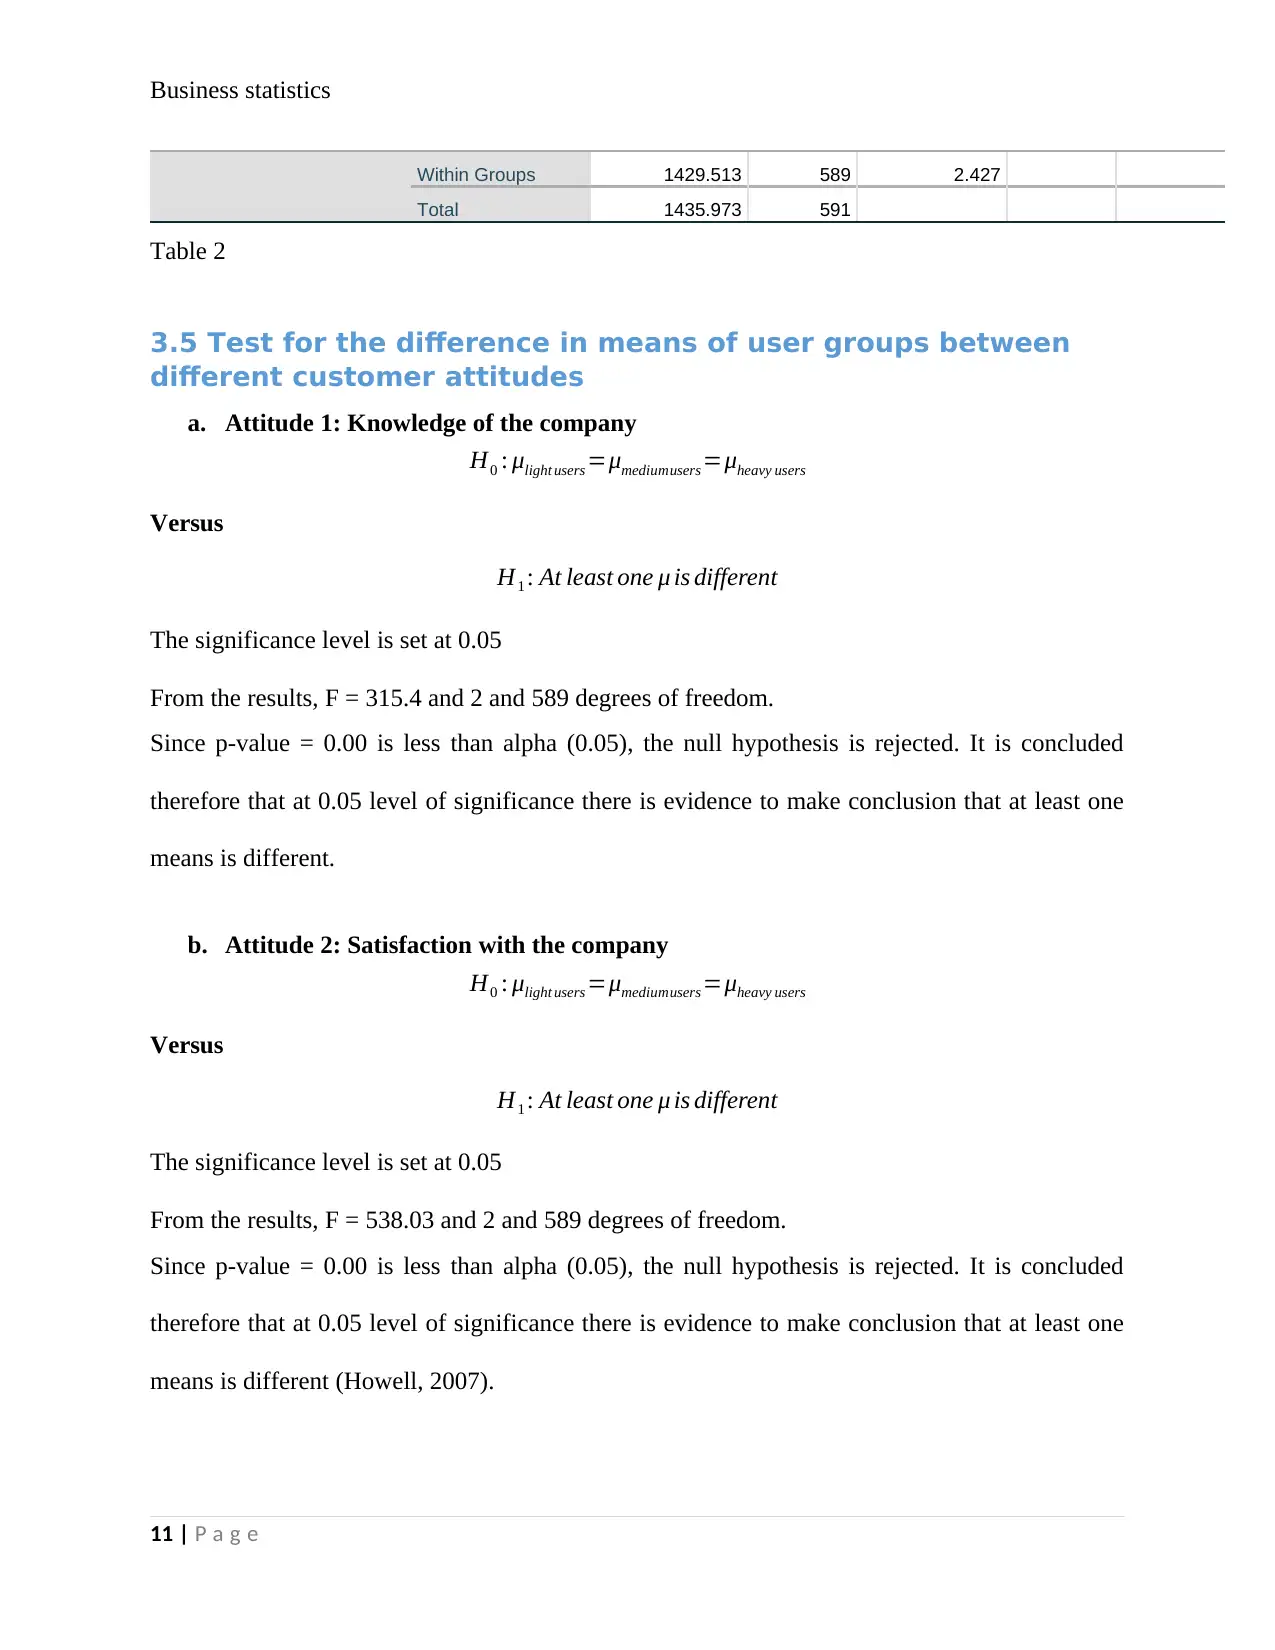
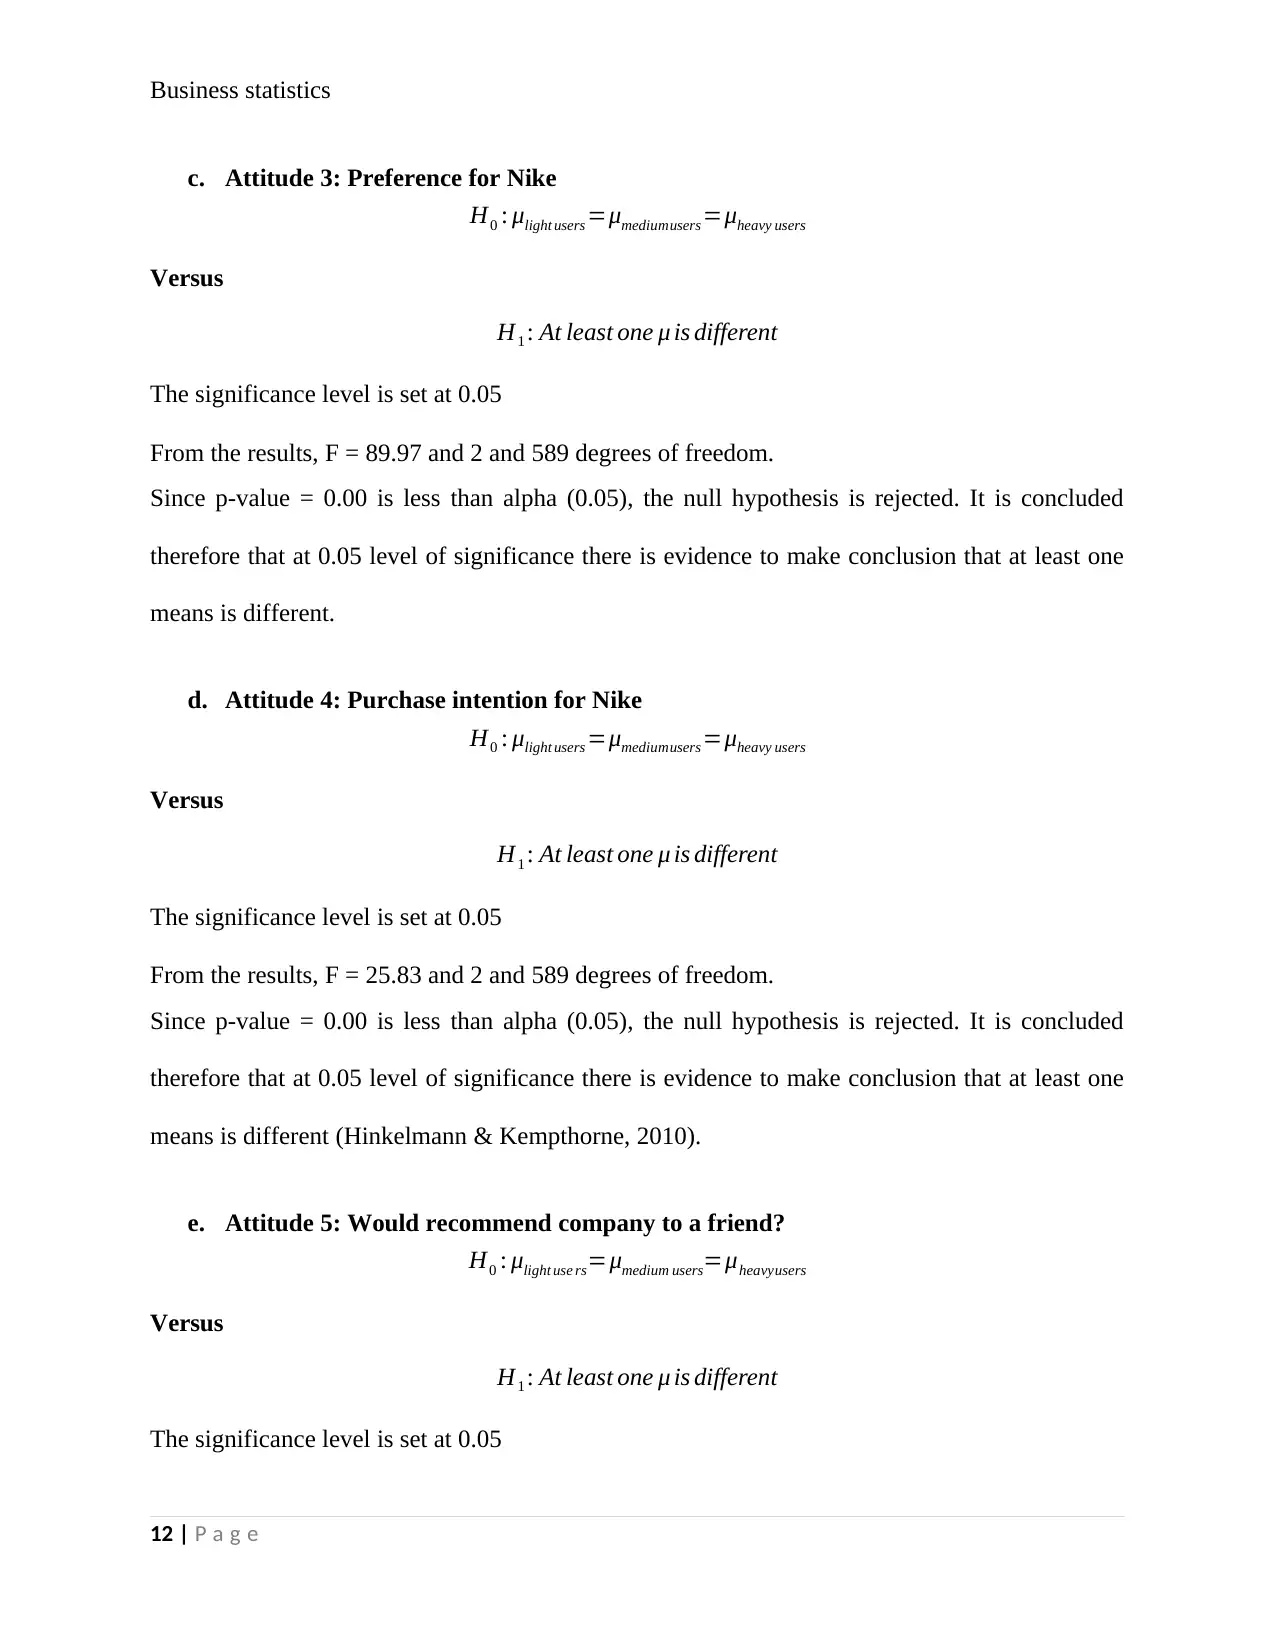
This report provides a detailed statistical analysis of Retail Surge, an online retail company, focusing on key business aspects such as product profitability, cost of goods sold (COGS), payment method differences, and customer attitudes across different user groups and genders. The analysis employs various statistical tests, including ANOVA and independent sample t-tests, to determine significant differences and relationships within the data. Key findings include the identification of customized products as the most profitable and costly category, the lack of significant difference between PayPal and credit card payment methods, and significant variations in customer attitudes (knowledge, satisfaction, preference, purchase intention, and recommendation) among different user groups (light, medium, and heavy users). Gender differences in customer attitudes were also examined, revealing statistically significant variations in several key areas. The report concludes with a discussion of these findings and potential recommendations for Retail Surge to optimize its business strategies based on the data-driven insights.
1 out of 28
Related Documents


Your All-in-One AI-Powered Toolkit for Academic Success.
+13062052269
info@desklib.com
Available 24*7 on WhatsApp / Email
![[object Object]](/_next/static/media/star-bottom.7253800d.svg)
Copyright © 2020–2026 A2Z Services. All Rights Reserved. Developed and managed by ZUCOL.