Quantitative Analysis of Retention and Graduation Rates in US Colleges
VerifiedAdded on 2023/04/21
|13
|1938
|150
Report
AI Summary
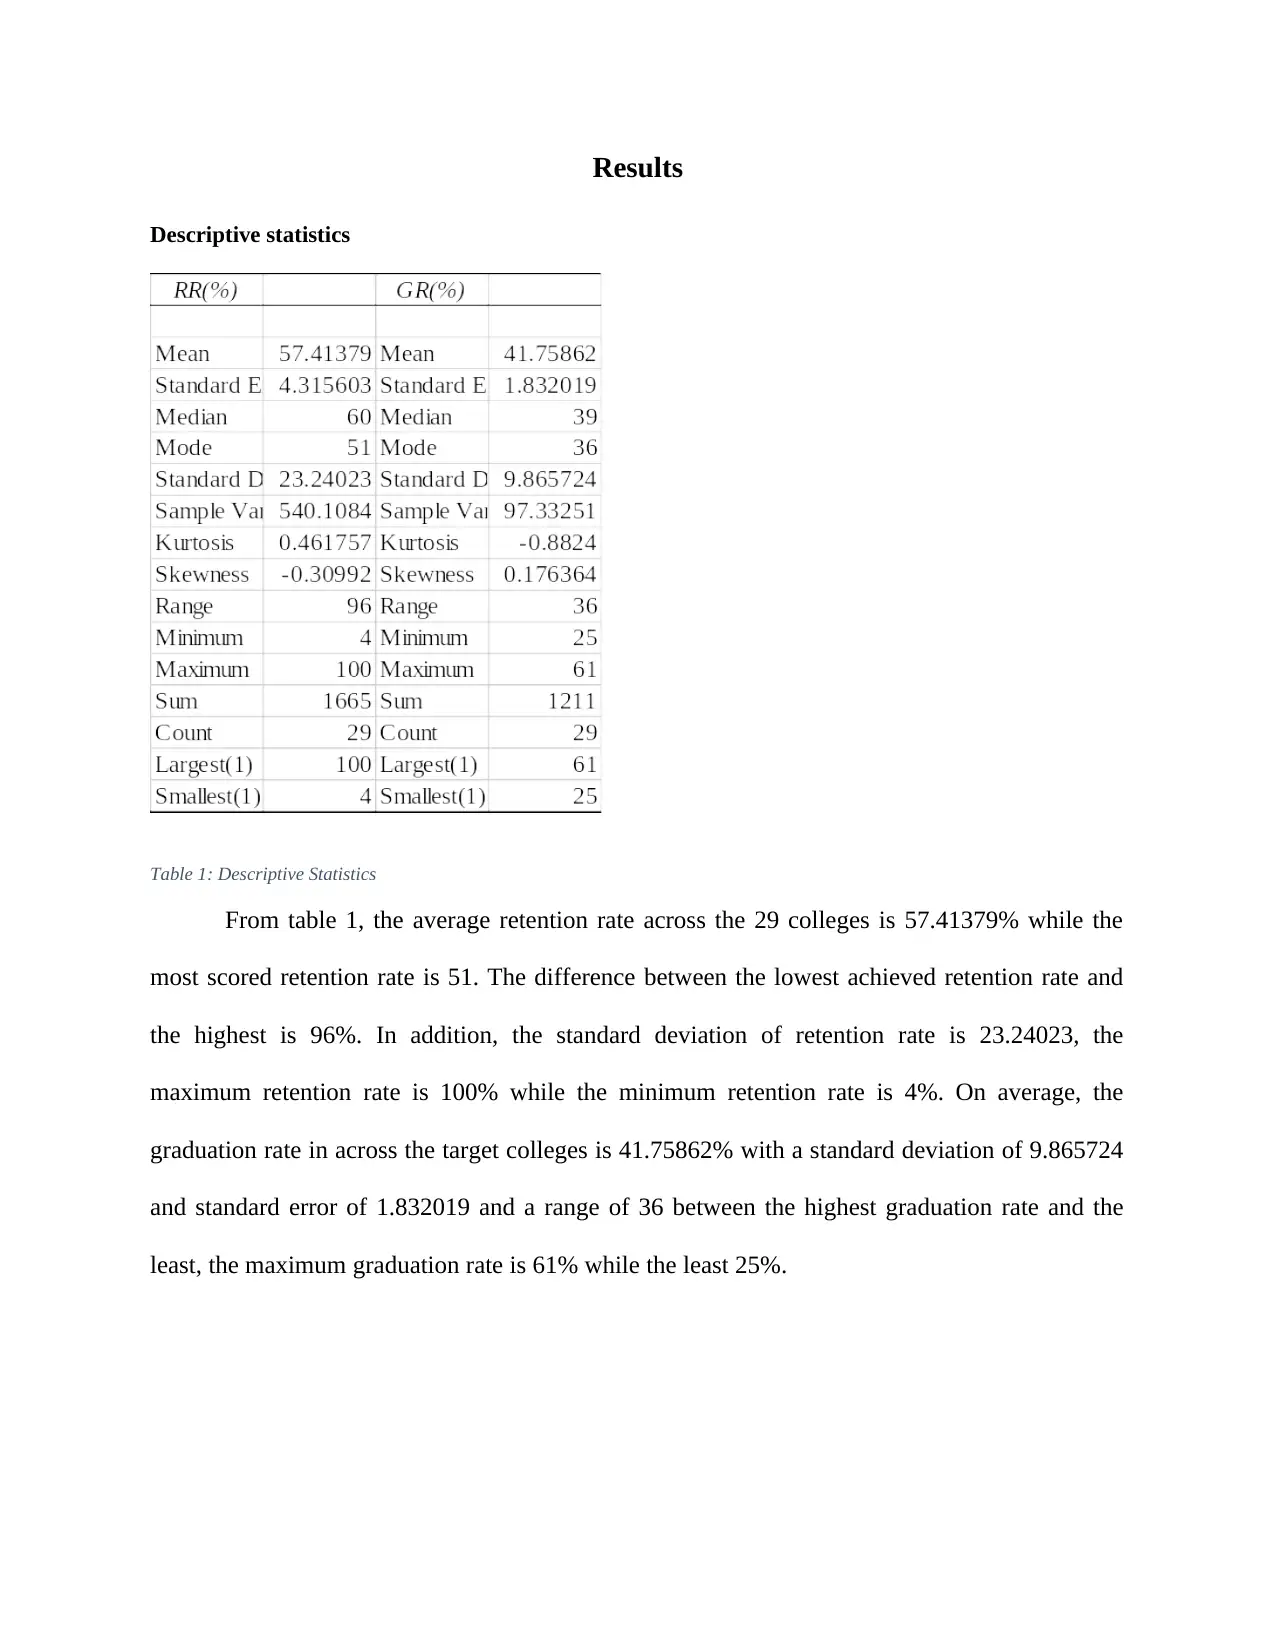
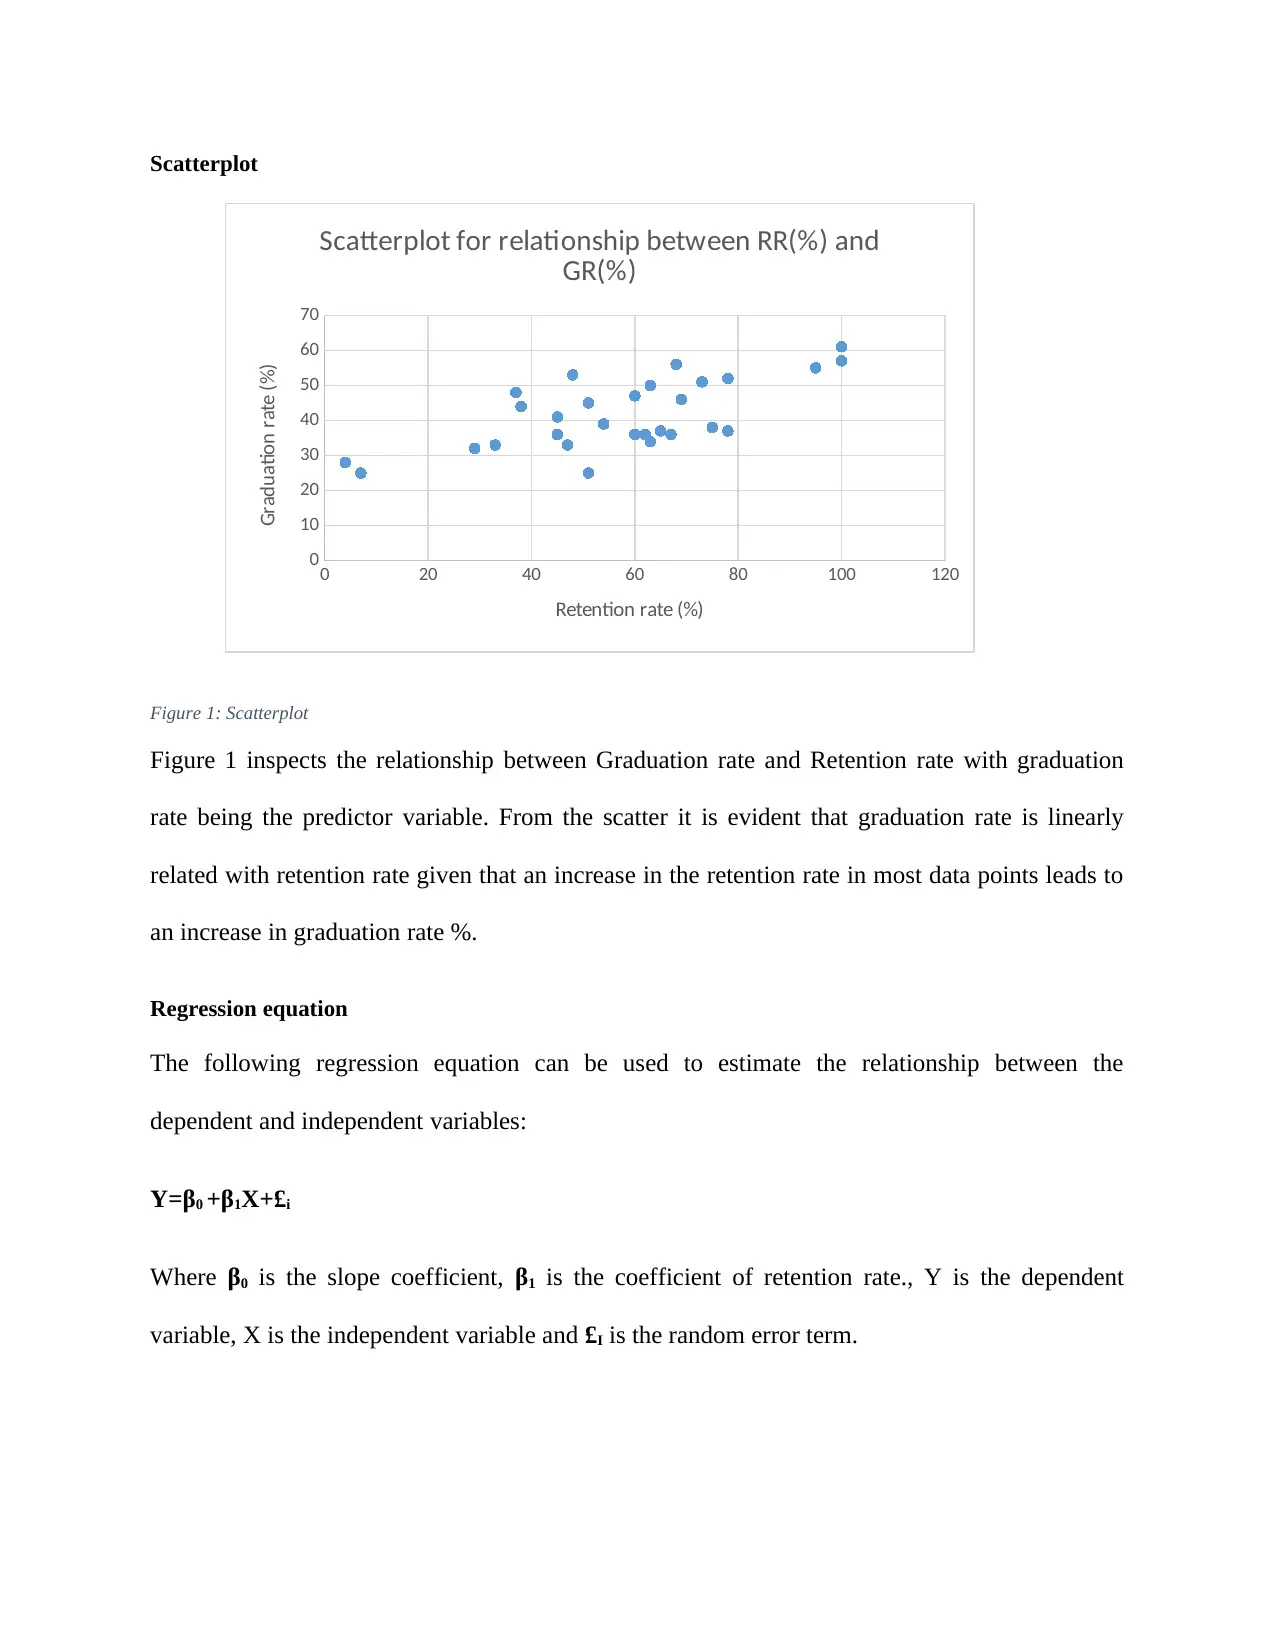
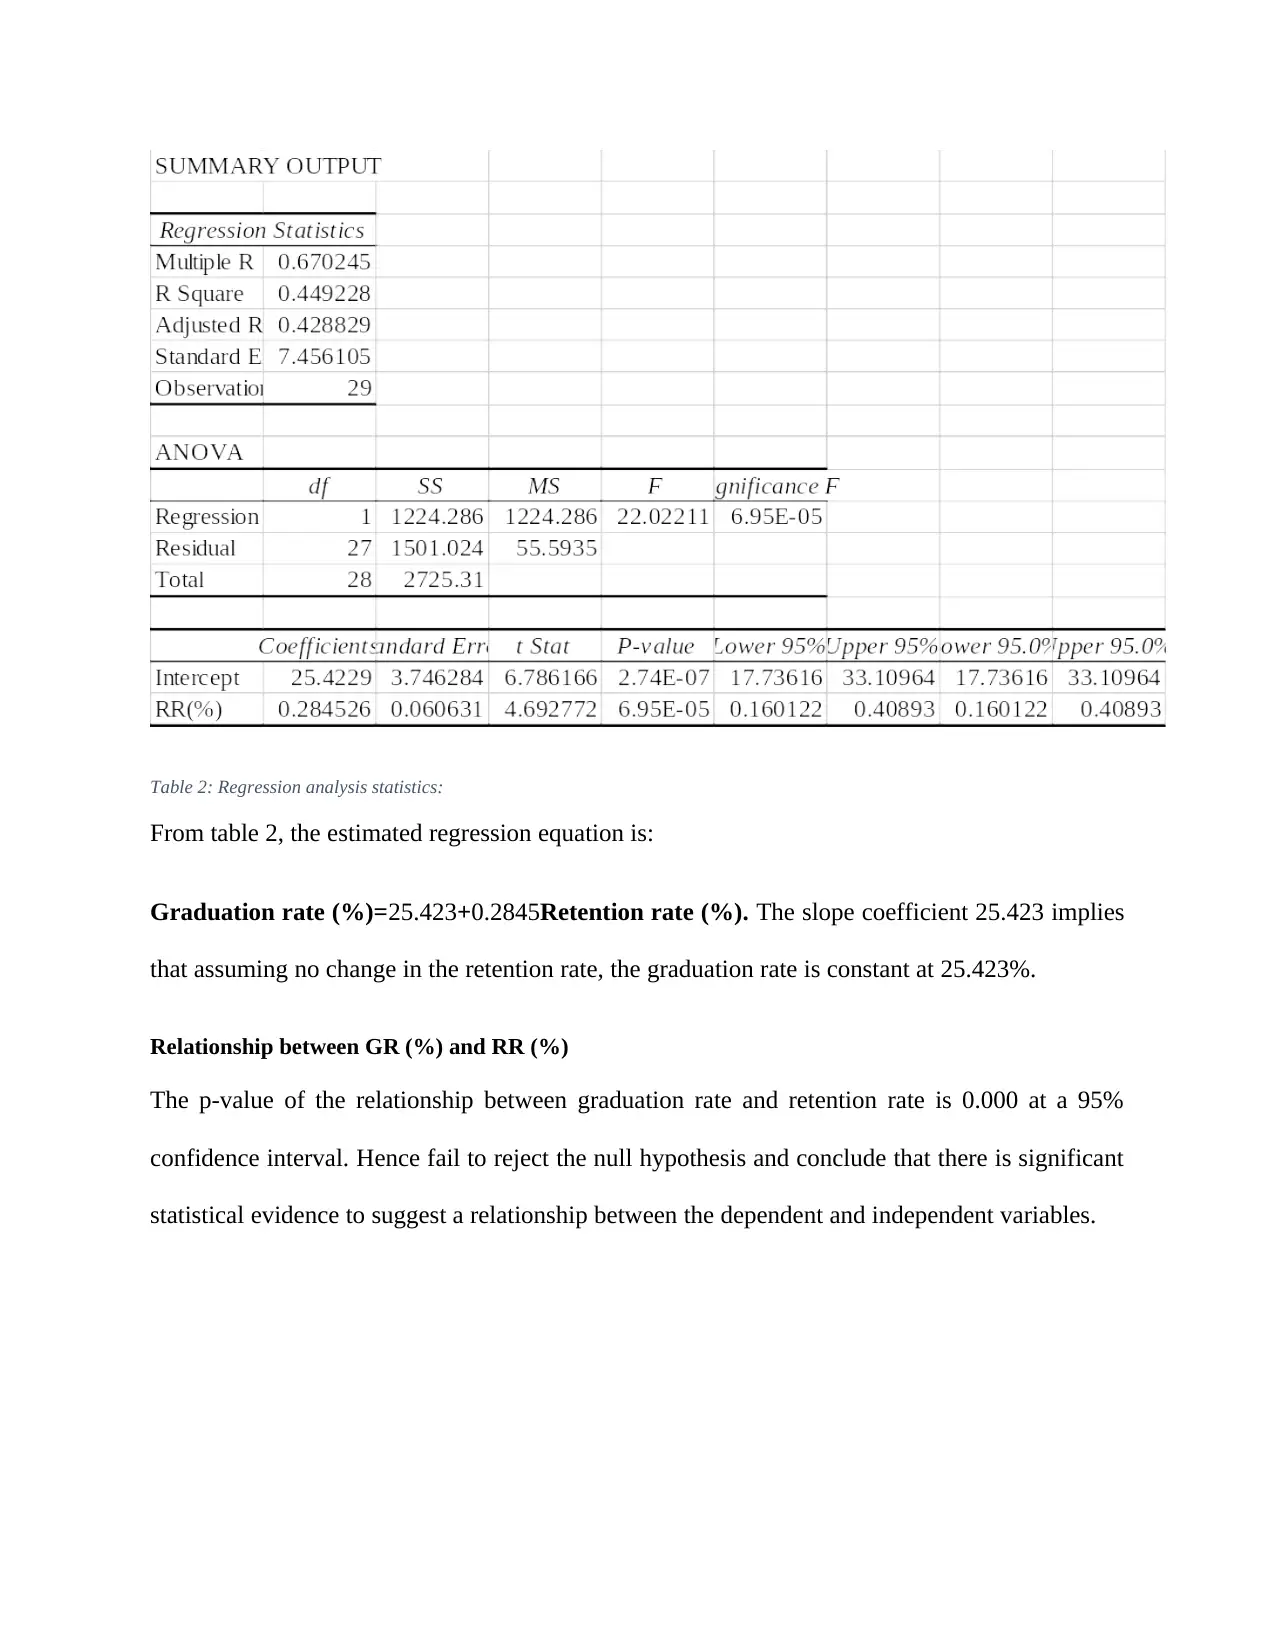
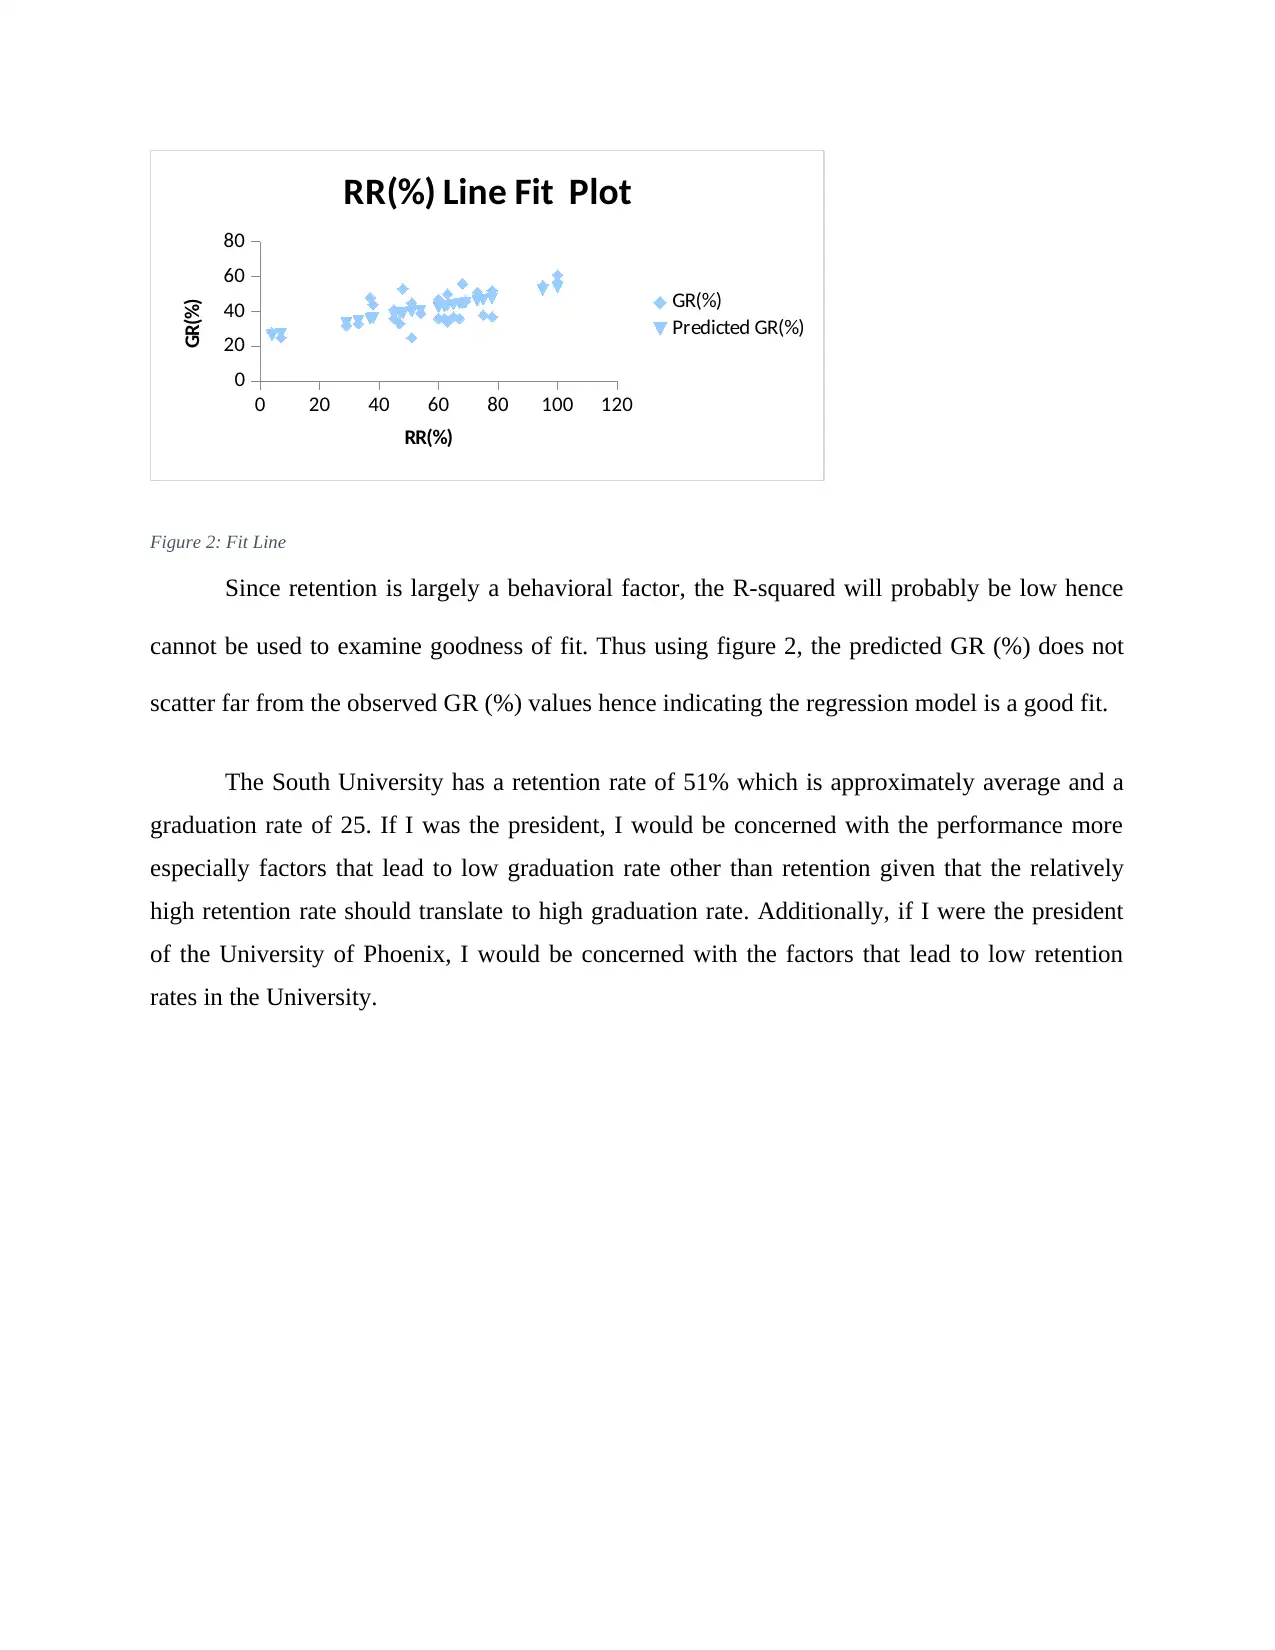
This report investigates the relationship between retention rate and graduation rate in US colleges using quantitative analysis. The study utilizes a dataset from an online education database, examining the retention and graduation rates of 29 online colleges. The analysis employs descriptive statistics, scatterplots, and linear regression to determine the correlation between the two variables. The findings indicate a statistically significant positive relationship between retention rate and graduation rate, supporting the hypothesis. The report also discusses the limitations of the study, such as the small sample size, and provides recommendations for college administrations to improve student retention and graduation rates, including implementing support programs, diversifying academic offerings, and considering full-time student programs. The study highlights the importance of understanding the factors influencing student success and its implications for college performance.

2019
Economics and Quantitative Data analysis
Relationship between retention Rate and graduation rate
Student Name
Economics and Quantitative Data analysis
Relationship between retention Rate and graduation rate
Student Name
Secure Best Marks with AI Grader
Need help grading? Try our AI Grader for instant feedback on your assignments.

Purpose
Primarily, whereas graduation rate is defined as the percentage of enrolled first-year
undergraduate entrants who finish their program in approximately 150% of their scheduled time,
retention rate is the percentage of first time first year entrants who subsequently continue with
their program in the following year.
The objective of this paper is to use quantitative analysis methods in order analyze the
data related to retention rate and graduation rate in US to determine if there is a relationship
between retention rate and graduation rate.

Background
Throughout the academic world, it is almost impossible to refute the contribution of
higher education to the enrichment of a wide range of academic fields, be it technical, new
researches, management etcetera. However, over the recent years the difference between the
number of students enrolled in the first year and those that graduate has gained much traction.
Maria (2015) notes that in Argentina, “…Only three out of ten university students graduate.”
Such a figure is scary for economic prospects for any country given that persons with technical
skills are particularly fundamental in the economic development of the country.
In a paper on factors that influence student retention in higher education, Jensen (2011)
argues that completion and graduation from higher education institutions not only do the
individual have economic advantages but also contributes to better well-being as well as
improves their civic engagement. Several factors have been shown to affect the ranking of
university, one aspect that influence the choice of a university in which to attend (Sagenmüller,
2018). Of interest on the matter of ranking is studies which have indicated that higher university
ranking relatively translates to higher preparedness of admitted students which ultimately
improves retention rates as well as graduation rate (Simon 2018).
Performance of students is a widely complicated measure to conduct. Evidently due to
the number of parameters involved which on the basic level begins with what performance
implies (Townsend and Wilson, 2011). Kristov (2018) alternatively suggests the “Student
Achievement Measure” should be adopted given its nature that includes evaluation of the wider
picture of student progress and success. That is, instead of using Federal graduation rate as a

measure which basically concentrates on the performance of a student specifically related to a
given institution and fails to capture transfer students who complete their studies elsewhere.
From the above literature it is evident that retention rate and graduation rate is an
interesting topic as it is crucial which is evolving over time as a parameter that might be used to
measure say economic performance of a country in fields requiring college graduates and how it
relates to the overall economic growth of such a country.
Secure Best Marks with AI Grader
Need help grading? Try our AI Grader for instant feedback on your assignments.

Method
Data
For this study, the dataset is obtained from “Online Education Database” with 3 variables
(College, Retention rate, Graduation rate). It contains 2 variables which give information on
retention rate as well as graduation rate both in percentage for the 29 online colleges in the
United States. The dataset does not have any missing values.
Empirical approach
This study seeks to address the question as to whether there exists a relationship between
retention rate and graduation rate. As such, in order to address the preceding question, the
following hypothesis is formulated:
Null hypothesis
College retention rate sufficiently affects the graduation rate
Alternative hypothesis
There is no relationship between college retention rate and graduation rate.
The original hypothesis will be tested using determining the kind of relationship existing
between the response variable (Graduation rate) and the predictor variable (Retention rate) by
application of simple linear regression. The null hypothesis will be rejected if the p-value is
greater than 0.05 at 95% confidence interval. In determination on the significance of the model
for this study a Fisher’s test will be used at 95% confidence interval.

Results
Descriptive statistics
Table 1: Descriptive Statistics
From table 1, the average retention rate across the 29 colleges is 57.41379% while the
most scored retention rate is 51. The difference between the lowest achieved retention rate and
the highest is 96%. In addition, the standard deviation of retention rate is 23.24023, the
maximum retention rate is 100% while the minimum retention rate is 4%. On average, the
graduation rate in across the target colleges is 41.75862% with a standard deviation of 9.865724
and standard error of 1.832019 and a range of 36 between the highest graduation rate and the
least, the maximum graduation rate is 61% while the least 25%.

Scatterplot
0 20 40 60 80 100 120
0
10
20
30
40
50
60
70
Scatterplot for relationship between RR(%) and
GR(%)
Retention rate (%)
Graduation rate (%)
Figure 1: Scatterplot
Figure 1 inspects the relationship between Graduation rate and Retention rate with graduation
rate being the predictor variable. From the scatter it is evident that graduation rate is linearly
related with retention rate given that an increase in the retention rate in most data points leads to
an increase in graduation rate %.
Regression equation
The following regression equation can be used to estimate the relationship between the
dependent and independent variables:
Y=β0 +β1X+£i
Where β0 is the slope coefficient, β1 is the coefficient of retention rate., Y is the dependent
variable, X is the independent variable and £I is the random error term.
Paraphrase This Document
Need a fresh take? Get an instant paraphrase of this document with our AI Paraphraser

Table 2: Regression analysis statistics:
From table 2, the estimated regression equation is:
Graduation rate (%)=25.423+0.2845Retention rate (%). The slope coefficient 25.423 implies
that assuming no change in the retention rate, the graduation rate is constant at 25.423%.
Relationship between GR (%) and RR (%)
The p-value of the relationship between graduation rate and retention rate is 0.000 at a 95%
confidence interval. Hence fail to reject the null hypothesis and conclude that there is significant
statistical evidence to suggest a relationship between the dependent and independent variables.

0 20 40 60 80 100 120
0
20
40
60
80
RR(%) Line Fit Plot
GR(%)
Predicted GR(%)
RR(%)
GR(%)
Figure 2: Fit Line
Since retention is largely a behavioral factor, the R-squared will probably be low hence
cannot be used to examine goodness of fit. Thus using figure 2, the predicted GR (%) does not
scatter far from the observed GR (%) values hence indicating the regression model is a good fit.
The South University has a retention rate of 51% which is approximately average and a
graduation rate of 25. If I was the president, I would be concerned with the performance more
especially factors that lead to low graduation rate other than retention given that the relatively
high retention rate should translate to high graduation rate. Additionally, if I were the president
of the University of Phoenix, I would be concerned with the factors that lead to low retention
rates in the University.

Discussion
From the analysis results, the average retention rate (7.41379%) is higher than the
average graduation rate (41.75862%) implying that apart from retention rate as a measure
affecting graduation rate there are other possible factor that influence graduation rate hence it is
not always true that higher retention rates guarantee higher graduation rates. However, it is
evident that there is a positive relationship between GR (%) and RR (%).
Due to the predictive nature of regression method, using regression analysis is
fundamental in the determining whether there exists a relationship and if the relationship exists,
how does the retention rate affect the graduation rate? In addition, using the estimated regression
equation it is possible to predict graduation rate given different retention rates. The use of a
sample data of size 29 is a major limitation since the results might not be representative of the
real picture in the University population in America.
Simon (2018) notes that higher retention rates ultimately leads to higher retention rates,
results which are consistent with this study’s findings which indicate a relationship between
retention rate and graduation rate. Other supporting findings are those of Maria (2015). The
above study has clear policy implications. Such implications include: usage as a basis to design
studies which investigate factors that cause the difference between retention rate and graduation
rates.
Secure Best Marks with AI Grader
Need help grading? Try our AI Grader for instant feedback on your assignments.

Recommendations
i. In order for the college administrations to increase retention rates, they should introduce
programs which provide support to students in order to cope with factors that lead to
student attrition. Such programs might include: financial aids offered to the economically
challenged students, career counselling as well as promote peer counselling so as to
promote the urge for students to complete their programs.
ii. Higher education institutions should diversify programs offered in order to facilitate a
wider scope of choice to new students given that studies indicate a student is more likely
to complete their program if they do what they are interested in.
iii. Online colleges should adopt full-time student programs as an addition to part-time
programs, considering that retention rate among students pursuing full-time courses is
higher compared to part-time college entrants who are more likely to drop-out. As such,
mechanisms to enable full-time learning amongst online universities should be
formulated if retention rate is to be increased.

References
Jensen, U. (2011). Factors Influencing Student Retention in Higher Education. Kamehameha
School Research and Evaluation, 7 (12), pp.23-39.
Kristov, M. (2018). Why we Need to rethink Conventional Graduation Rates as a Measure of
Colleges Success [Online]. Available from:
https://www.forbes.com/sites/marvinkrislov/2018/07/23/why-we-need-to-rethink-graduation-
rates-as-a-measure-of-colleges-success/1 [Accessed 9th February 2019]
Maria, H. (2015). Only three out of ten university students graduate [Online]. Available from:
https://www.universityworldnews.com/post.php?story=20150422123029167 [Accessed 9th
February 2019].
Sagenmüller, I. (2018). Main Factors That Affect Student Retention in
Higher Education [Online]. Available from:
https://www.u-planner.com/blog/strategies-to-improve-student-retention-in-higher-education
[Accessed 9th February 2019].
Simon, H. (2018). What Does Retention Rate Have to Do with Anything? Stop Using the Phrase
“Safety School”. American Association of Collegiate Registrars and Admissions, 2(6). Pp. 1-7.
Townsend, B., and Wilson, K. (2011). The academic and social integration of
persisting community college transfer students. College Student Retention:
Research, Theory & Practice, 10(4), pp. 405-423.

1 out of 13
Related Documents

Your All-in-One AI-Powered Toolkit for Academic Success.
+13062052269
info@desklib.com
Available 24*7 on WhatsApp / Email
Unlock your academic potential
© 2024 | Zucol Services PVT LTD | All rights reserved.