Analyzing Revenue Trends for Business Decisions in Tour Company

Verified

Added on  2023/04/04

|17
|517
|82
Report
AI Summary
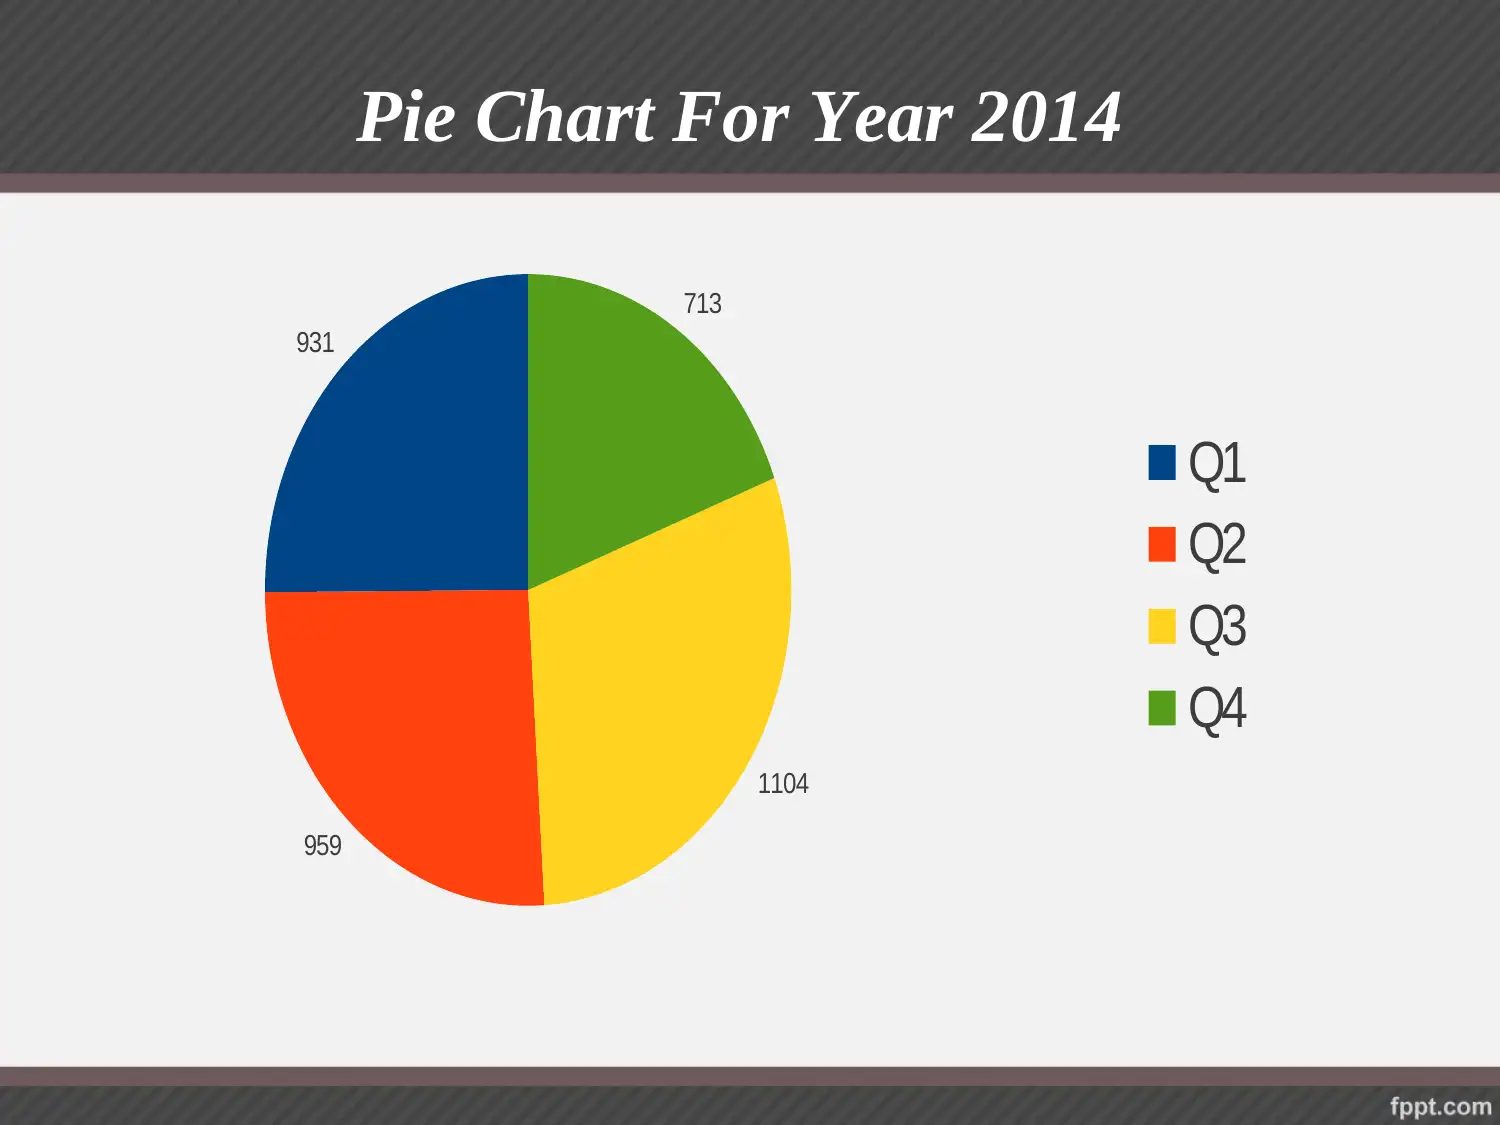
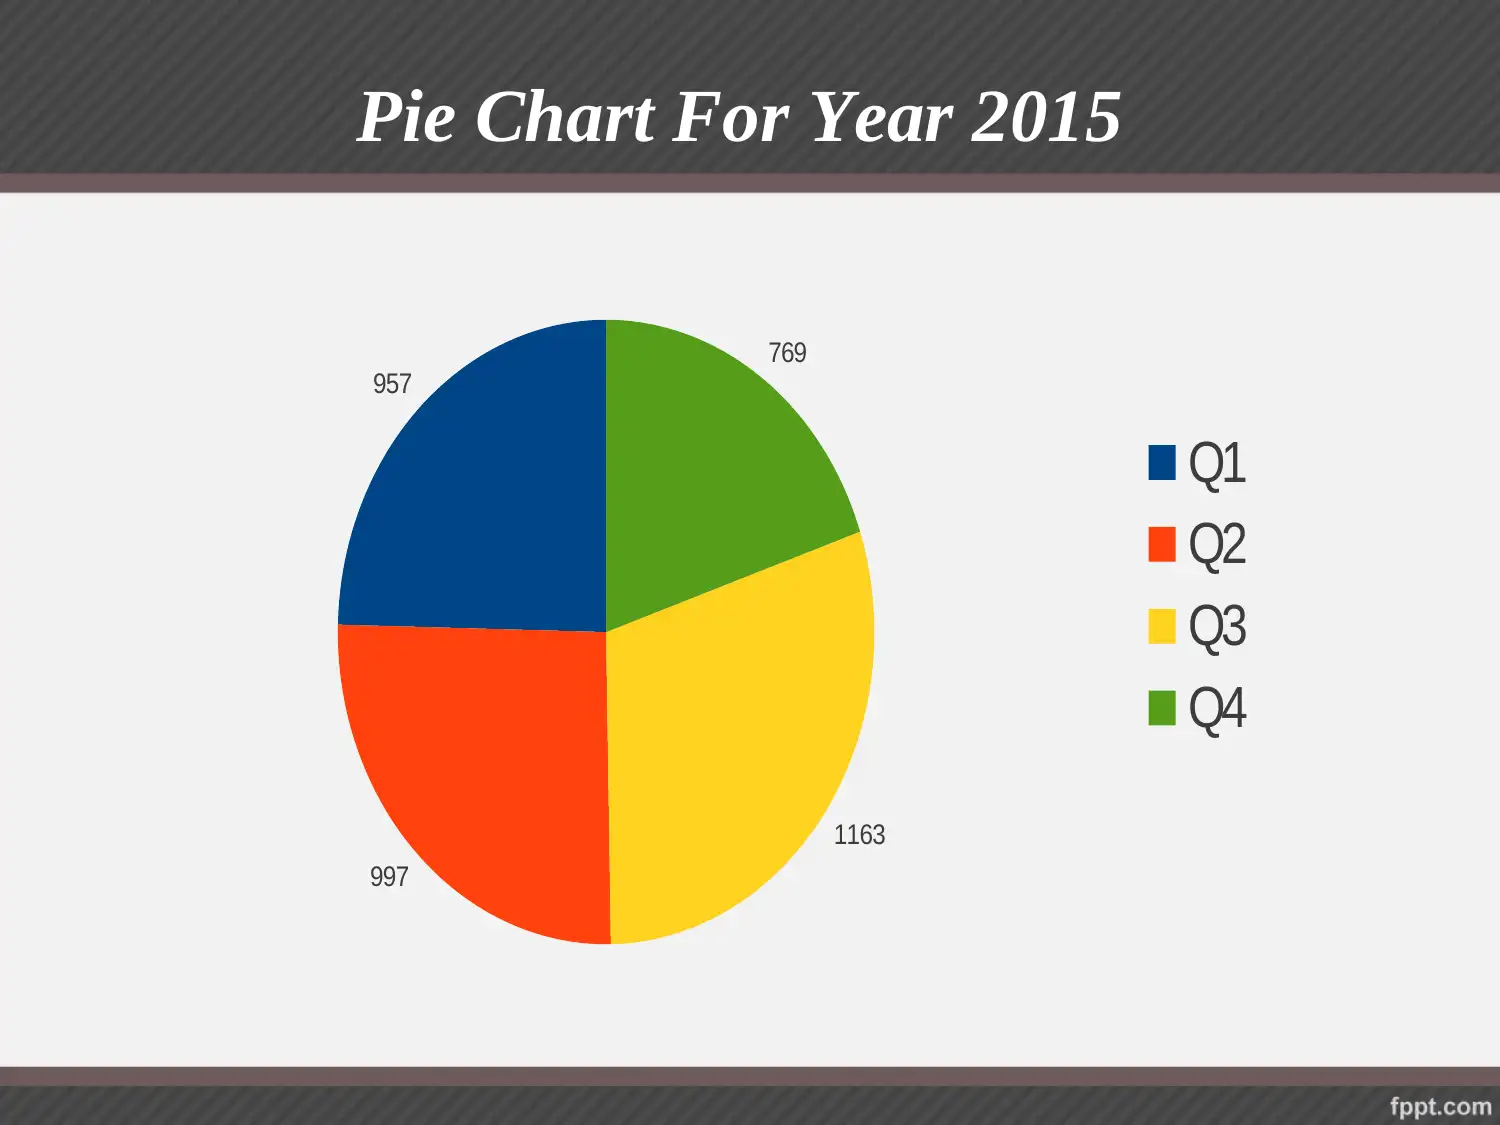
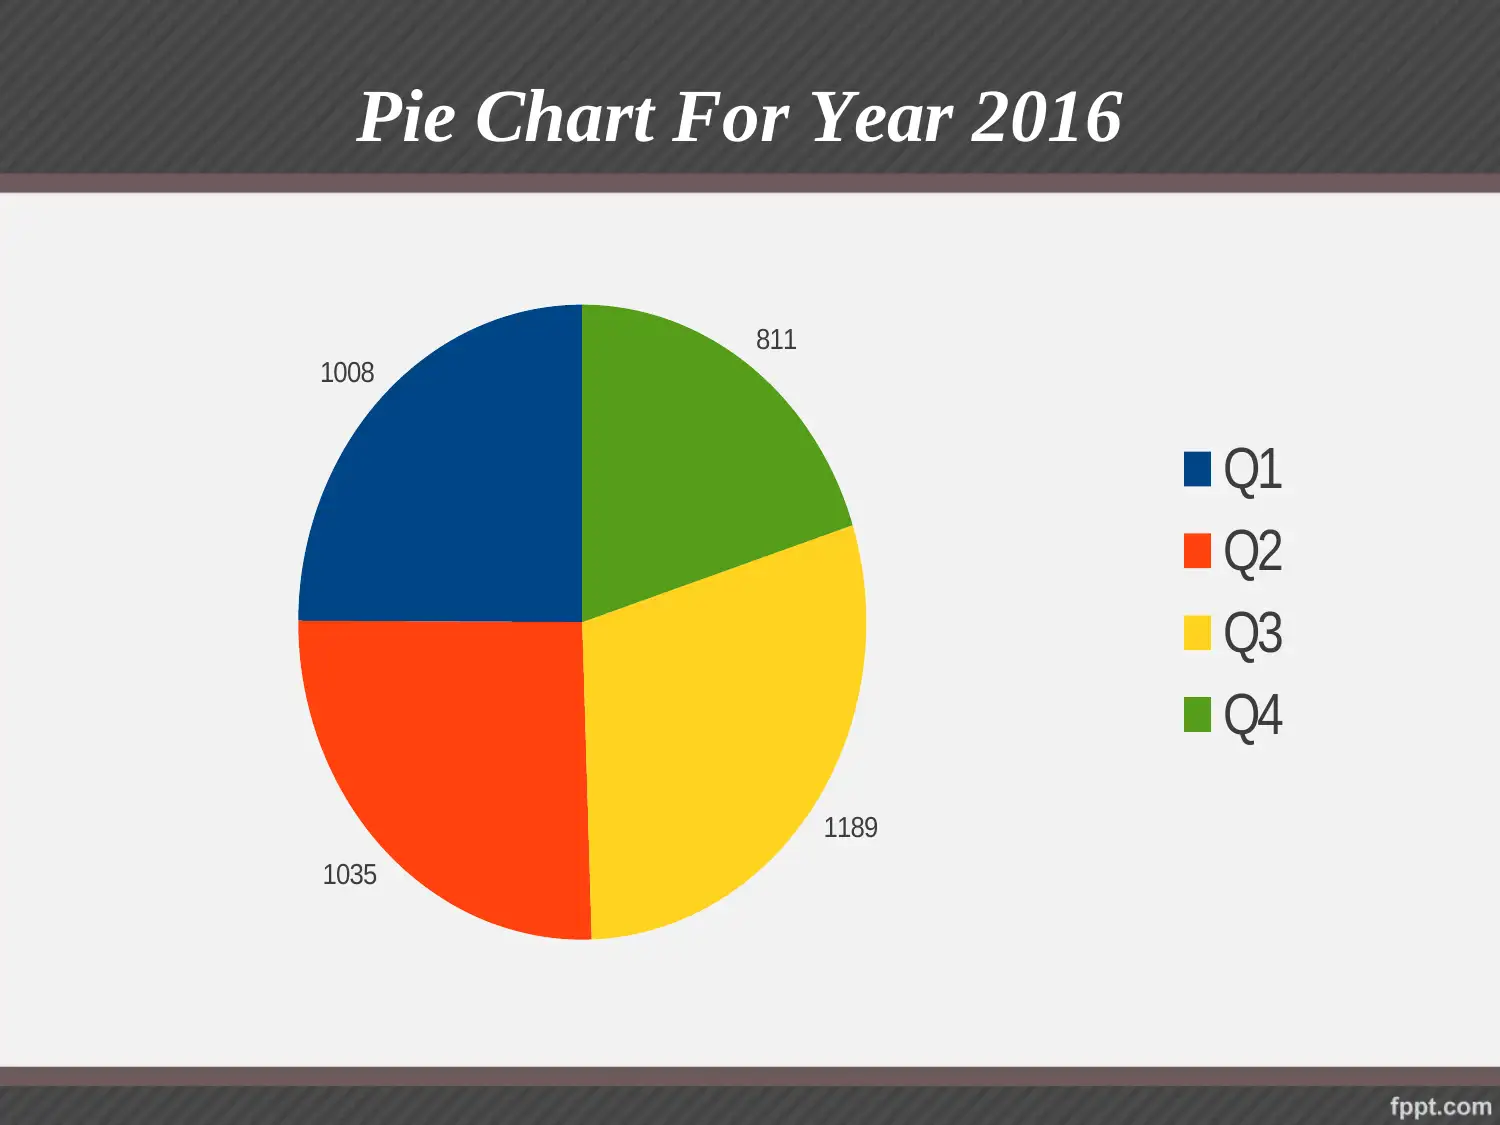
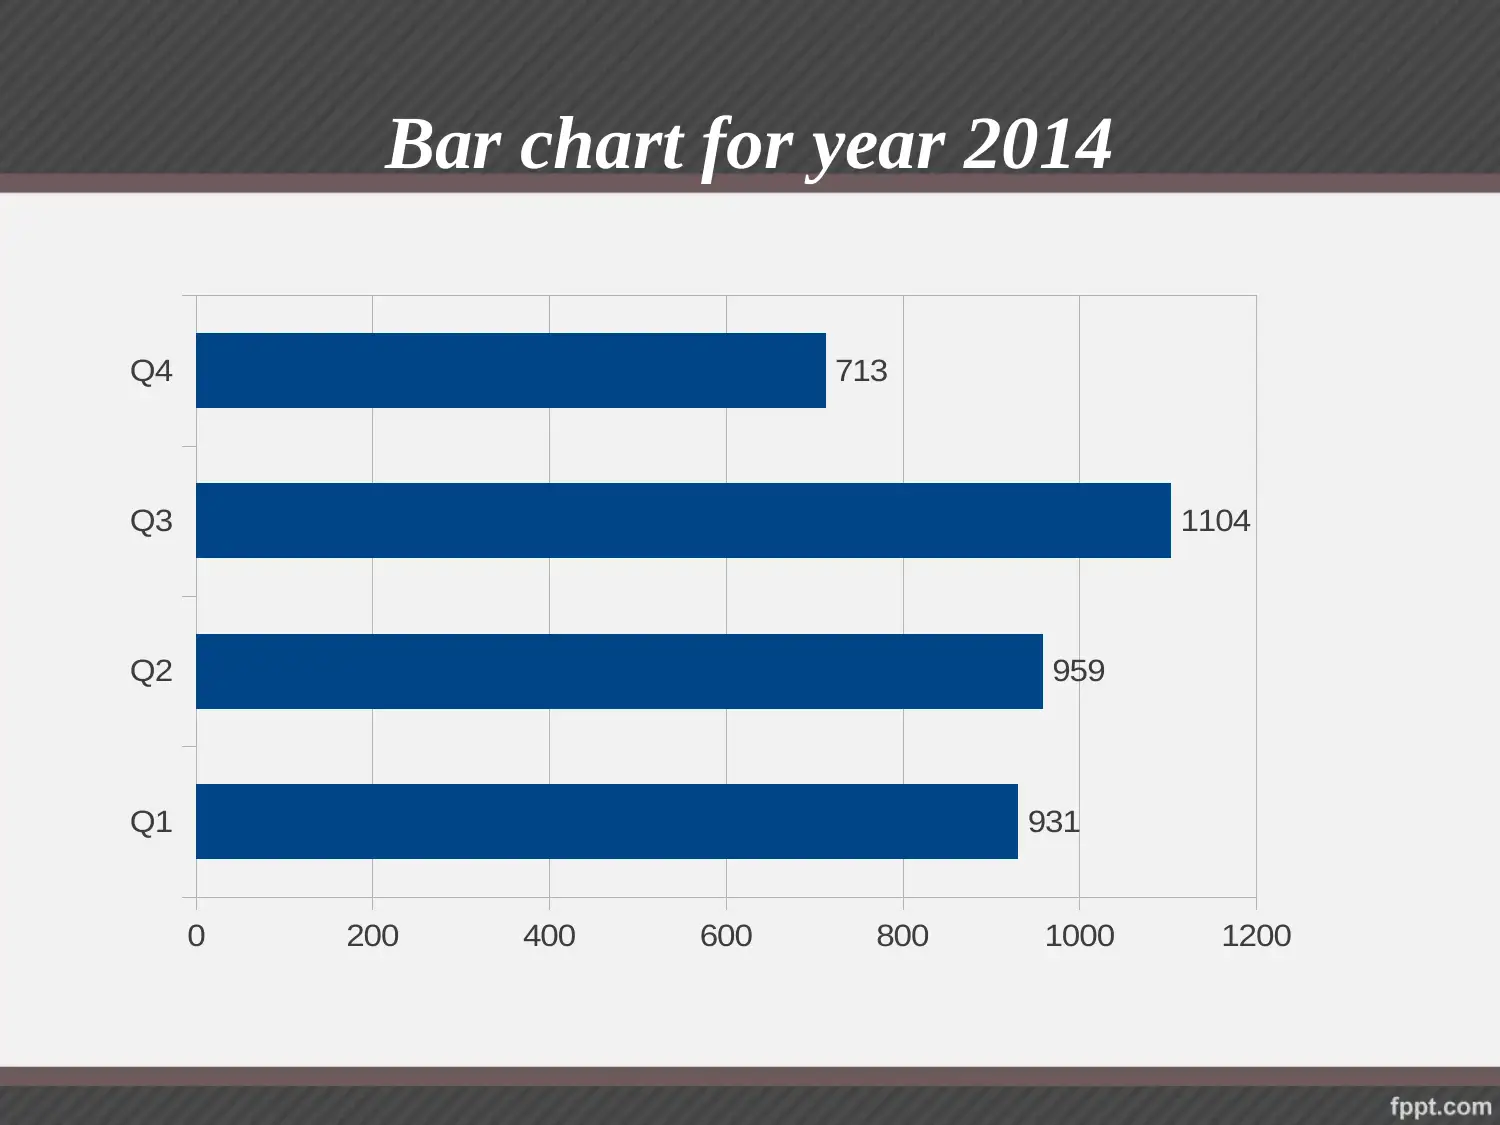
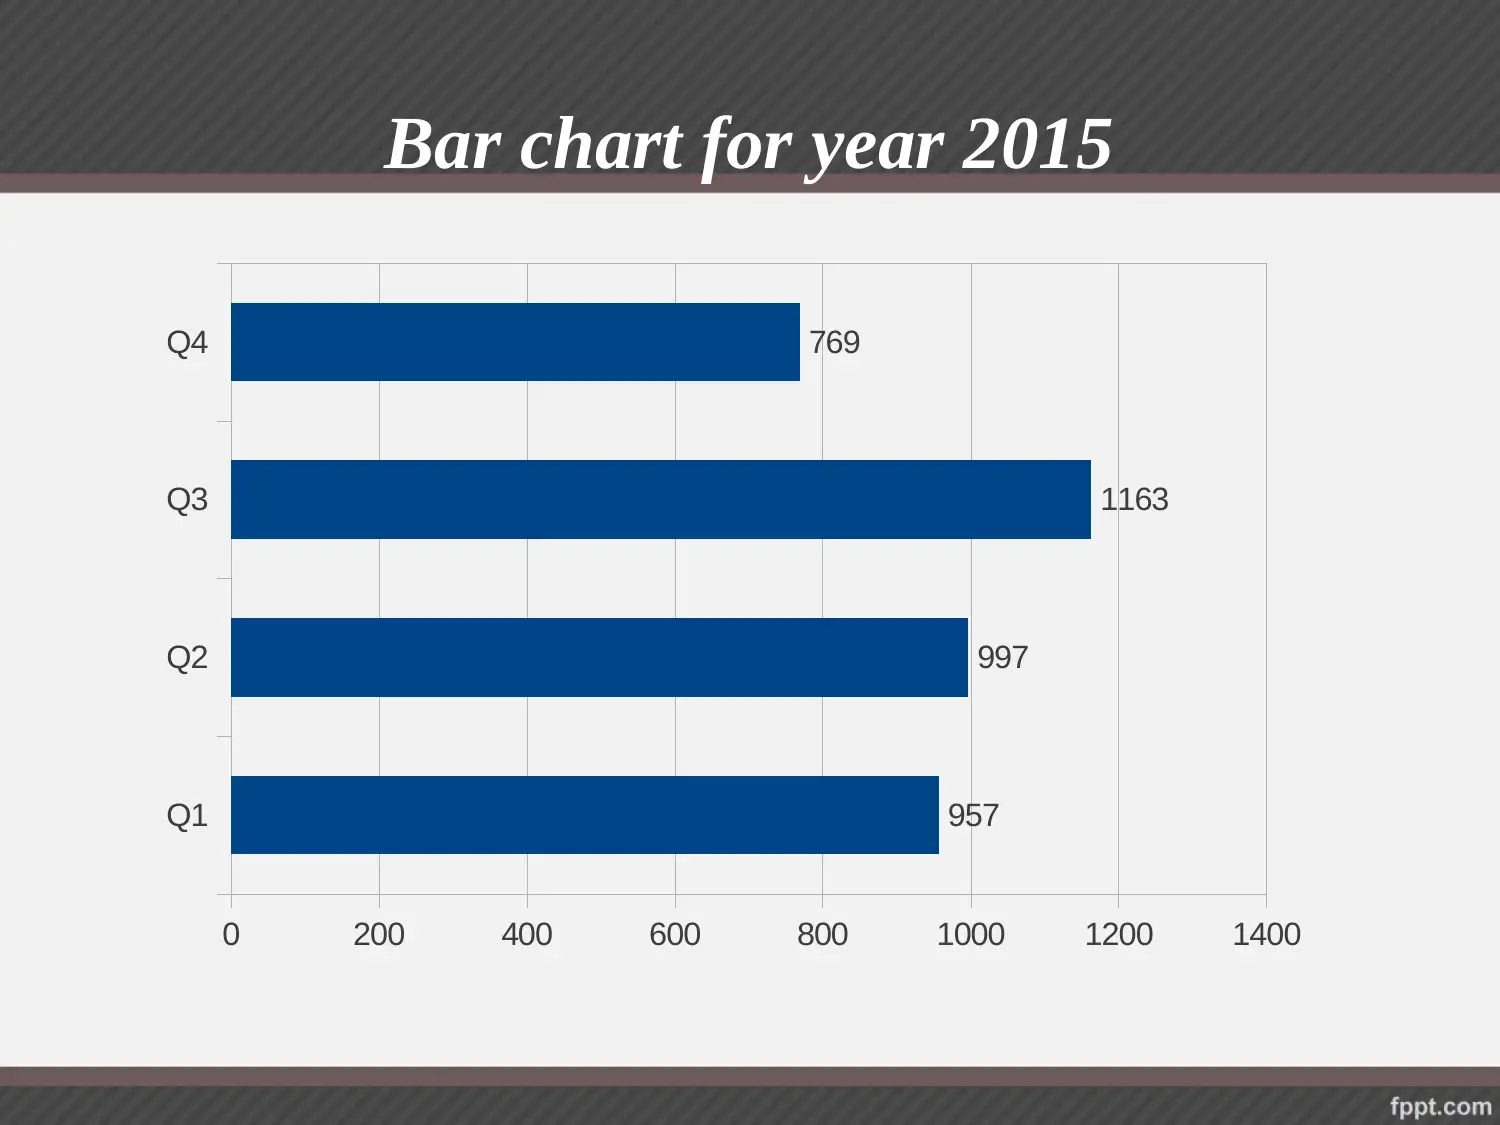
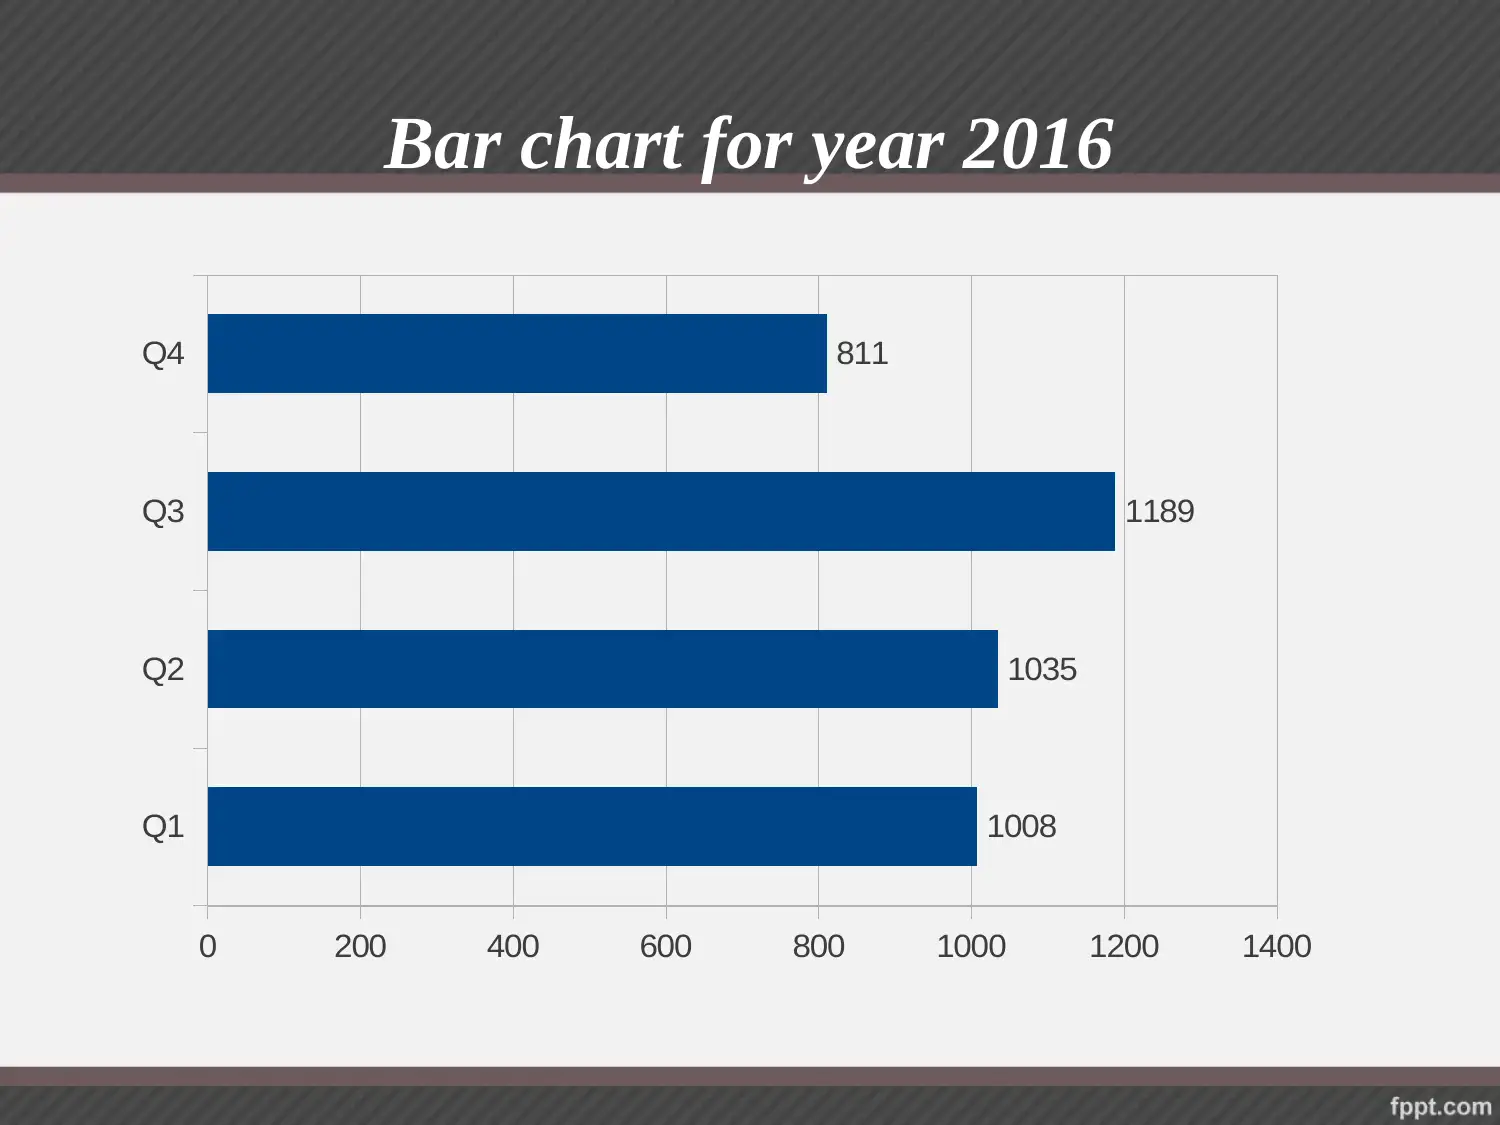
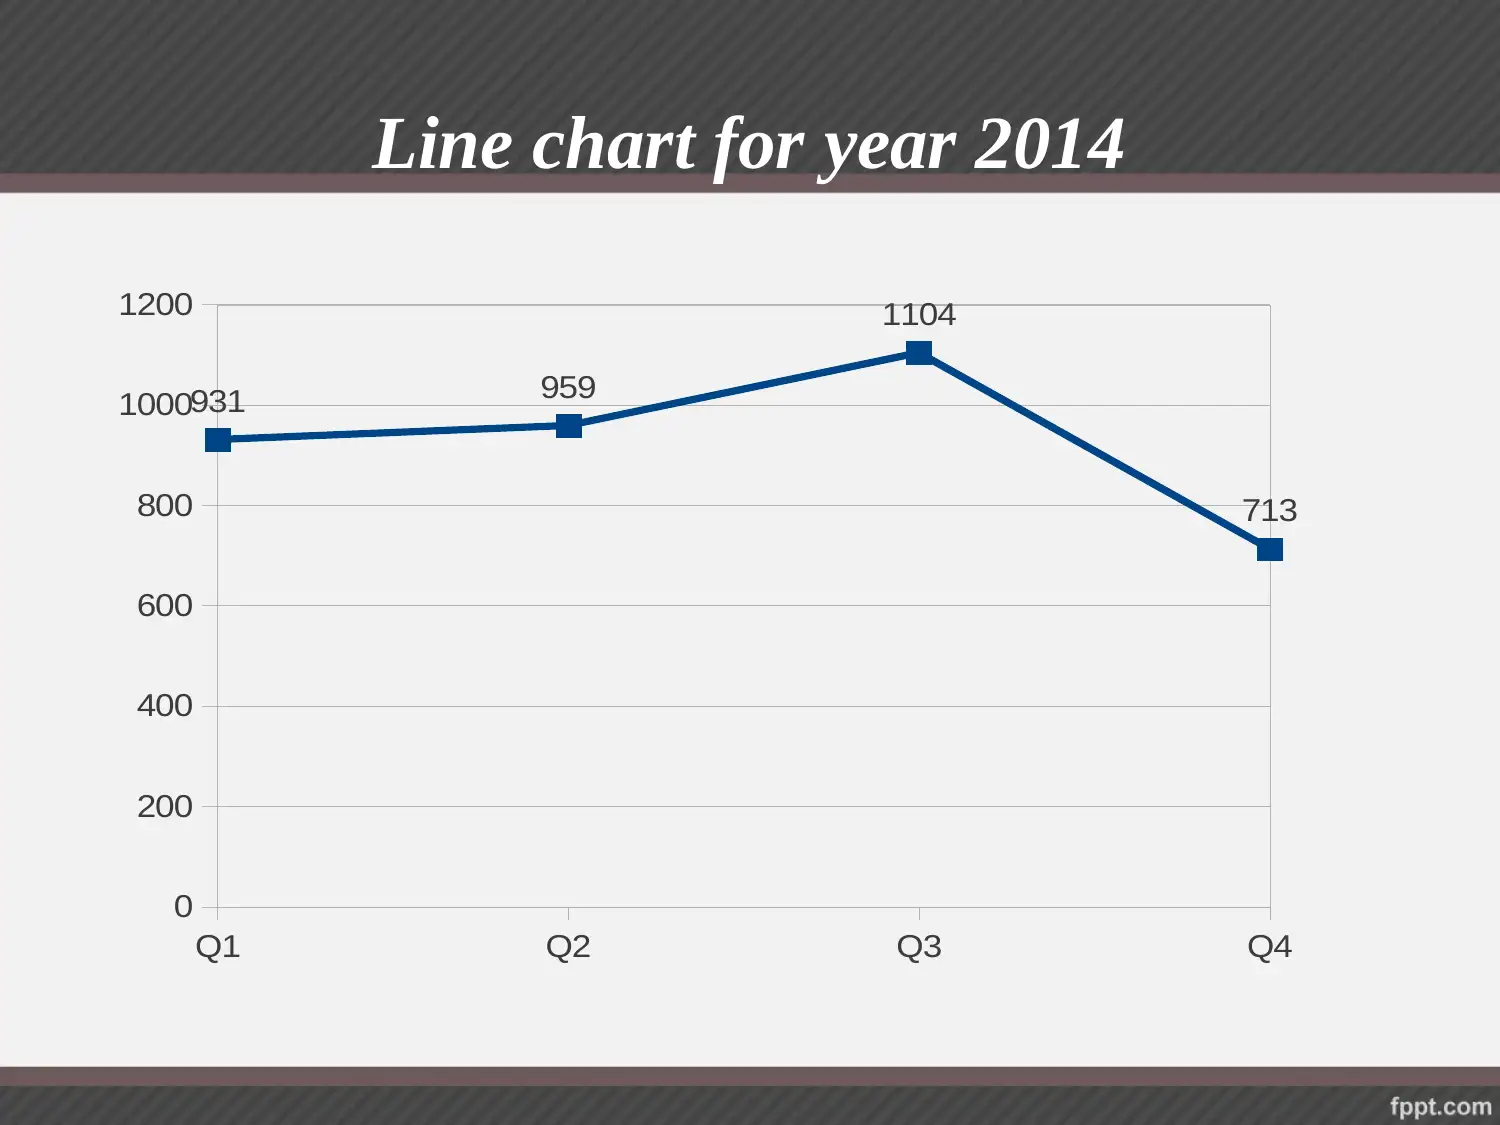
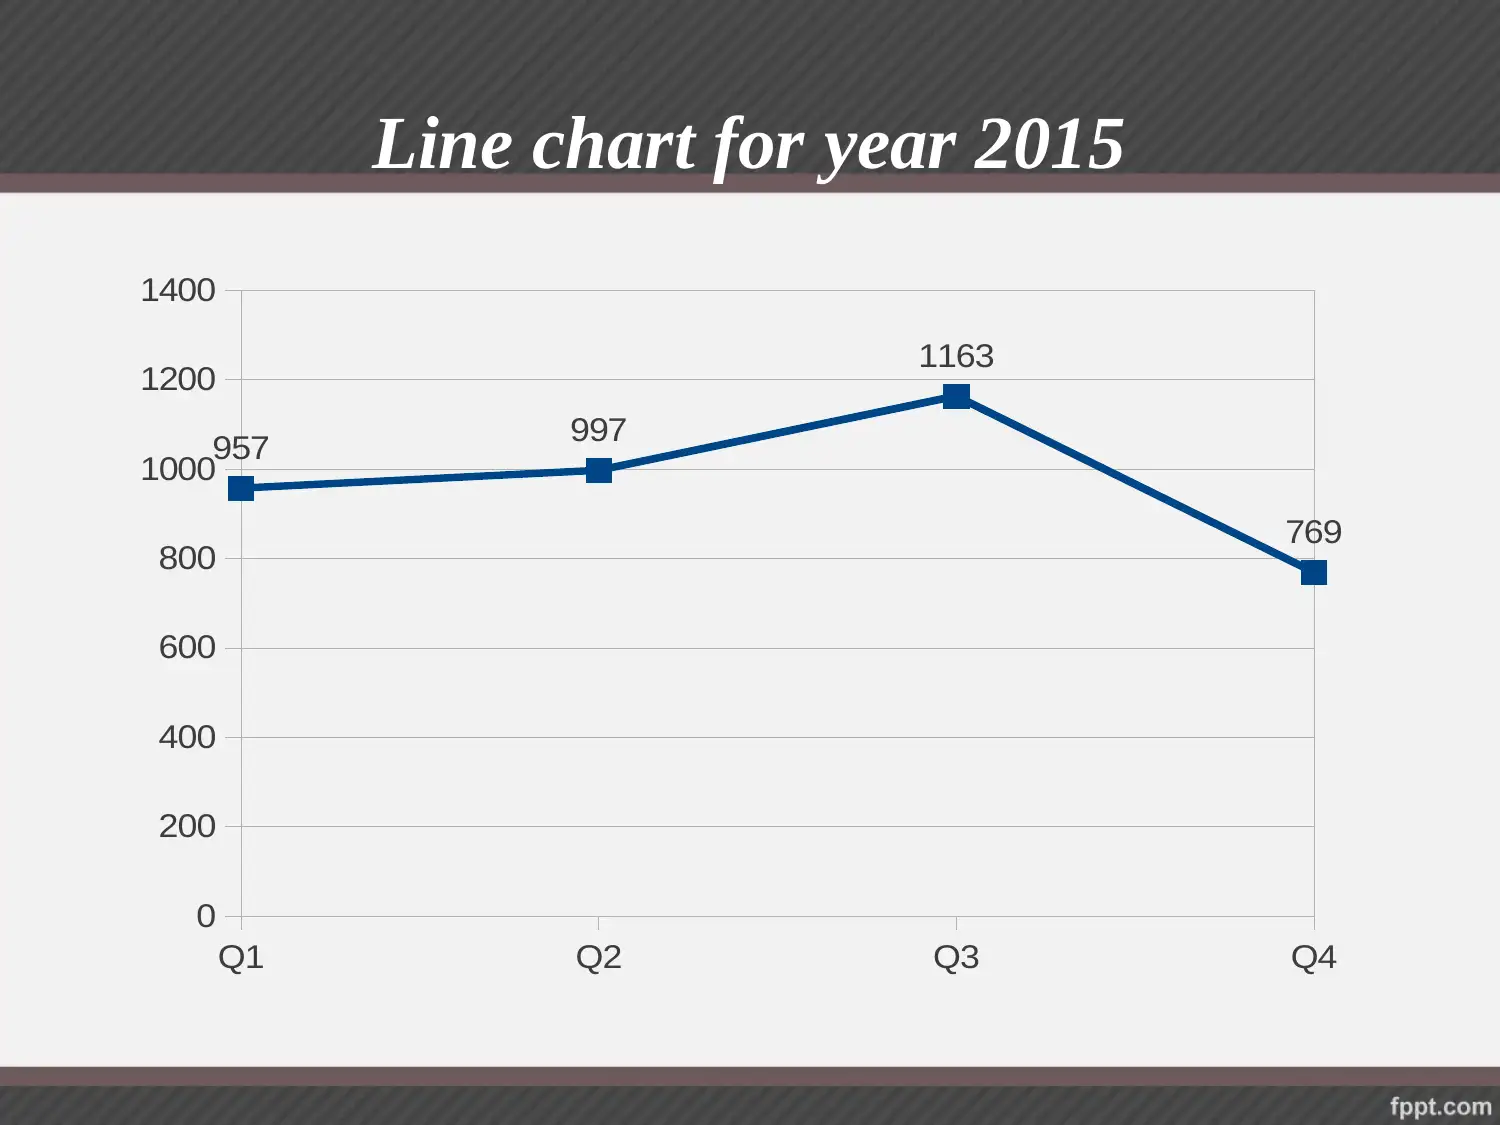
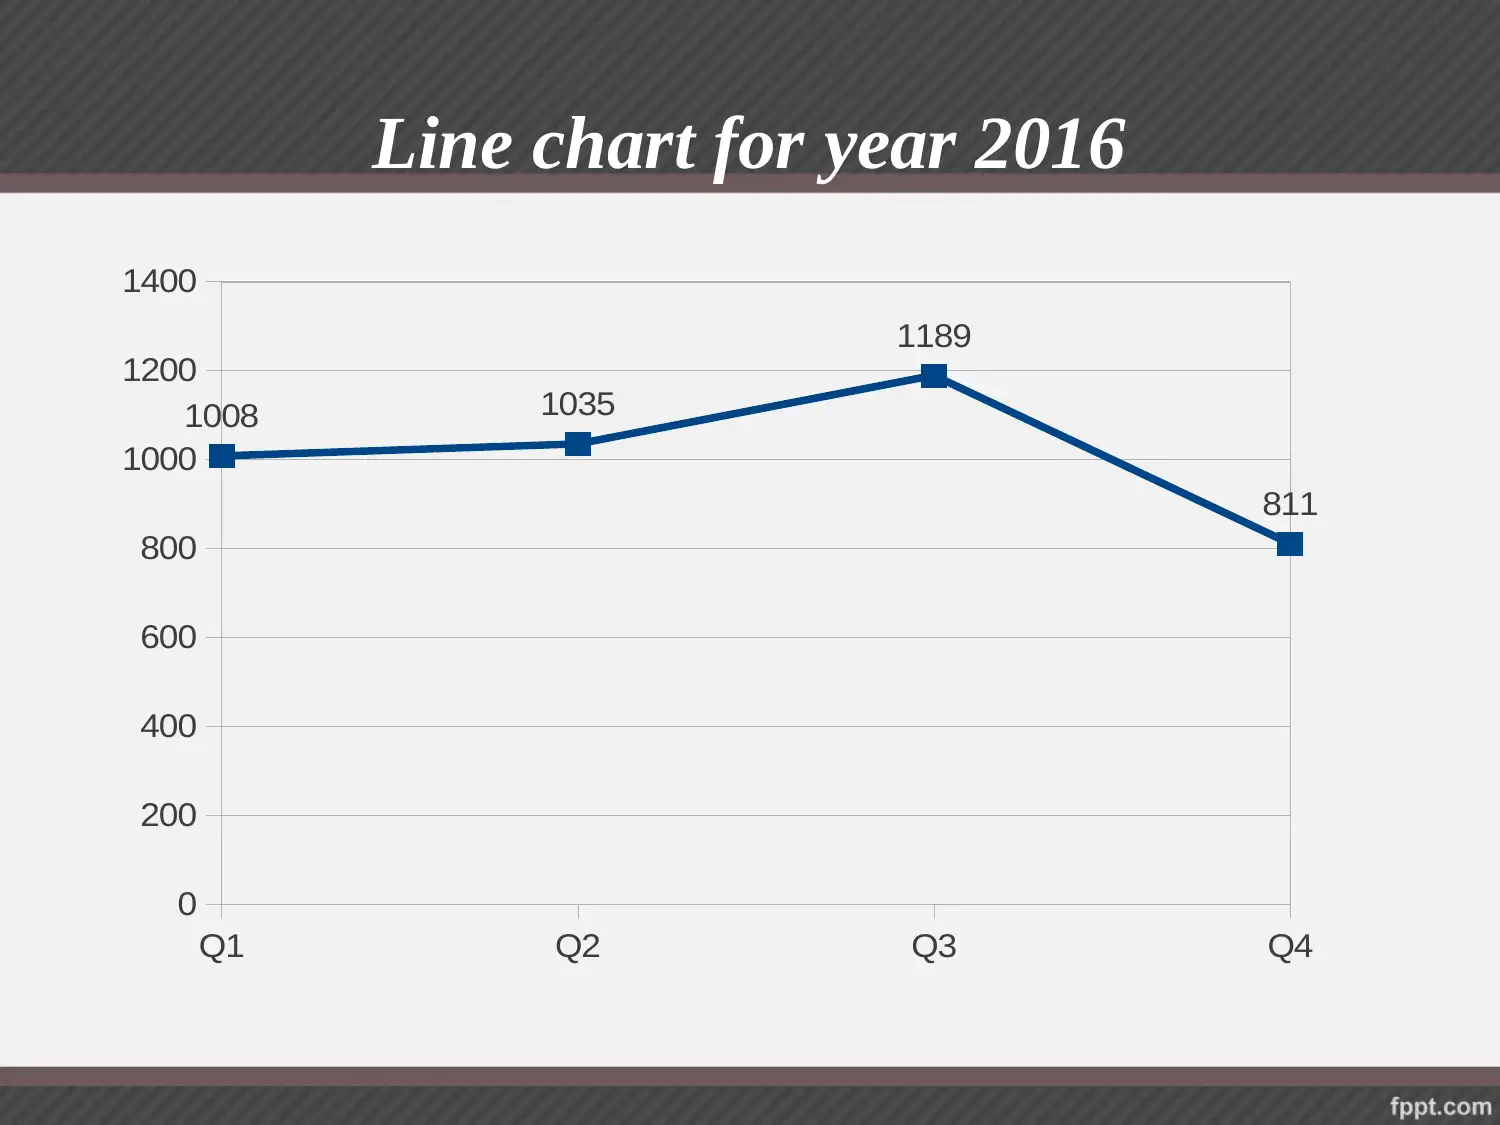
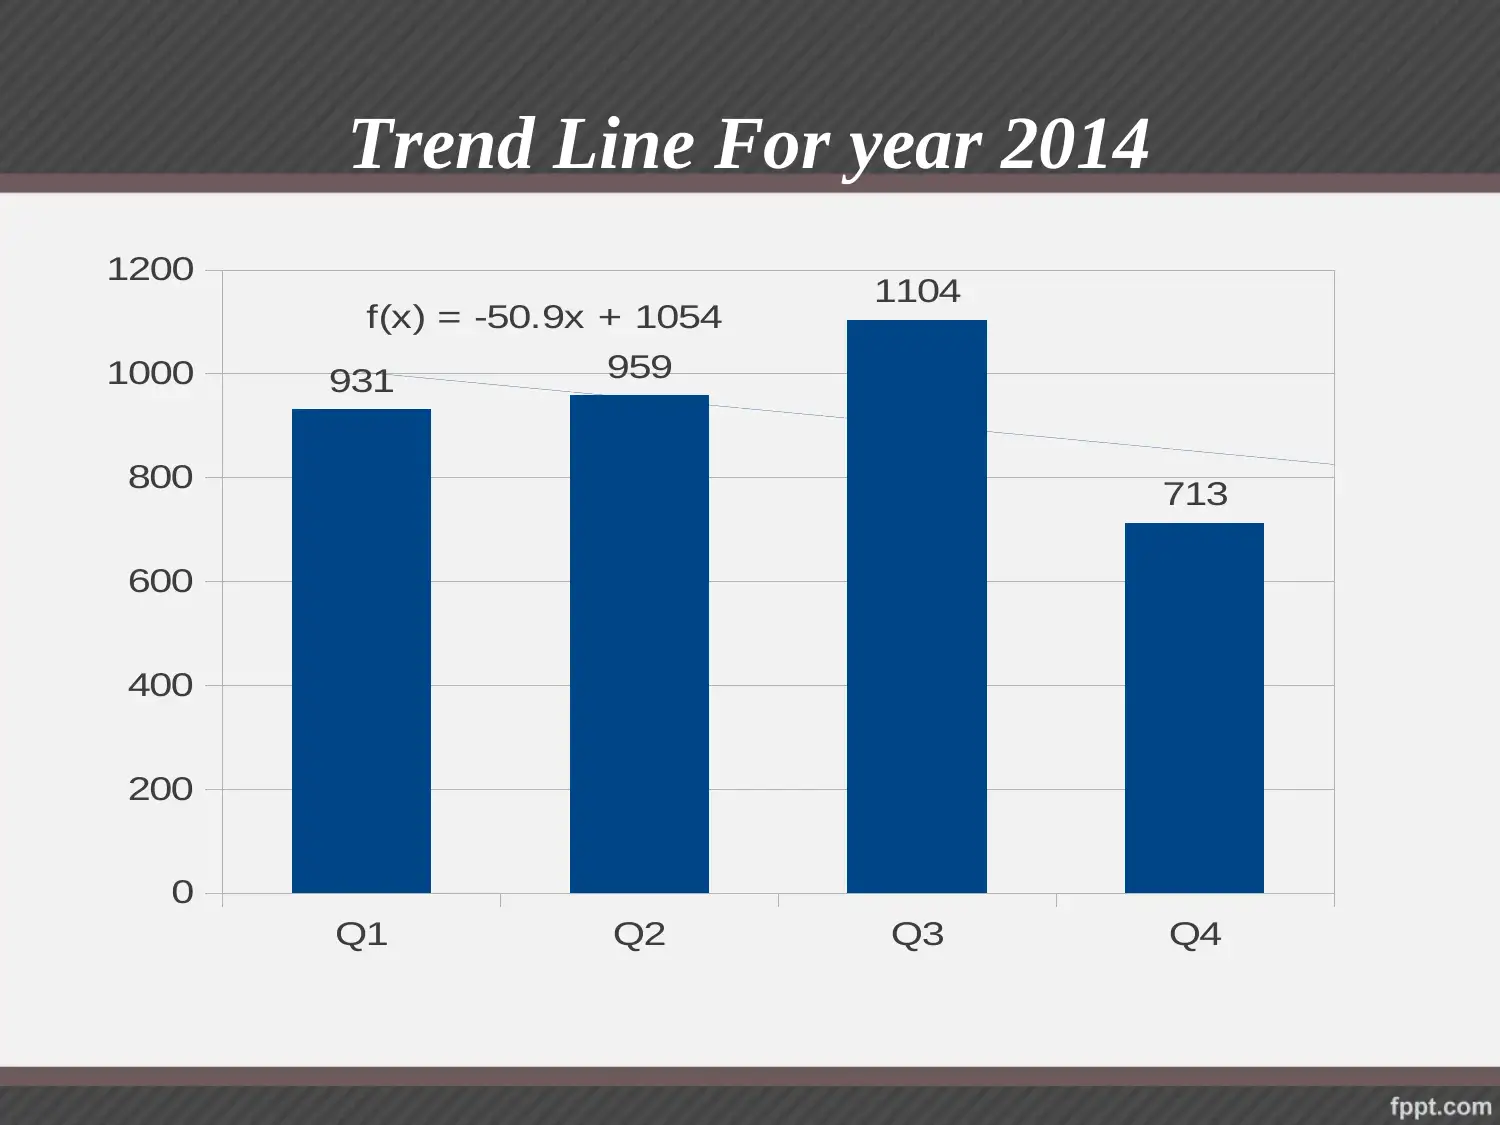
This report analyzes the revenue of a tour company from 2014 to 2016, using pie charts, bar charts, and line charts to visualize quarterly sales data. The analysis reveals that while revenue generally increased from Q1 to Q3, it declined in Q4 across all three years. Trend lines indicate a gradual decrease in overall sales and revenue, suggesting the company is struggling to attract more travelers. The rate of decline was highest in 2014, with a slightly lower rate in 2015 and 2016. Based on these trends, the report forecasts a continued reduction in sales and revenue for 2017 and 2018. The report references academic sources on statistical testing and distribution analysis to support its findings. Desklib provides students with access to this and other solved assignments for educational purposes.
Document Page
BUSINESS DECISION
MAKING
TASK 3.3
tabler-icon-diamond-filled.svg

Secure Best Marks with AI Grader

Need help grading? Try our AI Grader for instant feedback on your assignments.
Document Page
Pie Chart For Year 2014
931
959
1104
713
Q1
Q2
Q3
Q4
Document Page
Pie Chart For Year 2015
Q1
Q2
Q3
Q4
957
997
1163
769
Document Page
Pie Chart For Year 2016
Q1
Q2
Q3
Q4
1008
1035
1189
811
tabler-icon-diamond-filled.svg

Secure Best Marks with AI Grader

Need help grading? Try our AI Grader for instant feedback on your assignments.
Document Page
Bar chart for year 2014
Q1
Q2
Q3
Q4
0 200 400 600 800 1000 1200
931
959
1104
713
Document Page
Bar chart for year 2015
Q1
Q2
Q3
Q4
0 200 400 600 800 1000 1200 1400
957
997
1163
769
Document Page
Bar chart for year 2016
Q1
Q2
Q3
Q4
0 200 400 600 800 1000 1200 1400
1008
1035
1189
811
tabler-icon-diamond-filled.svg

Paraphrase This Document

Need a fresh take? Get an instant paraphrase of this document with our AI Paraphraser
Document Page
Line chart for year 2014
Q1 Q2 Q3 Q4
0
200
400
600
800
1000
1200
931 959
1104
713
Document Page
Line chart for year 2015
Q1 Q2 Q3 Q4
0
200
400
600
800
1000
1200
1400
957 997
1163
769
Document Page
Line chart for year 2016
Q1 Q2 Q3 Q4
0
200
400
600
800
1000
1200
1400
1008 1035
1189
811
tabler-icon-diamond-filled.svg

Secure Best Marks with AI Grader

Need help grading? Try our AI Grader for instant feedback on your assignments.
Document Page
INTERPRETATION
From the above presented all kinds of charts shows revenue
of the tour company which is generated in the year 2014,
2015 and 2016 from different destinations.
It can be said that total sales in the year 2014 is worth of
931, 959, 1104 and 713 as per the quarter 1, 2, 3 and 4
respectively.
On the other side in the case of 2015 and 2016 revenue
increases up to the quarter three in all the three years.
After the quarter three sales of tour company declines in the
quarter four.
Document Page
Trend Line For year 2014
Q1 Q2 Q3 Q4
0
200
400
600
800
1000
1200
931 959
1104
713
f(x) = -50.9x + 1054
Document Page
Trend Line For year 2015
Q1 Q2 Q3 Q4
0
200
400
600
800
1000
1200
1400
957 997
1163
769
f(x) = -39.8x + 1071
tabler-icon-diamond-filled.svg

Paraphrase This Document

Need a fresh take? Get an instant paraphrase of this document with our AI Paraphraser
Document Page
Trend Line For year 2016
Q1 Q2 Q3 Q4
0
200
400
600
800
1000
1200
1400
1008 1035
1189
811
f(x) = -43.7x + 1120
Document Page
INTERPRETATION
From the above represented trend line it can be interpreted
that in the sales and revenue of the tour company from
various destinations reducing every year which shows that it
is not able to attract more number of travellers.
In the year 2014 it reduces with the high rate as compare to
the FY 2015 as well as 2016.
In the next two years that is 2015 and 2016 rate of reducing
is lower in comparison to the previous year i.e. 2014.
On the basis of this it can be forecasted that in the future
year 2017 and 2018 sales and revenue of the tour company
will reduce.
Document Page
REFERENCES
Weise, T. and Chiong, R., 2015. An alternative way of presenting
statistical test results when evaluating the performance of
stochastic approaches. Neurocomputing. 147. pp. 235-238.
Arnold, B. C., 2015. Pareto distribution. John Wiley & Sons,
Ltd.
Lee, K. J. and et.al., 2014. Model-based asymptotically optimal
dispersion measure correction for pulsar timing. Monthly
Notices of the Royal Astronomical Society. 441(4). pp.2831-
2844.
tabler-icon-diamond-filled.svg

Secure Best Marks with AI Grader

Need help grading? Try our AI Grader for instant feedback on your assignments.
Document Page
THANK YOU
chevron_up_icon
1 out of 17
circle_padding
hide_on_mobile
zoom_out_icon
logo.png

Your All-in-One AI-Powered Toolkit for Academic Success.

Available 24*7 on WhatsApp / Email

[object Object]