D001 Quantitative Methods: Revenue, Assets & Employee Analysis

Verified

Added on  2023/06/15

|8
|1293
|318
Report
AI Summary
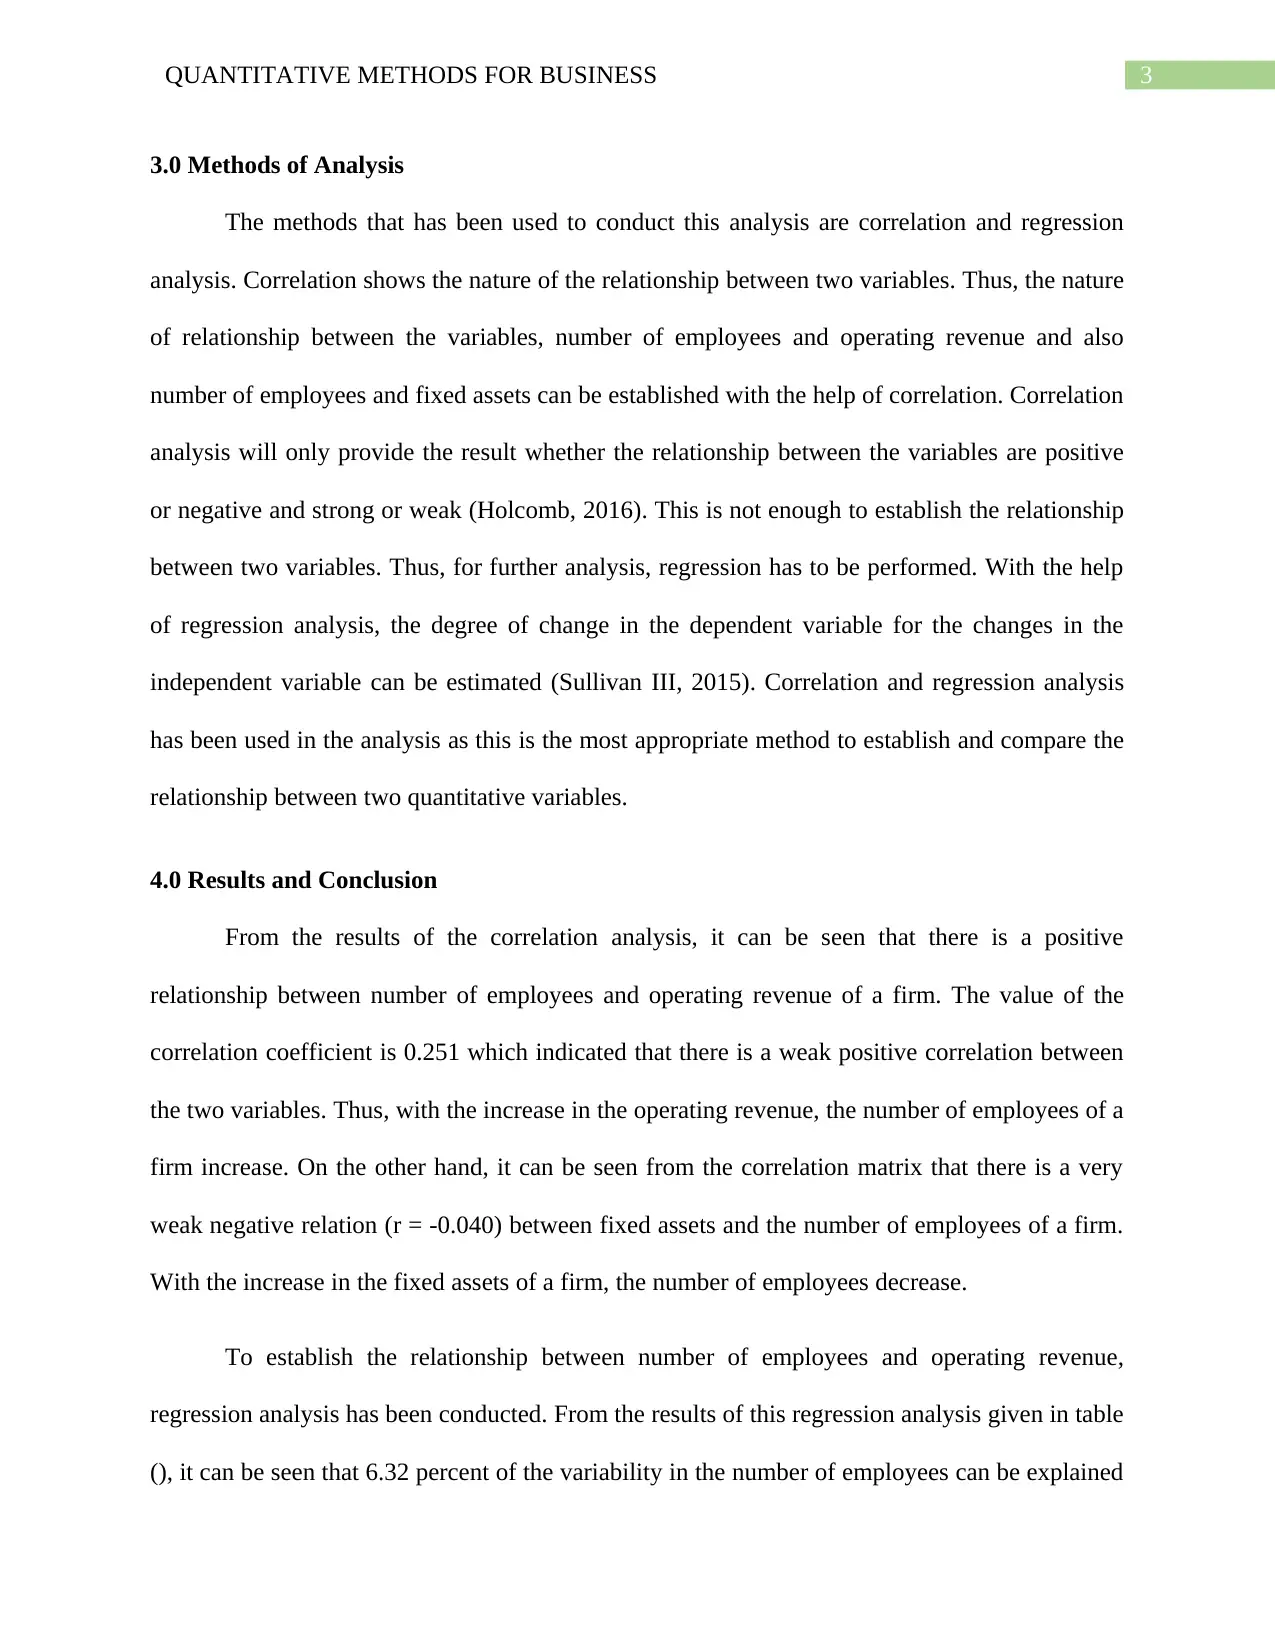
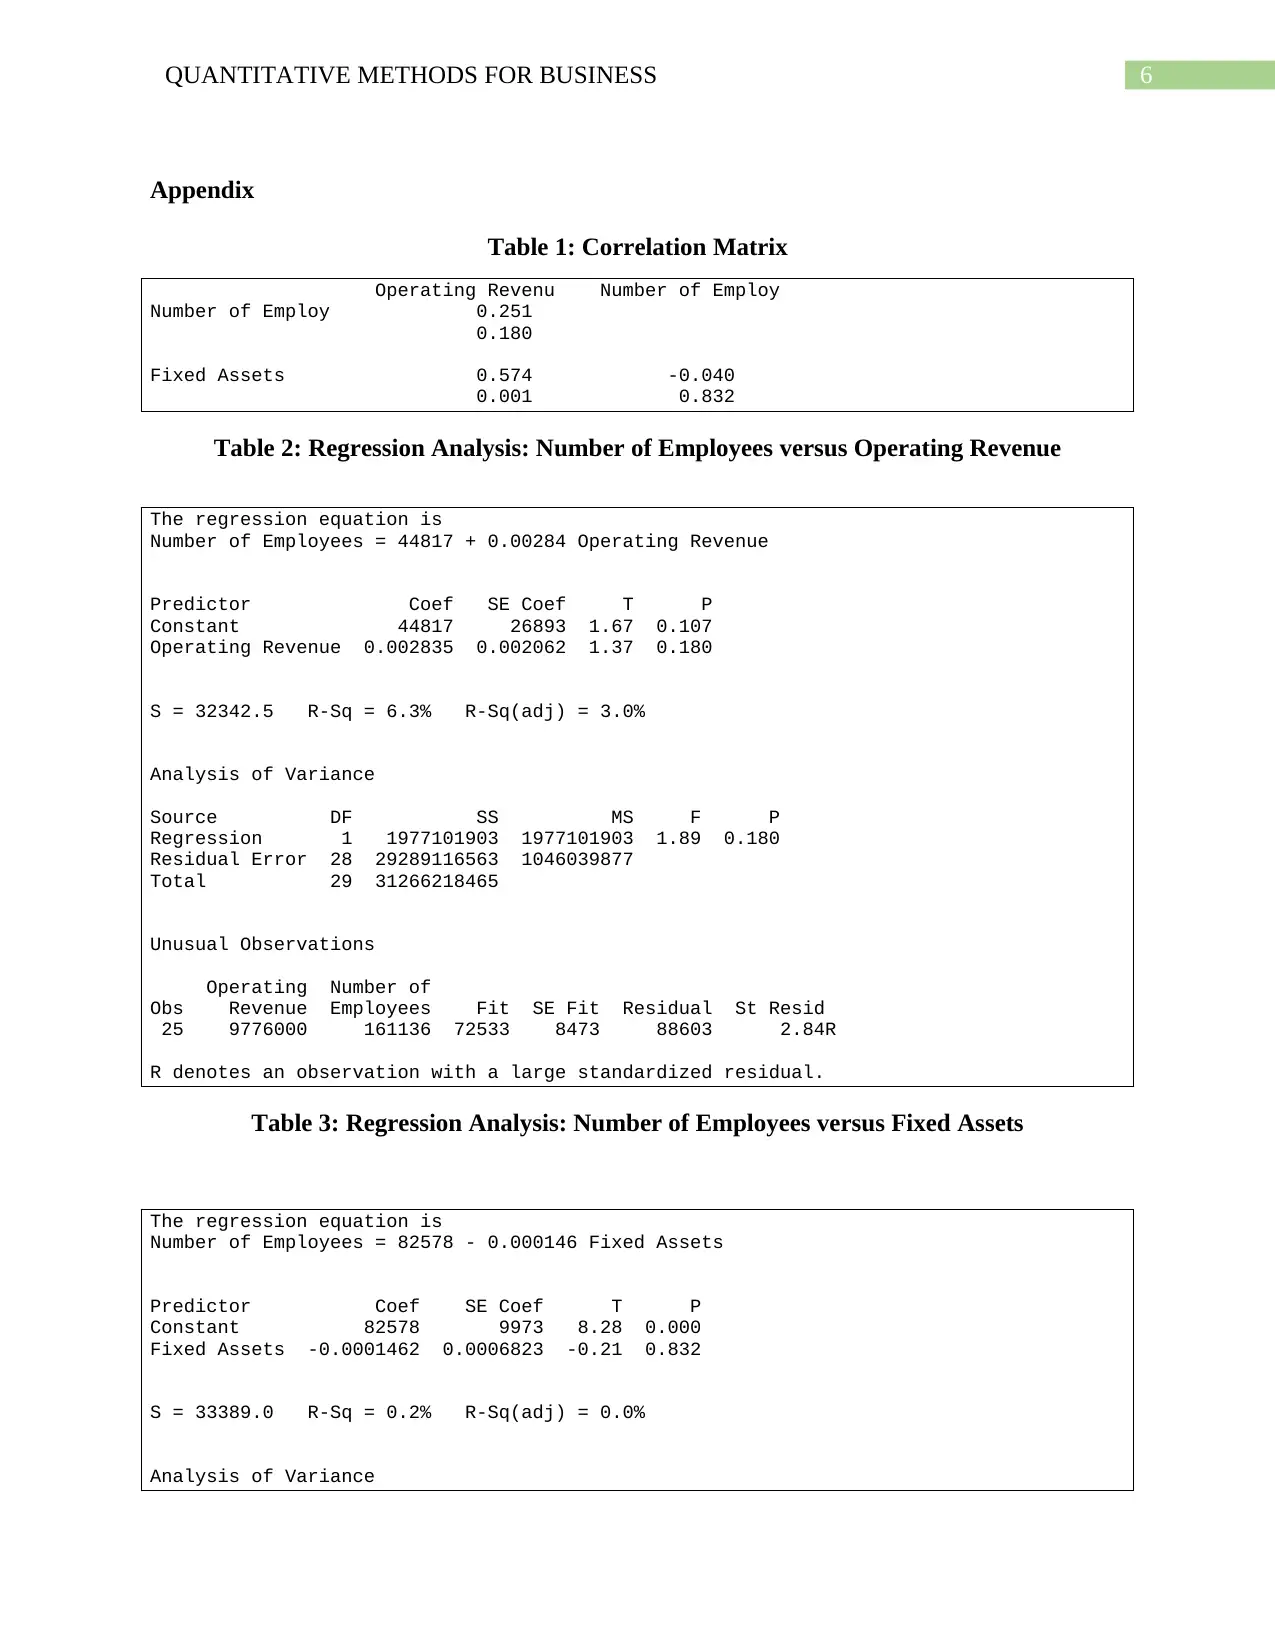
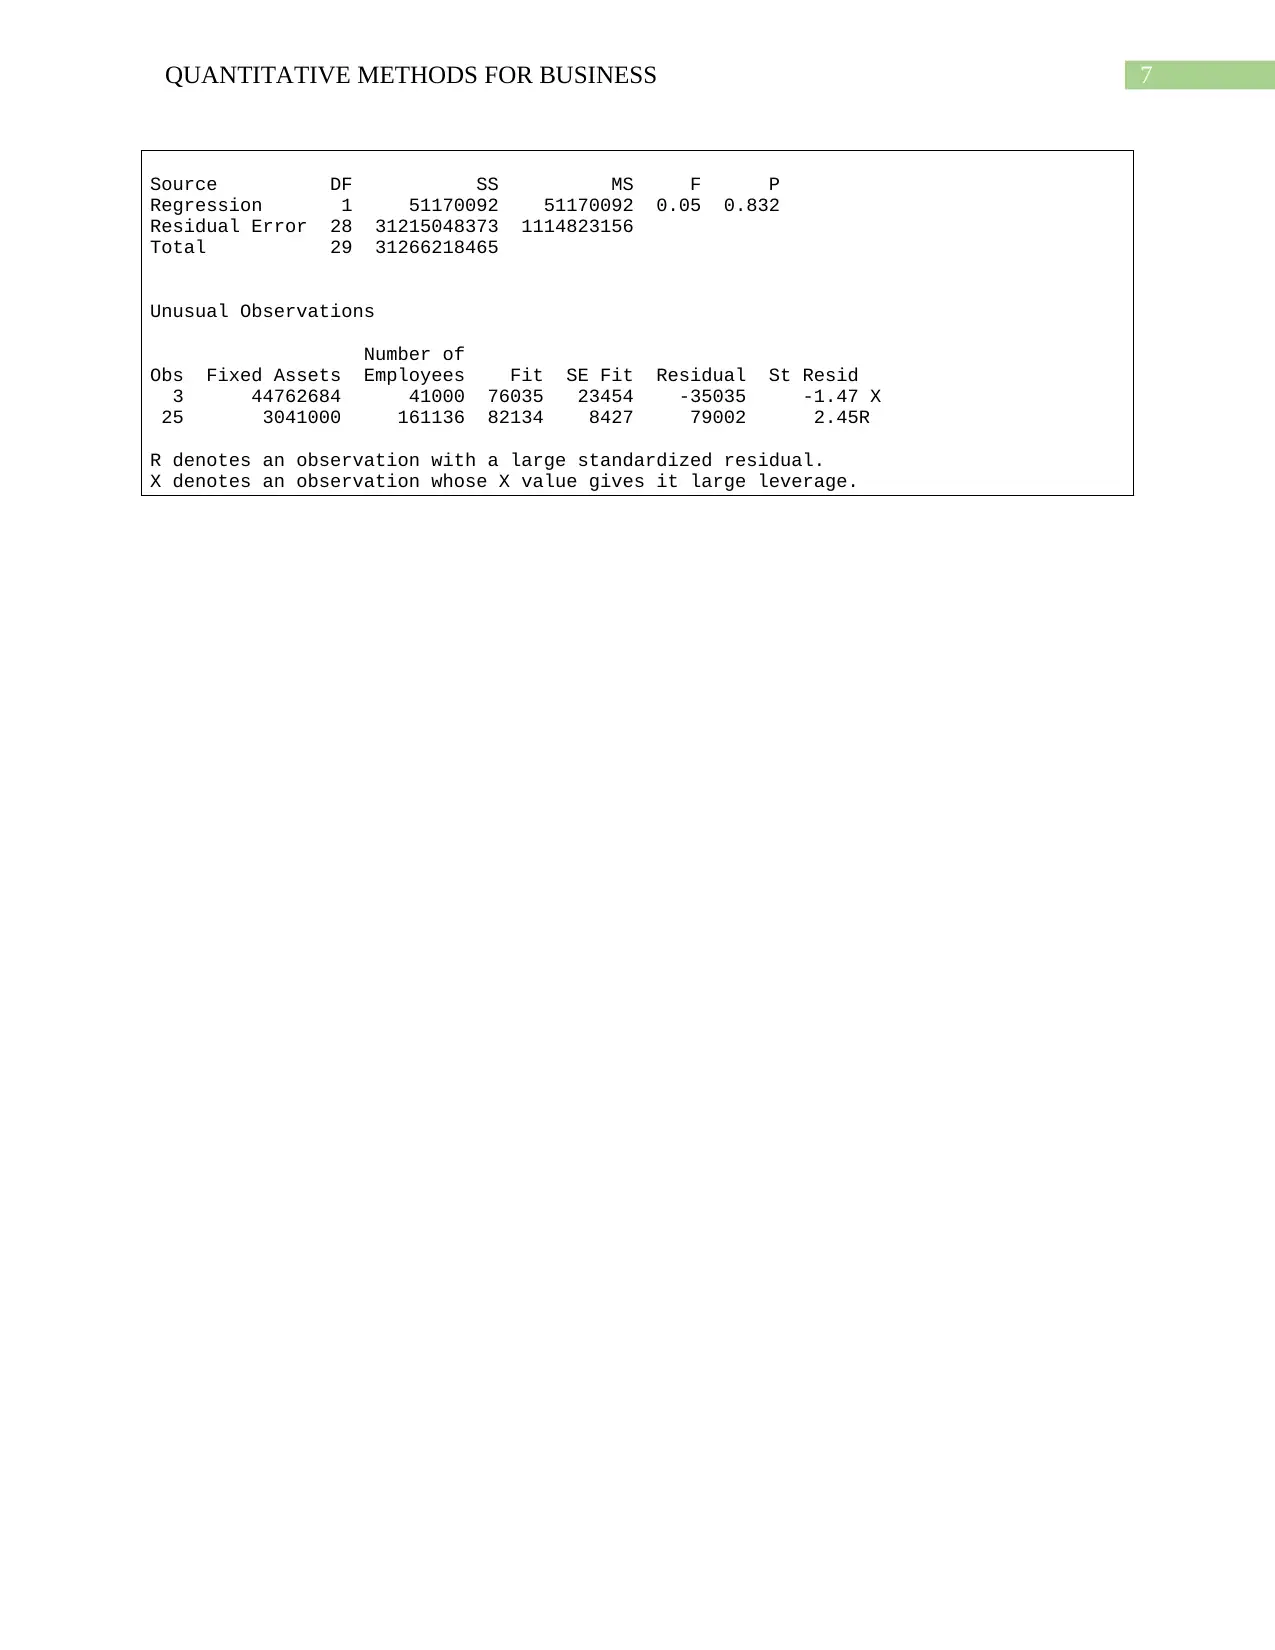
This report investigates the relationship between a company's operating revenue, fixed assets, and the number of employees, utilizing data from 30 companies listed on the UK Stock Exchange. Correlation and regression analyses were employed to determine the extent to which operating revenue and fixed assets influence employee numbers. The results indicate a weak positive correlation between operating revenue and employee numbers, suggesting that as revenue increases, the number of employees tends to increase as well. Conversely, a very weak negative correlation was found between fixed assets and employee numbers. Regression analysis further revealed that operating revenue explains a small percentage of the variability in employee numbers, while the impact of fixed assets is negligible. The report concludes that operating revenue has a more substantial, though still limited, impact on the number of employees compared to fixed assets.
Document Page
Running Head: QUANTITATIVE METHODS FOR BUSINESS
Quantitative Methods for Business
Name of the Student
Name of the University
Author Note
tabler-icon-diamond-filled.svg

Secure Best Marks with AI Grader

Need help grading? Try our AI Grader for instant feedback on your assignments.
Document Page
1QUANTITATIVE METHODS FOR BUSINESS
Table of Contents
1.0 Introduction................................................................................................................................2
2.0 Procedure...................................................................................................................................2
3.0 Methods of Analysis..................................................................................................................3
4.0 Results and Conclusion..............................................................................................................3
References........................................................................................................................................5
Appendix..........................................................................................................................................6
Document Page
2QUANTITATIVE METHODS FOR BUSINESS
1.0 Introduction
The purpose of this research is to assess whether operating revenue or Fixed assets of a
business firm affects the number of employees in a business. Operating revenue is referred to as
the revenue earned by a company by selling its products and services (Haslem & Longbrake,
2015). Fixed assets of a business on the other hand is a form of tangible assets that the firm owns
and operates in order to support its operation (Xhaferri & Demi, 2015).
Of the two factors, operating revenue and fixed assets, operating revenue is supposed to
affect the number of employees of a company. The employee retention power depends on the
operating revenue earned by the company as the employee salaries come from the operating
revenue. If the company earns less revenue, then the company will not be able to pay the
employees properly and hence they will not be able to retain its employees (Subramaniam &
Watson, 2016). As a result, the number of employees for that company decreases. Thus, there
should be a positive relationship between the number of employees and the operating revenue of
a company.
2.0 Procedure
30 companies have been selected from the list of top 100 companies listed in the U.K.
Stock Exchange. The data on the number of employees, operating revenue and the fixed assets of
each of selected companies have been obtained from the Fame database.
The companies were selected from the top 100 companies because this will helpful in
understanding how the top companies work. Which of the two factor are more responsible for
their employee retention that leads to this success of the companies.
Document Page
3QUANTITATIVE METHODS FOR BUSINESS
3.0 Methods of Analysis
The methods that has been used to conduct this analysis are correlation and regression
analysis. Correlation shows the nature of the relationship between two variables. Thus, the nature
of relationship between the variables, number of employees and operating revenue and also
number of employees and fixed assets can be established with the help of correlation. Correlation
analysis will only provide the result whether the relationship between the variables are positive
or negative and strong or weak (Holcomb, 2016). This is not enough to establish the relationship
between two variables. Thus, for further analysis, regression has to be performed. With the help
of regression analysis, the degree of change in the dependent variable for the changes in the
independent variable can be estimated (Sullivan III, 2015). Correlation and regression analysis
has been used in the analysis as this is the most appropriate method to establish and compare the
relationship between two quantitative variables.
4.0 Results and Conclusion
From the results of the correlation analysis, it can be seen that there is a positive
relationship between number of employees and operating revenue of a firm. The value of the
correlation coefficient is 0.251 which indicated that there is a weak positive correlation between
the two variables. Thus, with the increase in the operating revenue, the number of employees of a
firm increase. On the other hand, it can be seen from the correlation matrix that there is a very
weak negative relation (r = -0.040) between fixed assets and the number of employees of a firm.
With the increase in the fixed assets of a firm, the number of employees decrease.
To establish the relationship between number of employees and operating revenue,
regression analysis has been conducted. From the results of this regression analysis given in table
(), it can be seen that 6.32 percent of the variability in the number of employees can be explained
tabler-icon-diamond-filled.svg

Secure Best Marks with AI Grader

Need help grading? Try our AI Grader for instant feedback on your assignments.
Document Page
4QUANTITATIVE METHODS FOR BUSINESS
by operating revenue earned by the company. With one unit increase in the operating revenue,
the number of employees increases by 0.003 times. The relationship can be estimated by the
following regression equation:
Number of Employees = 44817 + 0.00284 Operating Revenue
To establish the relationship between number of employees and fixed assets of a firm,
regression analysis has been conducted. From the results of this regression analysis given in table
(), it can be seen that 0.16 percent of the variability in the number of employees can be explained
by fixed assets of the company. With one unit increase in the fixed assets, the number of
employees decreases by 0.0001 times which is almost negligible. Thus, it can be said clearly that
there is not much impact of fixed assets on the number of employees in a company. The
relationship can be estimated by the following regression equation:
Number of Employees = 82578 - 0.000146 Fixed Assets
Document Page
5QUANTITATIVE METHODS FOR BUSINESS
References
Haslem, J. A., & Longbrake, W. (2015). A discriminant analysis of commercial bank
profitability.
Holcomb, Z. C. (2016). Fundamentals of descriptive statistics. Routledge.
Subramaniam, C., & Watson, M. W. (2016). Additional evidence on the sticky behavior of costs.
In Advances in Management Accounting (pp. 275-305). Emerald Group Publishing
Limited.
Sullivan III, M. (2015). Fundamentals of statistics. Pearson.
Xhaferri, S., & Demi, A. (2015). Reassessment of Fixed Assets. Mediterranean Journal of
Social Sciences, 6(5), 107.
Document Page
6QUANTITATIVE METHODS FOR BUSINESS
Appendix
Table 1: Correlation Matrix
Operating Revenu Number of Employ
Number of Employ 0.251
0.180
Fixed Assets 0.574 -0.040
0.001 0.832
Table 2: Regression Analysis: Number of Employees versus Operating Revenue
The regression equation is
Number of Employees = 44817 + 0.00284 Operating Revenue
Predictor Coef SE Coef T P
Constant 44817 26893 1.67 0.107
Operating Revenue 0.002835 0.002062 1.37 0.180
S = 32342.5 R-Sq = 6.3% R-Sq(adj) = 3.0%
Analysis of Variance
Source DF SS MS F P
Regression 1 1977101903 1977101903 1.89 0.180
Residual Error 28 29289116563 1046039877
Total 29 31266218465
Unusual Observations
Operating Number of
Obs Revenue Employees Fit SE Fit Residual St Resid
25 9776000 161136 72533 8473 88603 2.84R
R denotes an observation with a large standardized residual.
Table 3: Regression Analysis: Number of Employees versus Fixed Assets
The regression equation is
Number of Employees = 82578 - 0.000146 Fixed Assets
Predictor Coef SE Coef T P
Constant 82578 9973 8.28 0.000
Fixed Assets -0.0001462 0.0006823 -0.21 0.832
S = 33389.0 R-Sq = 0.2% R-Sq(adj) = 0.0%
Analysis of Variance
tabler-icon-diamond-filled.svg

Paraphrase This Document

Need a fresh take? Get an instant paraphrase of this document with our AI Paraphraser
Document Page
7QUANTITATIVE METHODS FOR BUSINESS
Source DF SS MS F P
Regression 1 51170092 51170092 0.05 0.832
Residual Error 28 31215048373 1114823156
Total 29 31266218465
Unusual Observations
Number of
Obs Fixed Assets Employees Fit SE Fit Residual St Resid
3 44762684 41000 76035 23454 -35035 -1.47 X
25 3041000 161136 82134 8427 79002 2.45R
R denotes an observation with a large standardized residual.
X denotes an observation whose X value gives it large leverage.
chevron_up_icon
1 out of 8
circle_padding
hide_on_mobile
zoom_out_icon
logo.png

Your All-in-One AI-Powered Toolkit for Academic Success.

Available 24*7 on WhatsApp / Email

[object Object]