Rewards and Compensation: Company Performance & Financial Analysis

Verified

Added on  2023/01/19

|7
|1029
|45
Report
AI Summary
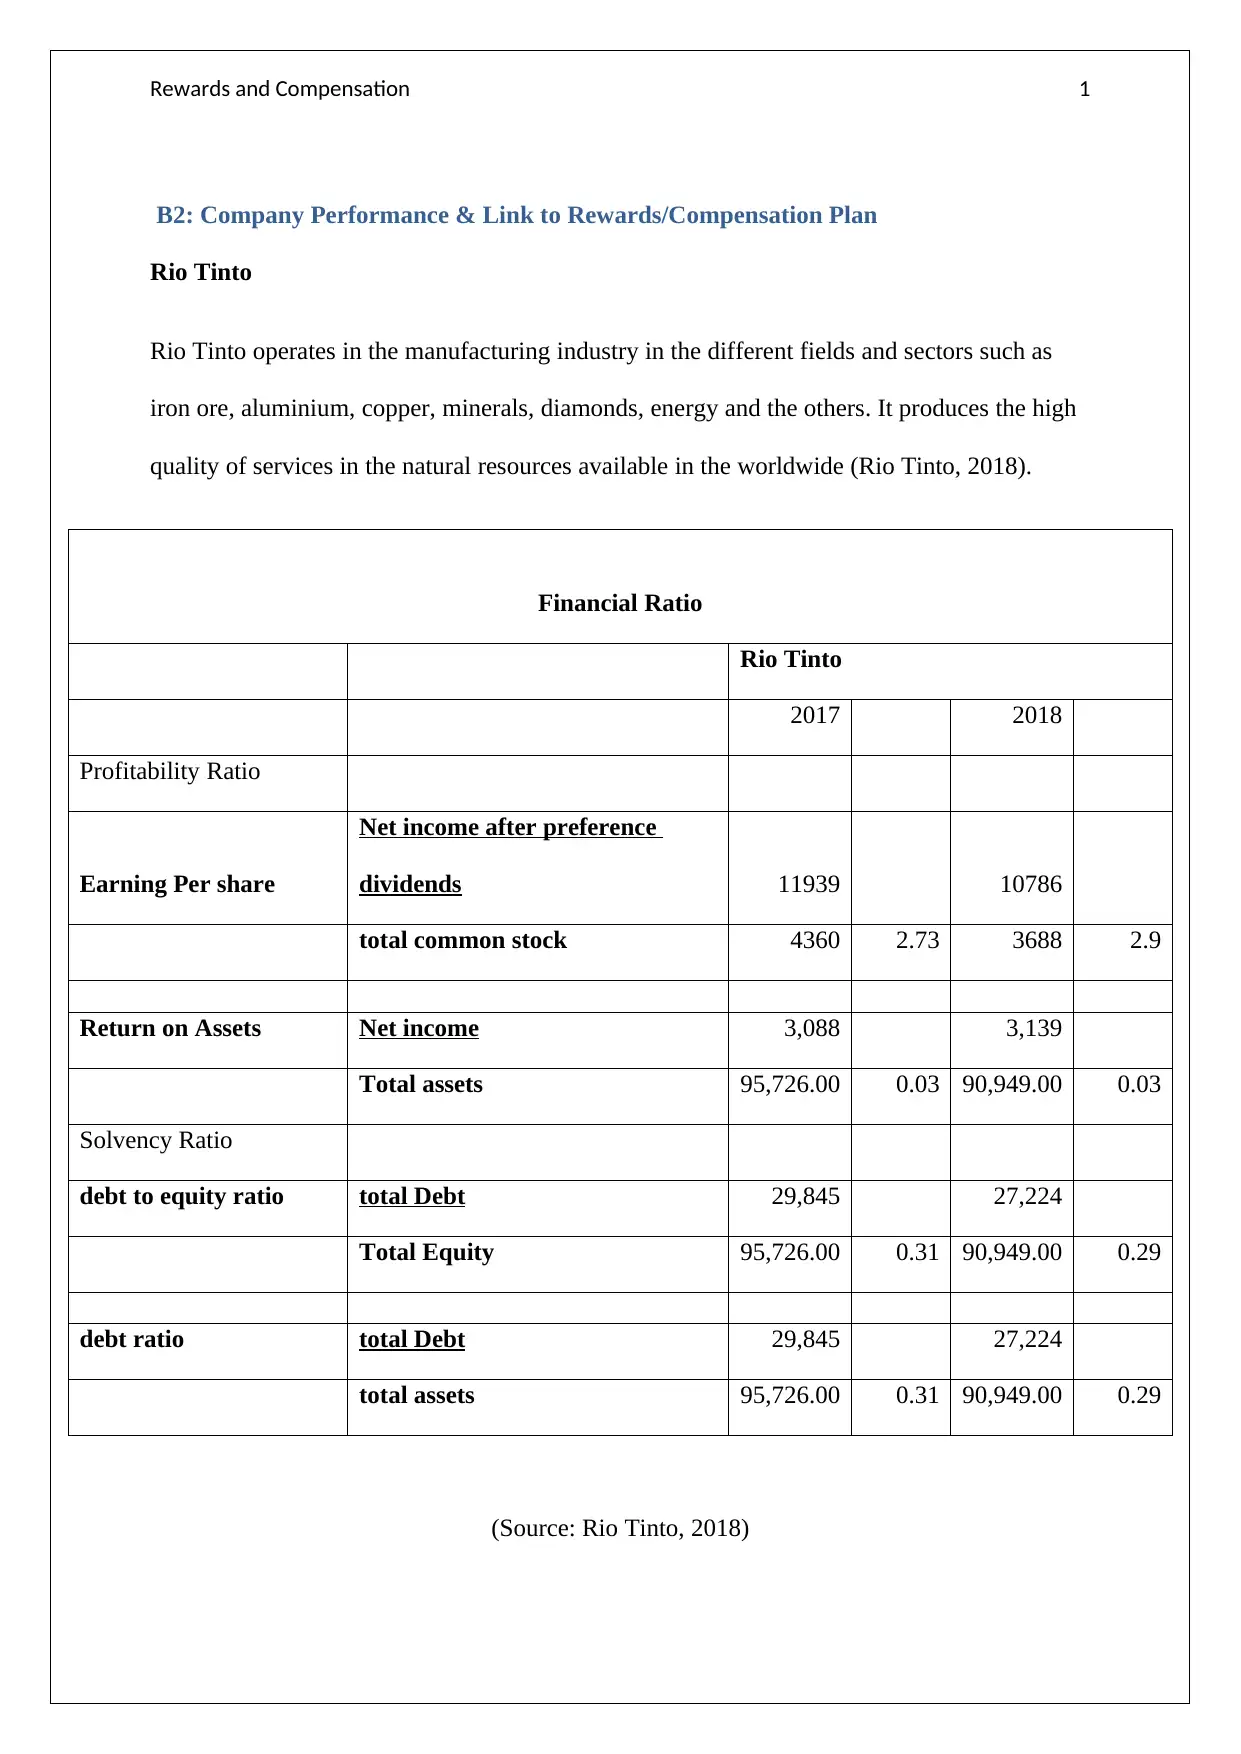
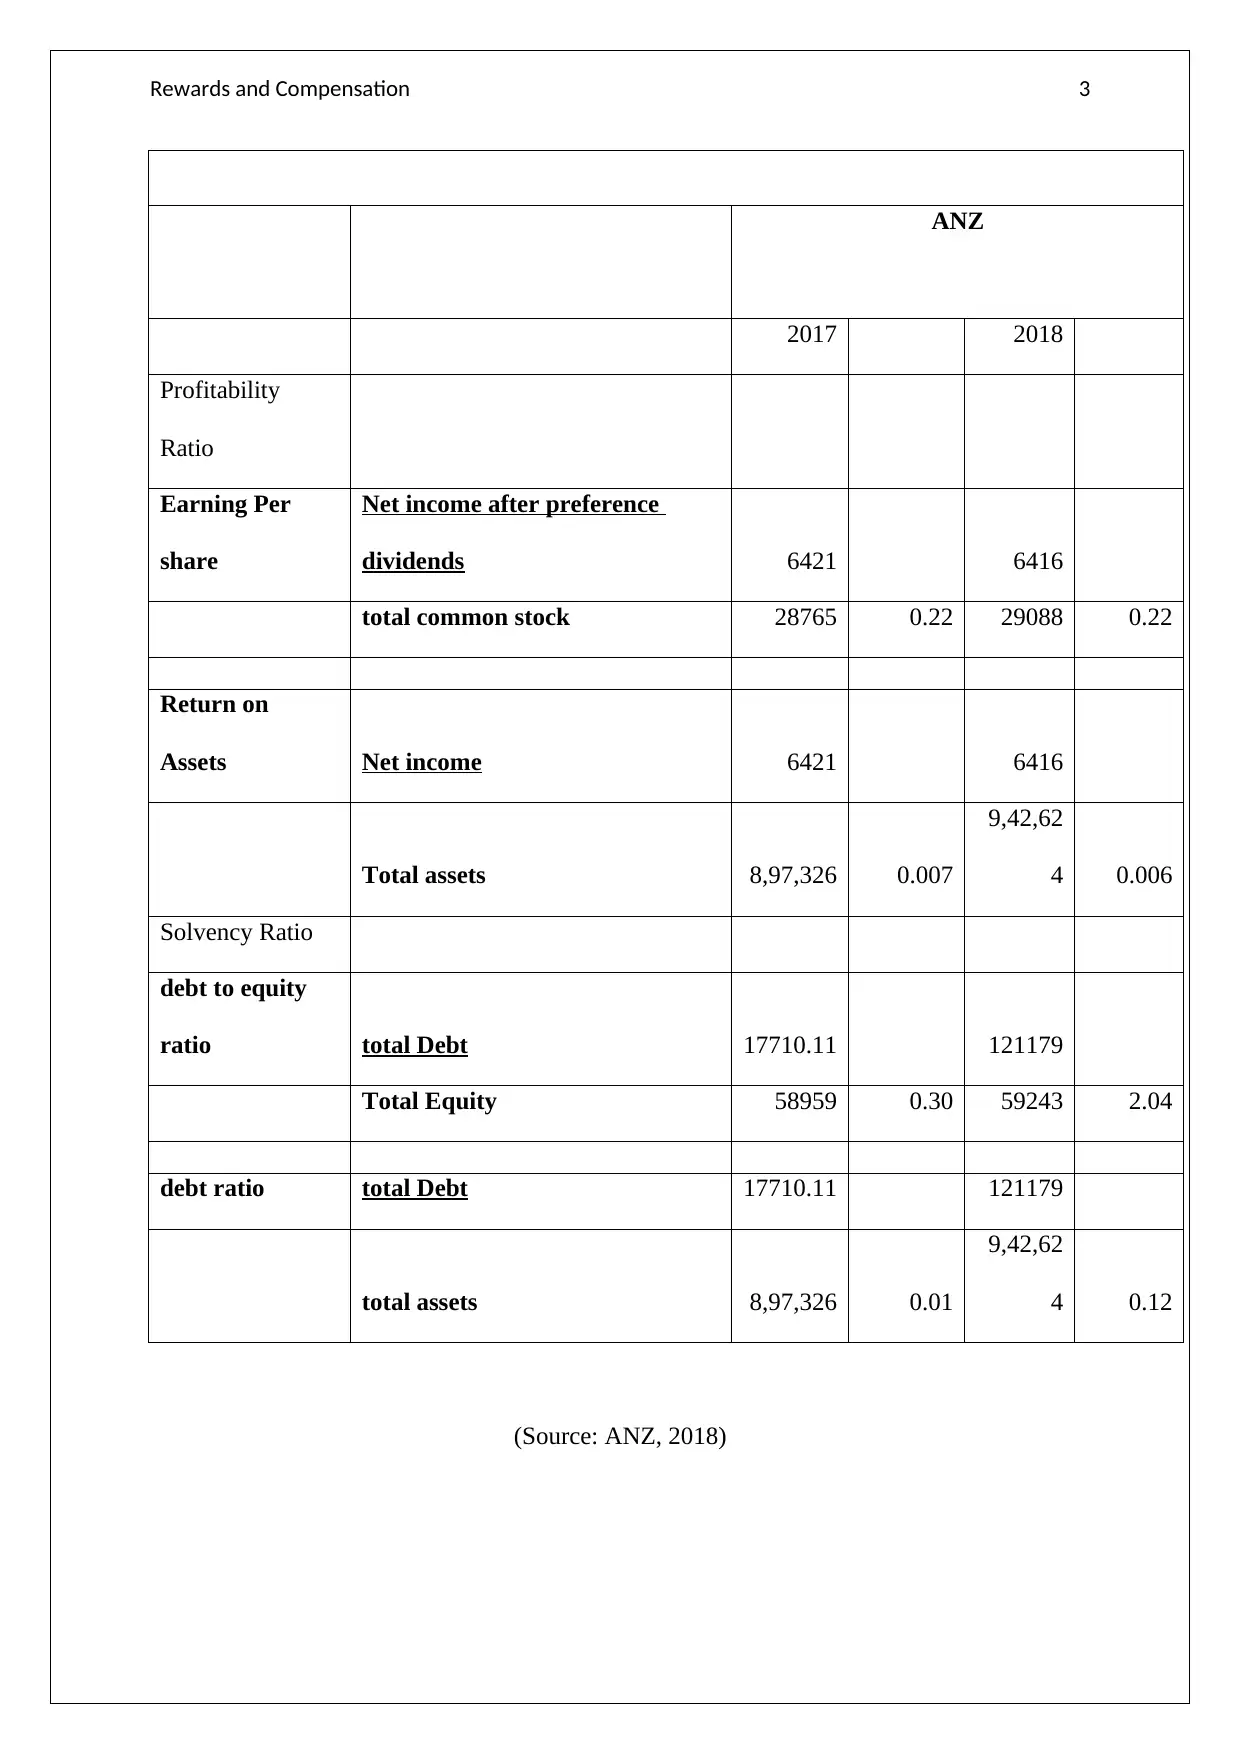
This report analyzes the rewards and compensation strategies of Rio Tinto and ANZ, focusing on their company performance and financial ratios. It examines the short-term and long-term incentive plans of Rio Tinto, evaluating their profitability and solvency ratios, and compares them with ANZ's compensation structure. The report delves into the profitability and solvency ratios of both companies, highlighting Rio Tinto's successful application of its reward plan and strong financial condition, while contrasting this with ANZ's struggles due to increasing liabilities and a declining profitability ratio. The analysis concludes by emphasizing the importance of effective reward systems in achieving competitive advantages, and how these systems are linked to strategic performance measurement systems (SPMS) and motivational theories, as described in the assignment brief. The report also includes a review of the literature on multi-perspective SPMS, discussing their features, benefits, pitfalls, and challenges based on academic research.
tabler-icon-diamond-filled.svg

Contribute Materials

Your contribution can guide someone’s learning journey. Share your documents today.
Document Page
Rewards and Compensation
tabler-icon-diamond-filled.svg

Secure Best Marks with AI Grader

Need help grading? Try our AI Grader for instant feedback on your assignments.
Document Page
Rewards and Compensation 1
B2: Company Performance & Link to Rewards/Compensation Plan
Rio Tinto
Rio Tinto operates in the manufacturing industry in the different fields and sectors such as
iron ore, aluminium, copper, minerals, diamonds, energy and the others. It produces the high
quality of services in the natural resources available in the worldwide (Rio Tinto, 2018).
Financial Ratio
Rio Tinto
2017 2018
Profitability Ratio
Earning Per share
Net income after preference
dividends 11939 10786
total common stock 4360 2.73 3688 2.9
Return on Assets Net income 3,088 3,139
Total assets 95,726.00 0.03 90,949.00 0.03
Solvency Ratio
debt to equity ratio total Debt 29,845 27,224
Total Equity 95,726.00 0.31 90,949.00 0.29
debt ratio total Debt 29,845 27,224
total assets 95,726.00 0.31 90,949.00 0.29
(Source: Rio Tinto, 2018)
Document Page
Rewards and Compensation 2
Reward and compensation system
It provides rewards to employees in order to motivate, and retain them (Dibb, and Simkin,
2016). The rewards are based on the performance targets that are directed at delivering a
good performance. The reward is evaluated on the basis of long term and short term period.
Short term incentive plan of the company is measured in a year which is based on the
balanced scorecard and it includes safety, financial and individual targets. Long term
incentive plan is measured in five years and these rewards are delivered in the terms of
shares.
Profitability and solvency
It is observed that the solvency ratio of the company decreases in the year 2018. The
solvency ratio of the company is 0.31 in 2017 but it also decreases in the year 2018 and now
it is 0.29. The lower solvency ratio indicates the greater profitability ratio of the company and
that is beneficial in terms of high revenue. The profitability ratio of the company is increasing
in 2018 with a ratio of 2.9. It indicates that the company performing well in generating high
revenue, profits and cash flow (Rio Tinto, 2018).
ANZ Company
ANZ Company is the third largest bank in Australia Market. It provides financial services to
the public. It operated two brands in New Zealand and these are ANZ and National bank of
New Zealand.
Financial Ratio
Document Page
Rewards and Compensation 3
ANZ
2017 2018
Profitability
Ratio
Earning Per
share
Net income after preference
dividends 6421 6416
total common stock 28765 0.22 29088 0.22
Return on
Assets Net income 6421 6416
Total assets 8,97,326 0.007
9,42,62
4 0.006
Solvency Ratio
debt to equity
ratio total Debt 17710.11 121179
Total Equity 58959 0.30 59243 2.04
debt ratio total Debt 17710.11 121179
total assets 8,97,326 0.01
9,42,62
4 0.12
(Source: ANZ, 2018)
tabler-icon-diamond-filled.svg

Secure Best Marks with AI Grader

Need help grading? Try our AI Grader for instant feedback on your assignments.
Document Page
Rewards and Compensation 4
Reward and compensation
There are two core components of remunerations at ANZ-fixed remuneration and at a
variable remuneration. The disclosed executive gets rewards under the VR framework. In this
framework, it gets 200% of remuneration on achieving the target and gets a maximum
opportunity on completing the 150% of target.
Profitability and solvency
It has been evaluated that the profitability ratio of the company is constantly in the last two
years. In 2017 and 2018, the earning per share ratio of the company is constant and the ratio
of return on asset increases with the small rate. In the year 2018, the solvency ratio of the
company is increases by 2.04 as compared to the year 2017. The 20% of the solvency ratio is
good for the company but the above ratio indicates that the company is not capable of long
term obligations (Ready Ratios, 2018).
Comparison
Document Page
Rewards and Compensation 5
It has been evaluated that both companies are stable in financial terms. As per the
comparison, it has been evaluated that the Rio Tinto is performing as per their rewards and
compensation plan. The company is also financially sound as per its profitability and
solvency ratio. Over the last two years, the company has the strong financial condition due to
which it provides the high rate of dividend so that a large number of people invest in it and
the chances of gaining the advantage are high. ANZ is failed in its rewards and compensation
plan due to increasing the liability and lowering the profitability ratio. The company does not
have the capacity to gain a competitive advantage as its strategies are not effectively (ANZ,
2018).
Conclusion
From the above analysis, it has been concluded that both the company develops a different
reward plan in order to measure the performance. It has been evaluated that Rio Tinto is
successfully applied to the rewards plan in its business. It also has the capability to gain a
competitive advantage. ANZ does not financially strong due to which it fails to gain a
competitive advantage.
Document Page
Rewards and Compensation 6
References
ANZ. (2018) Our 2018 Reporting Suite. [online] Available from:
https://shareholder.anz.com/sites/default/files/anz_2018_annual_report_final.pdf [Accessed
15/4/19].
ANZ. (2018) Strategy and Performance. [online] Available from:
https://shareholder.anz.com/reviews/2013/2013-review/strategy-performance/ [Accessed
15/4/19].
Cross, J.C., Belich, T.J. and Rudelius, W., 2015. How marketing managers use market
segmentation: An exploratory study. In Proceedings of the 1990 Academy of Marketing
Science (AMS) Annual Conference (pp. 531-536). Springer, Cham.
Dibb, S. and Simkin, L. (2016) Market segmentation and segment strategy. Marketing
theory: A student text, pp.251-279.
Ready Ratios. (2018) Solvency Ratio. [online] Available from:
https://www.readyratios.com/reference/analysis/solvency_ratio.html [Accessed 15/4/19].
Rio Tinto. (2018) 2018 Annual Report. [online] Available from:
http://www.riotinto.com/documents/RT_2018_annual_report.pdf [Accessed 15/4/19].
chevron_up_icon
1 out of 7
circle_padding
hide_on_mobile
zoom_out_icon
logo.png

Your All-in-One AI-Powered Toolkit for Academic Success.

Available 24*7 on WhatsApp / Email

[object Object]