Financial Performance Analysis of Rio Tinto PLC (2014-2018)
VerifiedAdded on 2023/06/04
|24
|4010
|180
Report
AI Summary
This report presents a comprehensive financial analysis of Rio Tinto PLC, a major global metals and mining corporation, evaluating its performance from 2014 to 2018. The analysis employs various financial techniques, including Total Shareholder Return (TSR) and Economic Value Added (EVA) analysis, to assess the company's ability to generate returns on shareholder equity and add value to investments. Valuation methods such as Net Asset Value (NAV) and ratio comparisons (P/E, P/B, EV/EBITDA) are utilized to determine the company's valuation. Furthermore, the report incorporates a discounted cash flow (DCF) analysis with a terminal value to assess the company's liquidity. The findings aim to provide insights for investors, guiding their decisions based on the financial health and performance of Rio Tinto PLC.

Financial Analysis-Rio Tinto PLC
Paraphrase This Document
Need a fresh take? Get an instant paraphrase of this document with our AI Paraphraser
Executive Summary:
The assignment contains the different methods that can be used for assessing the efficiency of
the business in generating returns on the equity invested by the share holders in a business
organization. Assessing the capacity of a business in adding value to the investment of the share
holders is an important aspect of corporate finance as such assessments help the potential
investors to choose a company that posses the possible potential of generating good return over
share holders investment, In the current assignment the methods of “Total Shareholder Return”
and EVA analysis has been used for assessing the capability of the chosen organization Rio
Tinto Plc[Anglo-Australian multinational and one of the world's largest metals and mining
corporations and listed in most of the major stock exchanges of the world including LSE, NYSE]
to add value to the investment of the share holders. The methods of Net asset valuation and the
valuation ratios are being used for assessing the valuation of the chosen organization. The
discounted cash flow method with a terminal value has been used for assessing the liqui9dy
aspect of the business. All the above analysis has been done so that a guide line can be offered to
the investors regarding their investment decisions with respect to the chosen organization.
Table of Contents
Total Shareholder Return (TSR)-(2014-2018)................................................................................4
EVA analysis-5 years......................................................................................................................6
Valuation of Companies:.................................................................................................................8
Net Asset Value, NAV................................................................................................................8
Ratio comparison P/E, P/B, EV/EBITDA...................................................................................9
Discounted free cash flow consideration along with terminal value: 5years............................13
Conclusion & Recommendation:...................................................................................................15
References......................................................................................................................................16
Appendix-1:...................................................................................................................................17
Appendix-2:...................................................................................................................................19
Appendix-3....................................................................................................................................20
Appendix-4....................................................................................................................................21
⊘ This is a preview!⊘
Do you want full access?
Subscribe today to unlock all pages.
Trusted by 1+ million students worldwide
Total Shareholder Return (TSR)-(2014-2018)
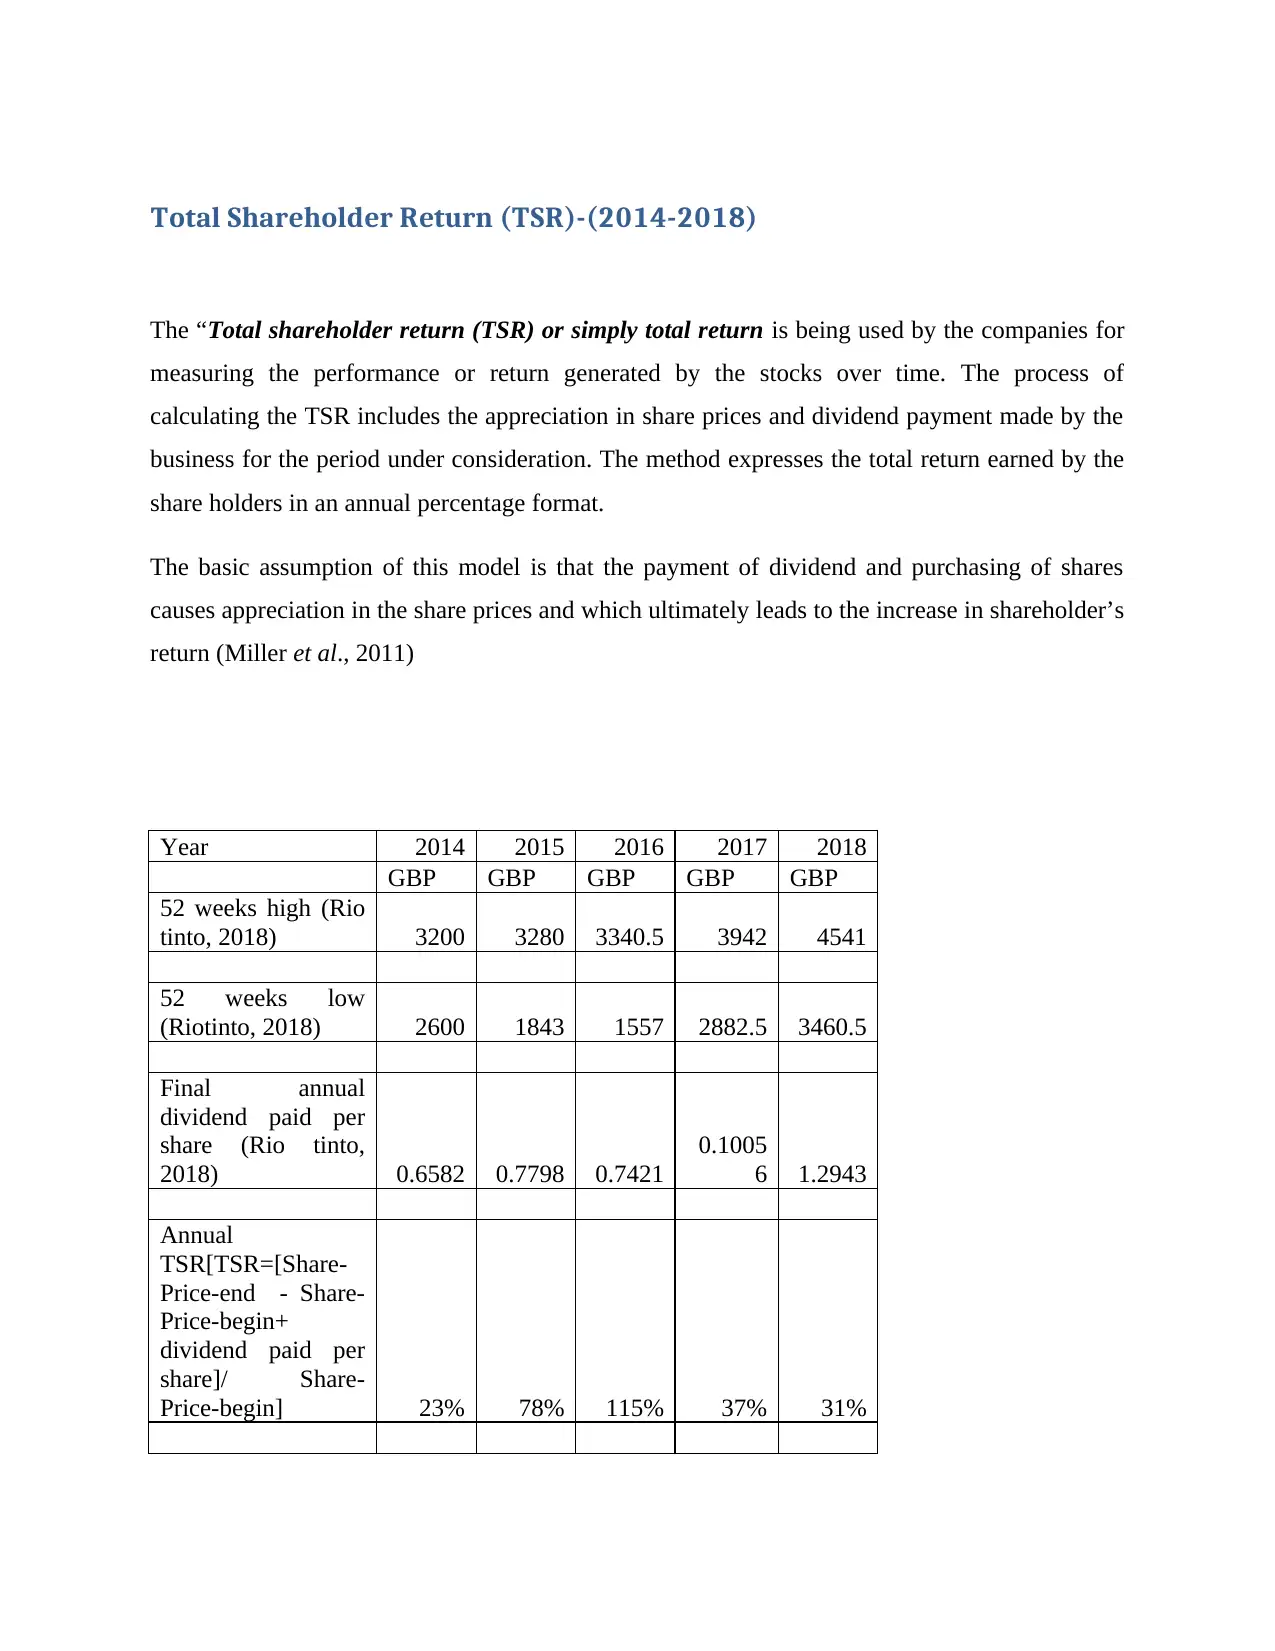
The “Total shareholder return (TSR) or simply total return is being used by the companies for
measuring the performance or return generated by the stocks over time. The process of
calculating the TSR includes the appreciation in share prices and dividend payment made by the
business for the period under consideration. The method expresses the total return earned by the
share holders in an annual percentage format.
The basic assumption of this model is that the payment of dividend and purchasing of shares
causes appreciation in the share prices and which ultimately leads to the increase in shareholder’s
return (Miller et al., 2011)
Year 2014 2015 2016 2017 2018
GBP GBP GBP GBP GBP
52 weeks high (Rio
tinto, 2018) 3200 3280 3340.5 3942 4541
52 weeks low
(Riotinto, 2018) 2600 1843 1557 2882.5 3460.5
Final annual
dividend paid per
share (Rio tinto,
2018) 0.6582 0.7798 0.7421
0.1005
6 1.2943
Annual
TSR[TSR=[Share-
Price-end - Share-
Price-begin+
dividend paid per
share]/ Share-
Price-begin] 23% 78% 115% 37% 31%
Paraphrase This Document
Need a fresh take? Get an instant paraphrase of this document with our AI Paraphraser
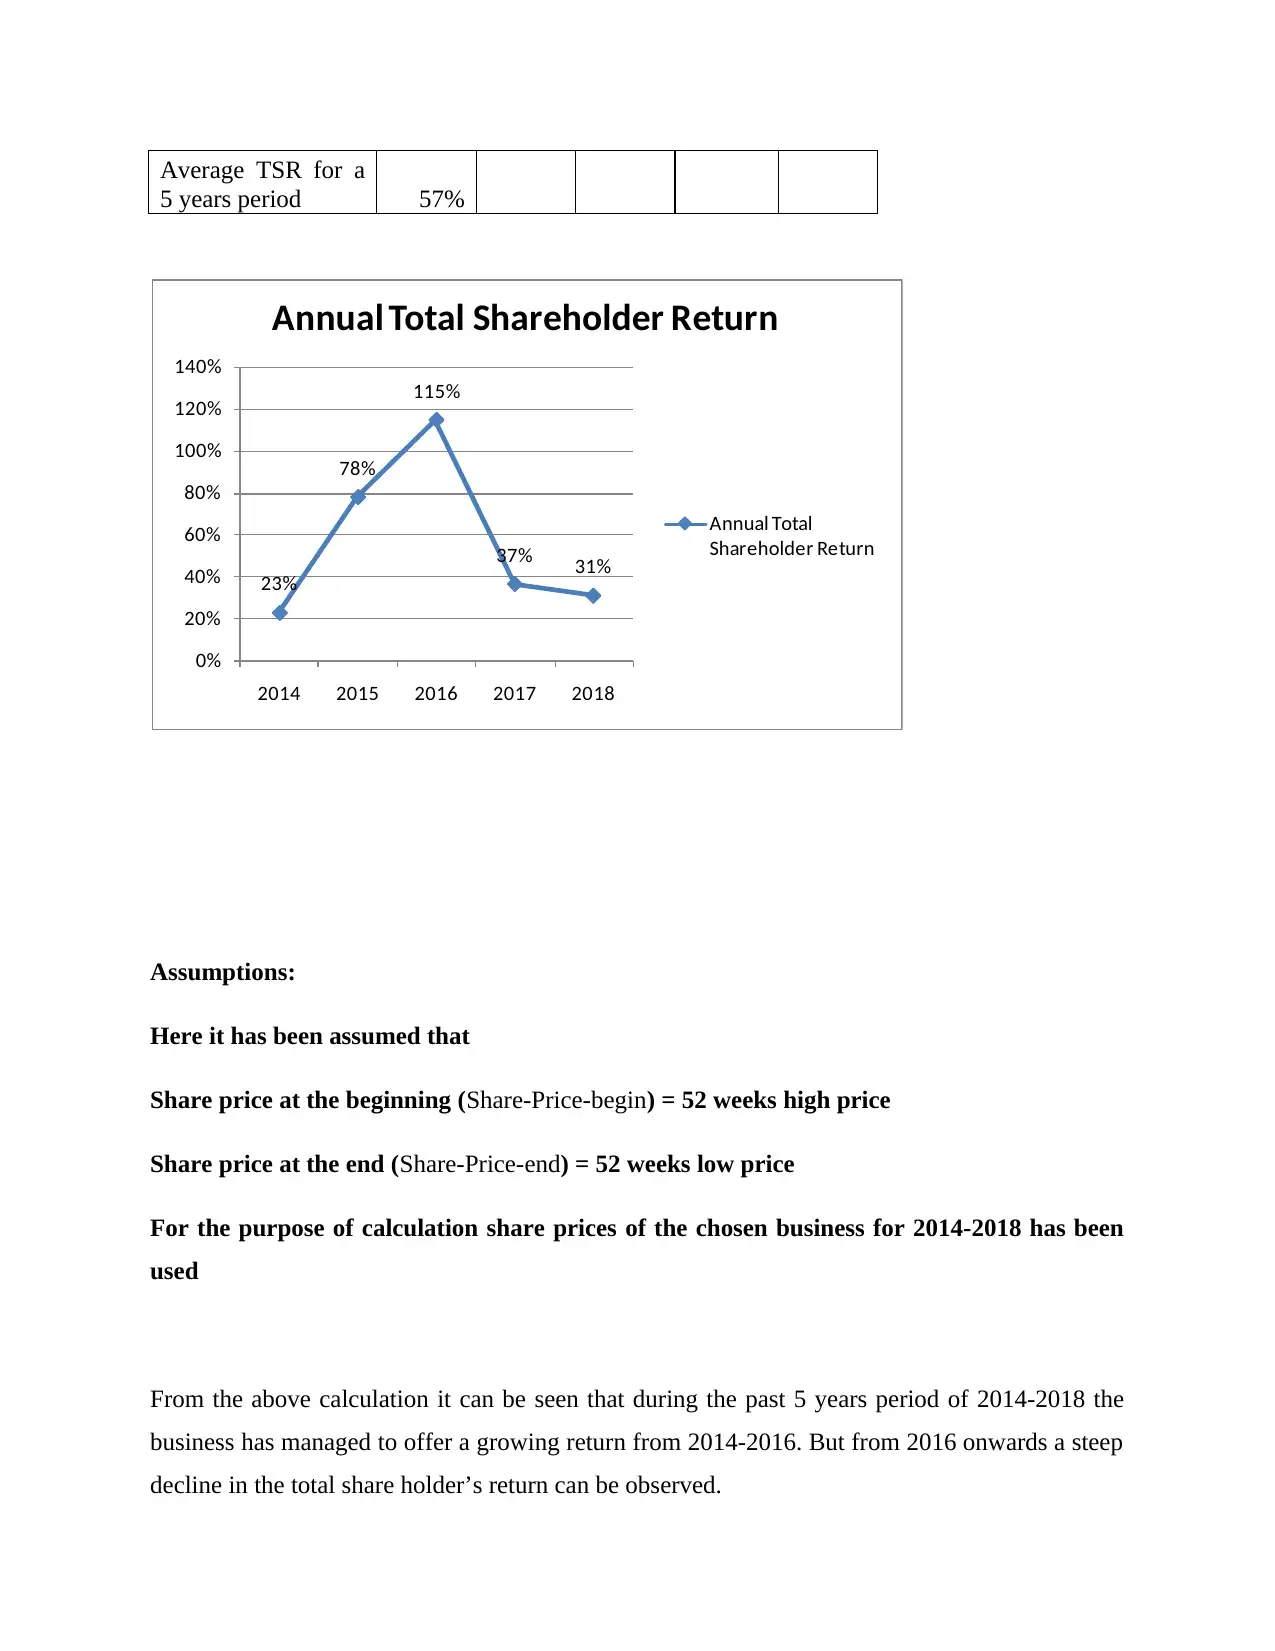
Average TSR for a
5 years period 57%
23%
78%
115%
37% 31%
0%
20%
40%
60%
80%
100%
120%
140%
2014 2015 2016 2017 2018
Annual Total Shareholder Return
Annual Total
Shareholder Return
Assumptions:
Here it has been assumed that
Share price at the beginning (Share-Price-begin) = 52 weeks high price
Share price at the end (Share-Price-end) = 52 weeks low price
For the purpose of calculation share prices of the chosen business for 2014-2018 has been
used
From the above calculation it can be seen that during the past 5 years period of 2014-2018 the
business has managed to offer a growing return from 2014-2016. But from 2016 onwards a steep
decline in the total share holder’s return can be observed.
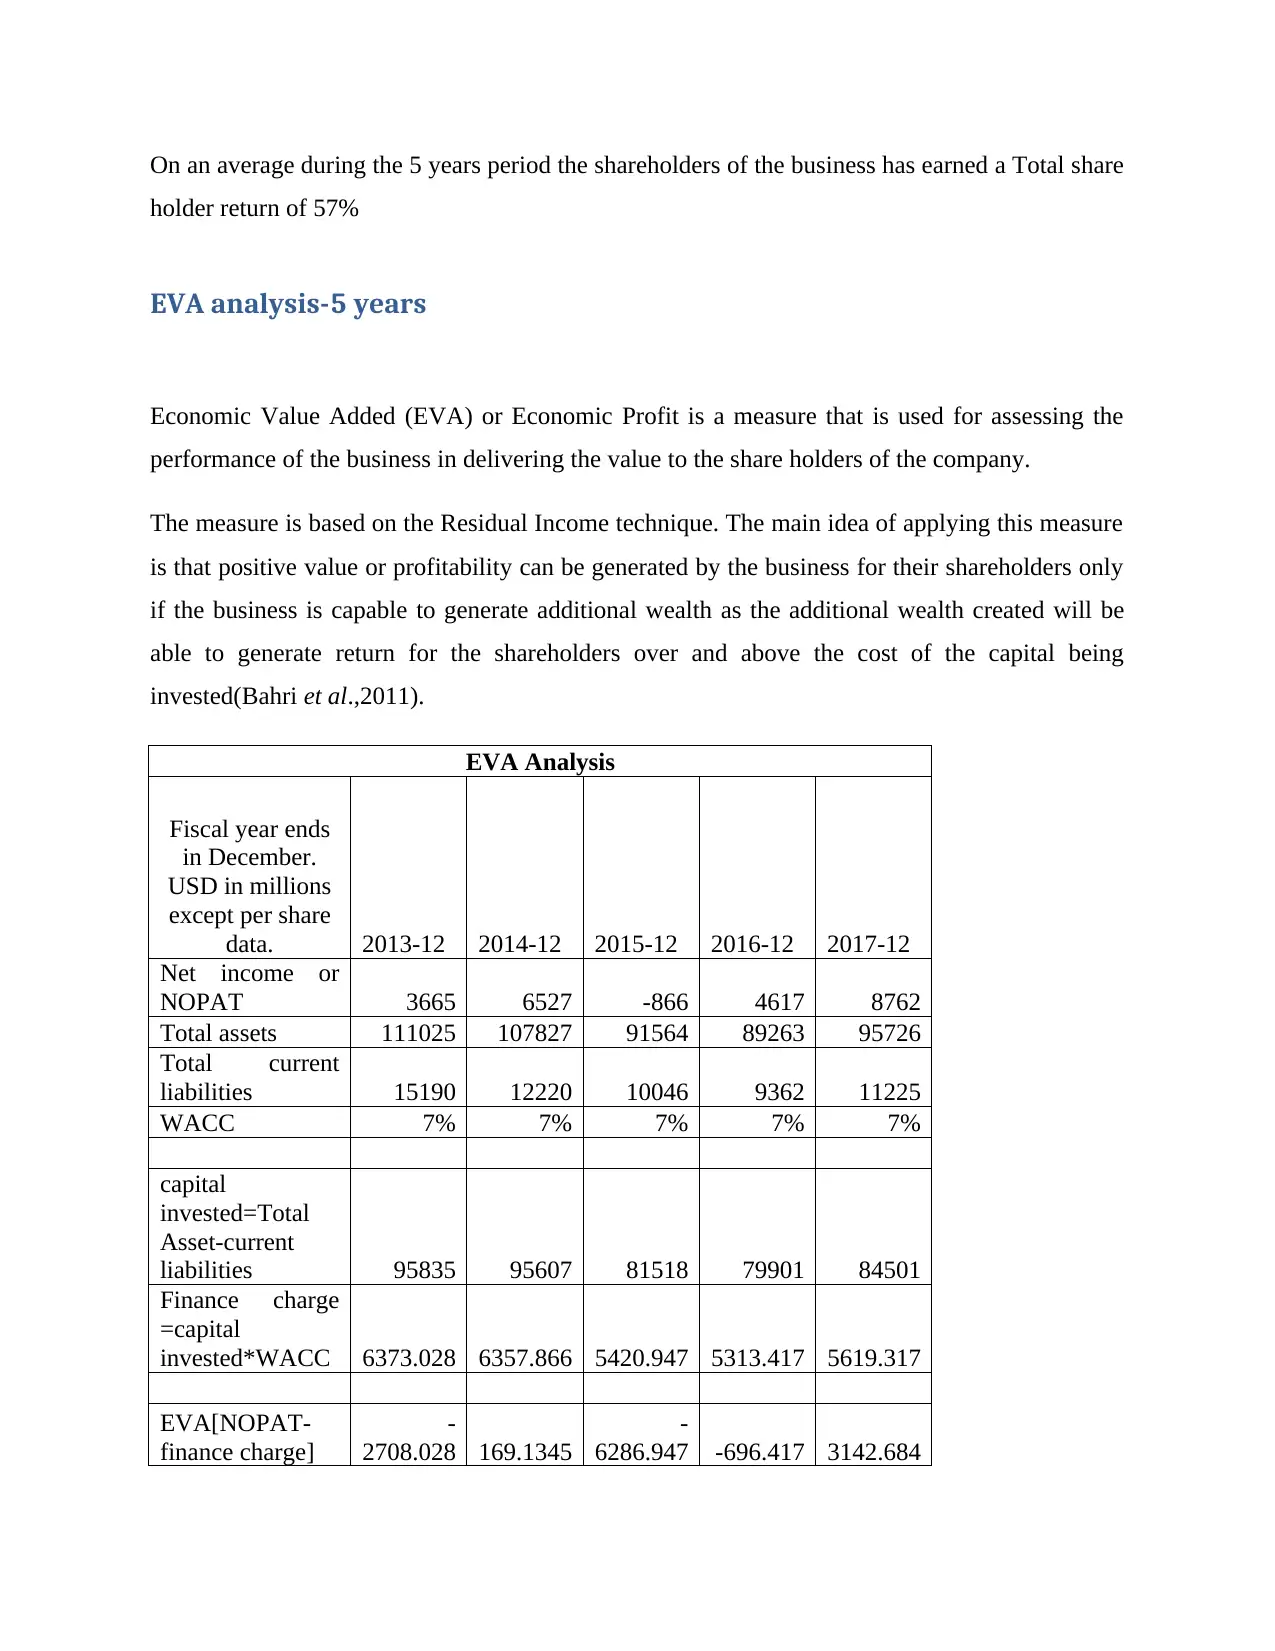
On an average during the 5 years period the shareholders of the business has earned a Total share
holder return of 57%
EVA analysis-5 years
Economic Value Added (EVA) or Economic Profit is a measure that is used for assessing the
performance of the business in delivering the value to the share holders of the company.
The measure is based on the Residual Income technique. The main idea of applying this measure
is that positive value or profitability can be generated by the business for their shareholders only
if the business is capable to generate additional wealth as the additional wealth created will be
able to generate return for the shareholders over and above the cost of the capital being
invested(Bahri et al.,2011).
EVA Analysis
Fiscal year ends
in December.
USD in millions
except per share
data. 2013-12 2014-12 2015-12 2016-12 2017-12
Net income or
NOPAT 3665 6527 -866 4617 8762
Total assets 111025 107827 91564 89263 95726
Total current
liabilities 15190 12220 10046 9362 11225
WACC 7% 7% 7% 7% 7%
capital
invested=Total
Asset-current
liabilities 95835 95607 81518 79901 84501
Finance charge
=capital
invested*WACC 6373.028 6357.866 5420.947 5313.417 5619.317
EVA[NOPAT-
finance charge]
-
2708.028 169.1345
-
6286.947 -696.417 3142.684
⊘ This is a preview!⊘
Do you want full access?
Subscribe today to unlock all pages.
Trusted by 1+ million students worldwide
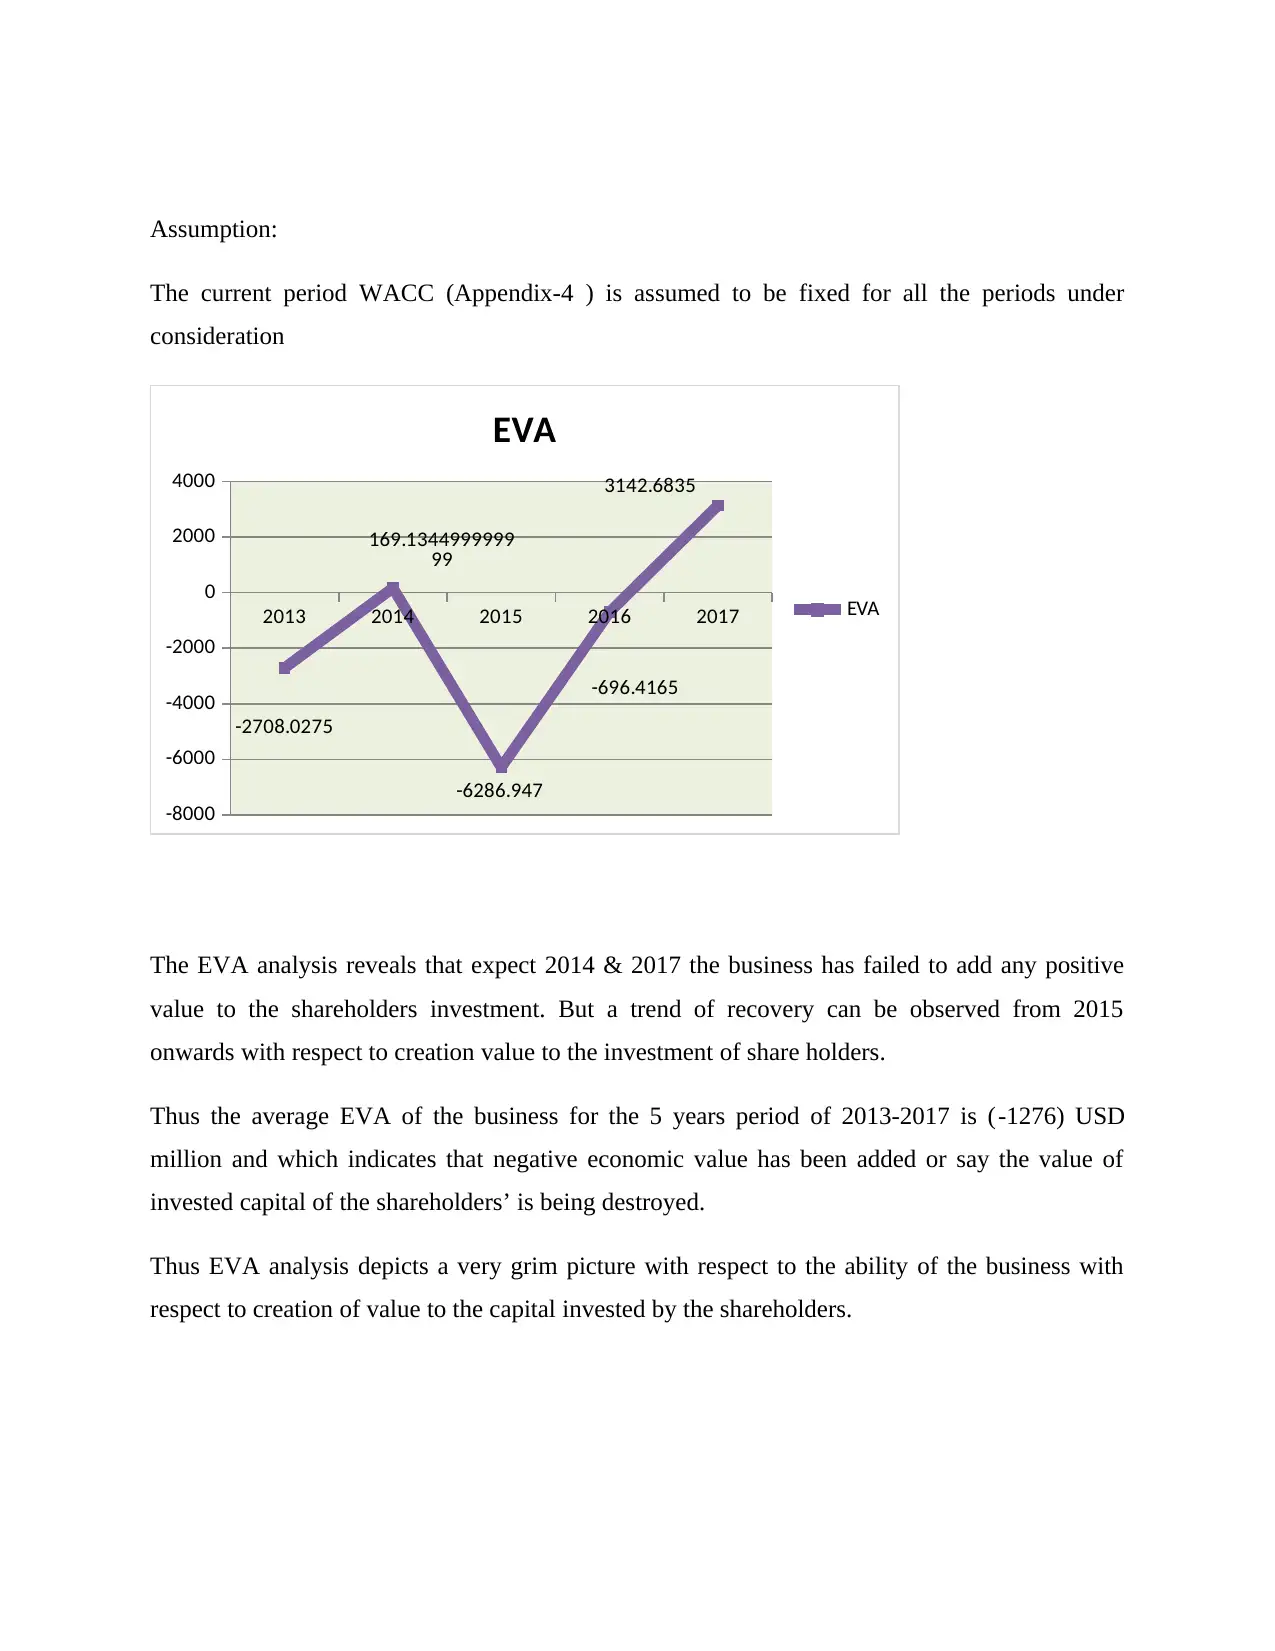
Assumption:
The current period WACC (Appendix-4 ) is assumed to be fixed for all the periods under
consideration
2013 2014 2015 2016 2017
-8000
-6000
-4000
-2000
0
2000
4000
-2708.0275
169.1344999999
99
-6286.947
-696.4165
3142.6835
EVA
EVA
The EVA analysis reveals that expect 2014 & 2017 the business has failed to add any positive
value to the shareholders investment. But a trend of recovery can be observed from 2015
onwards with respect to creation value to the investment of share holders.
Thus the average EVA of the business for the 5 years period of 2013-2017 is (-1276) USD
million and which indicates that negative economic value has been added or say the value of
invested capital of the shareholders’ is being destroyed.
Thus EVA analysis depicts a very grim picture with respect to the ability of the business with
respect to creation of value to the capital invested by the shareholders.
Paraphrase This Document
Need a fresh take? Get an instant paraphrase of this document with our AI Paraphraser
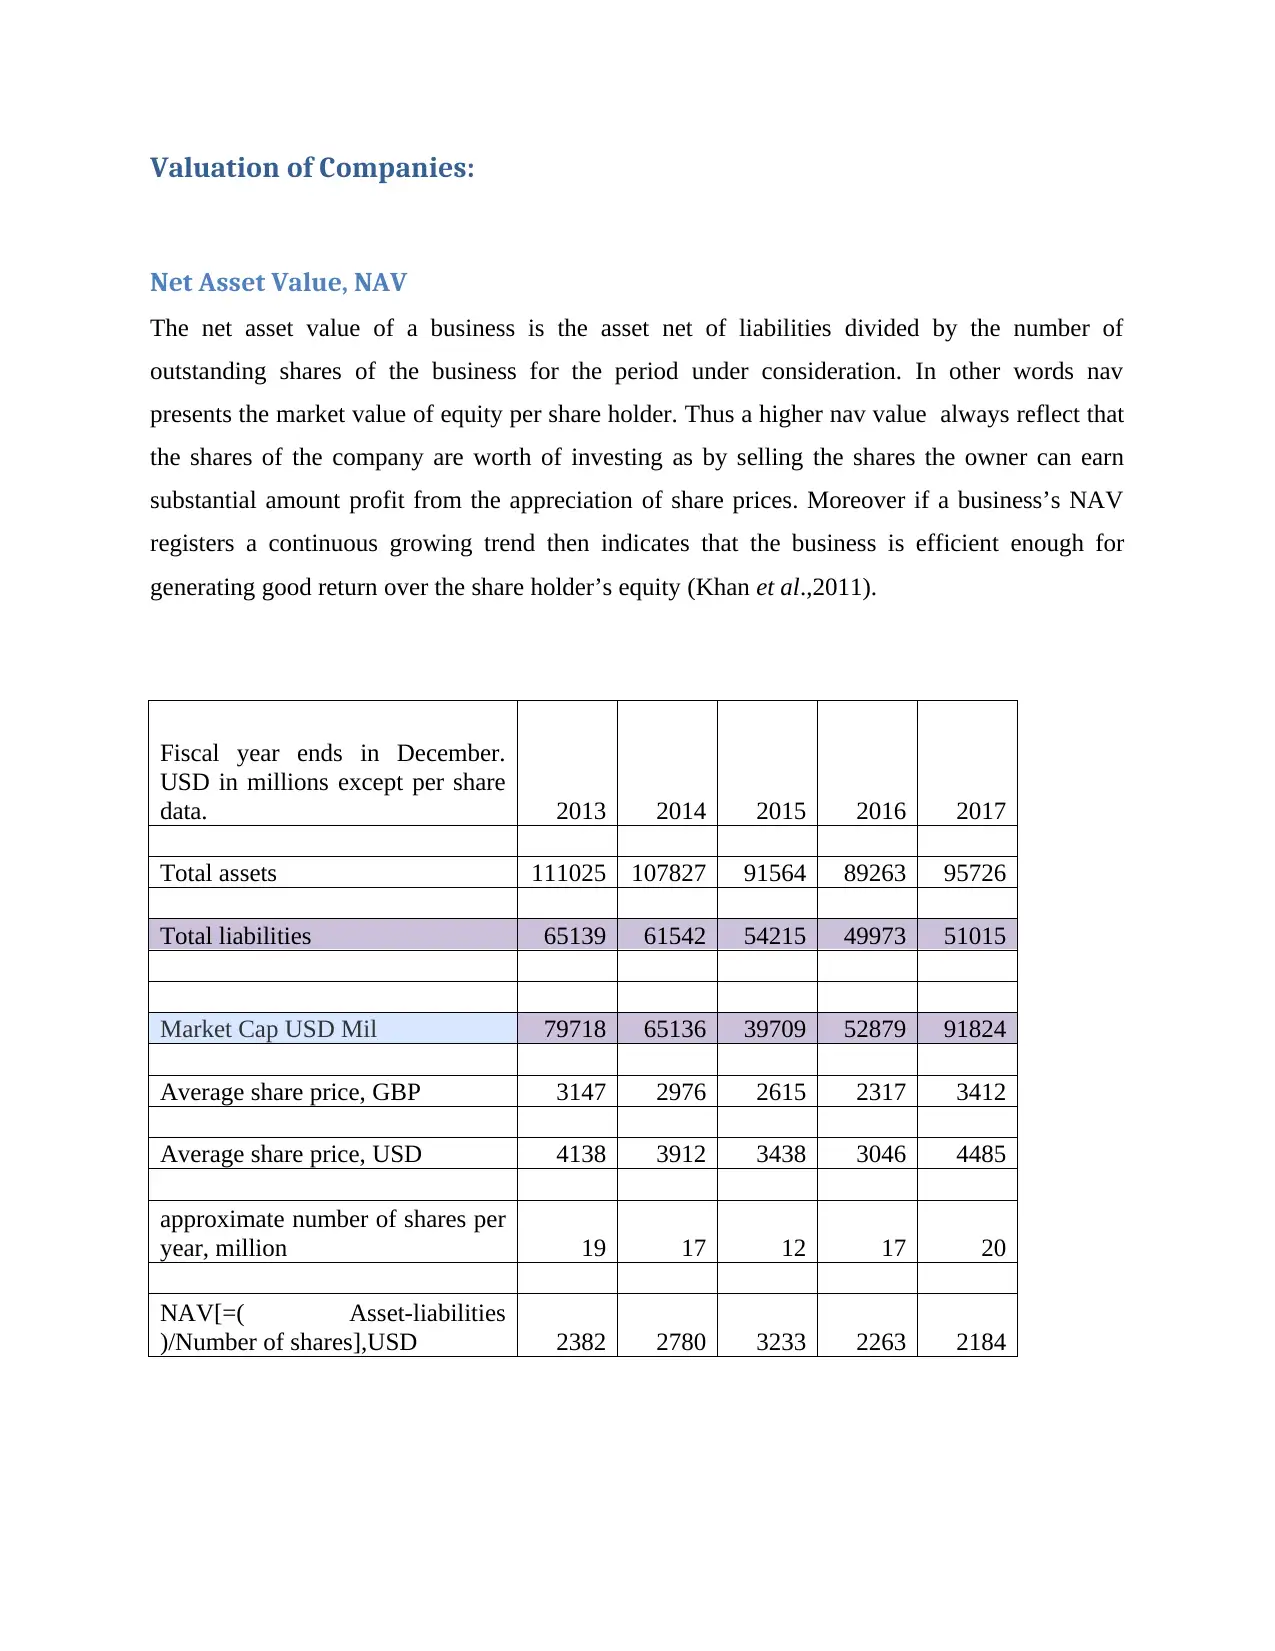
Valuation of Companies:
Net Asset Value, NAV
The net asset value of a business is the asset net of liabilities divided by the number of
outstanding shares of the business for the period under consideration. In other words nav
presents the market value of equity per share holder. Thus a higher nav value always reflect that
the shares of the company are worth of investing as by selling the shares the owner can earn
substantial amount profit from the appreciation of share prices. Moreover if a business’s NAV
registers a continuous growing trend then indicates that the business is efficient enough for
generating good return over the share holder’s equity (Khan et al.,2011).
Fiscal year ends in December.
USD in millions except per share
data. 2013 2014 2015 2016 2017
Total assets 111025 107827 91564 89263 95726
Total liabilities 65139 61542 54215 49973 51015
Market Cap USD Mil 79718 65136 39709 52879 91824
Average share price, GBP 3147 2976 2615 2317 3412
Average share price, USD 4138 3912 3438 3046 4485
approximate number of shares per
year, million 19 17 12 17 20
NAV[=( Asset-liabilities
)/Number of shares],USD 2382 2780 3233 2263 2184
2013 2014 2015 2016 2017
0
500
1000
1500
2000
2500
3000
3500
2382 2780
3233
2263 2184
NAV
NAV
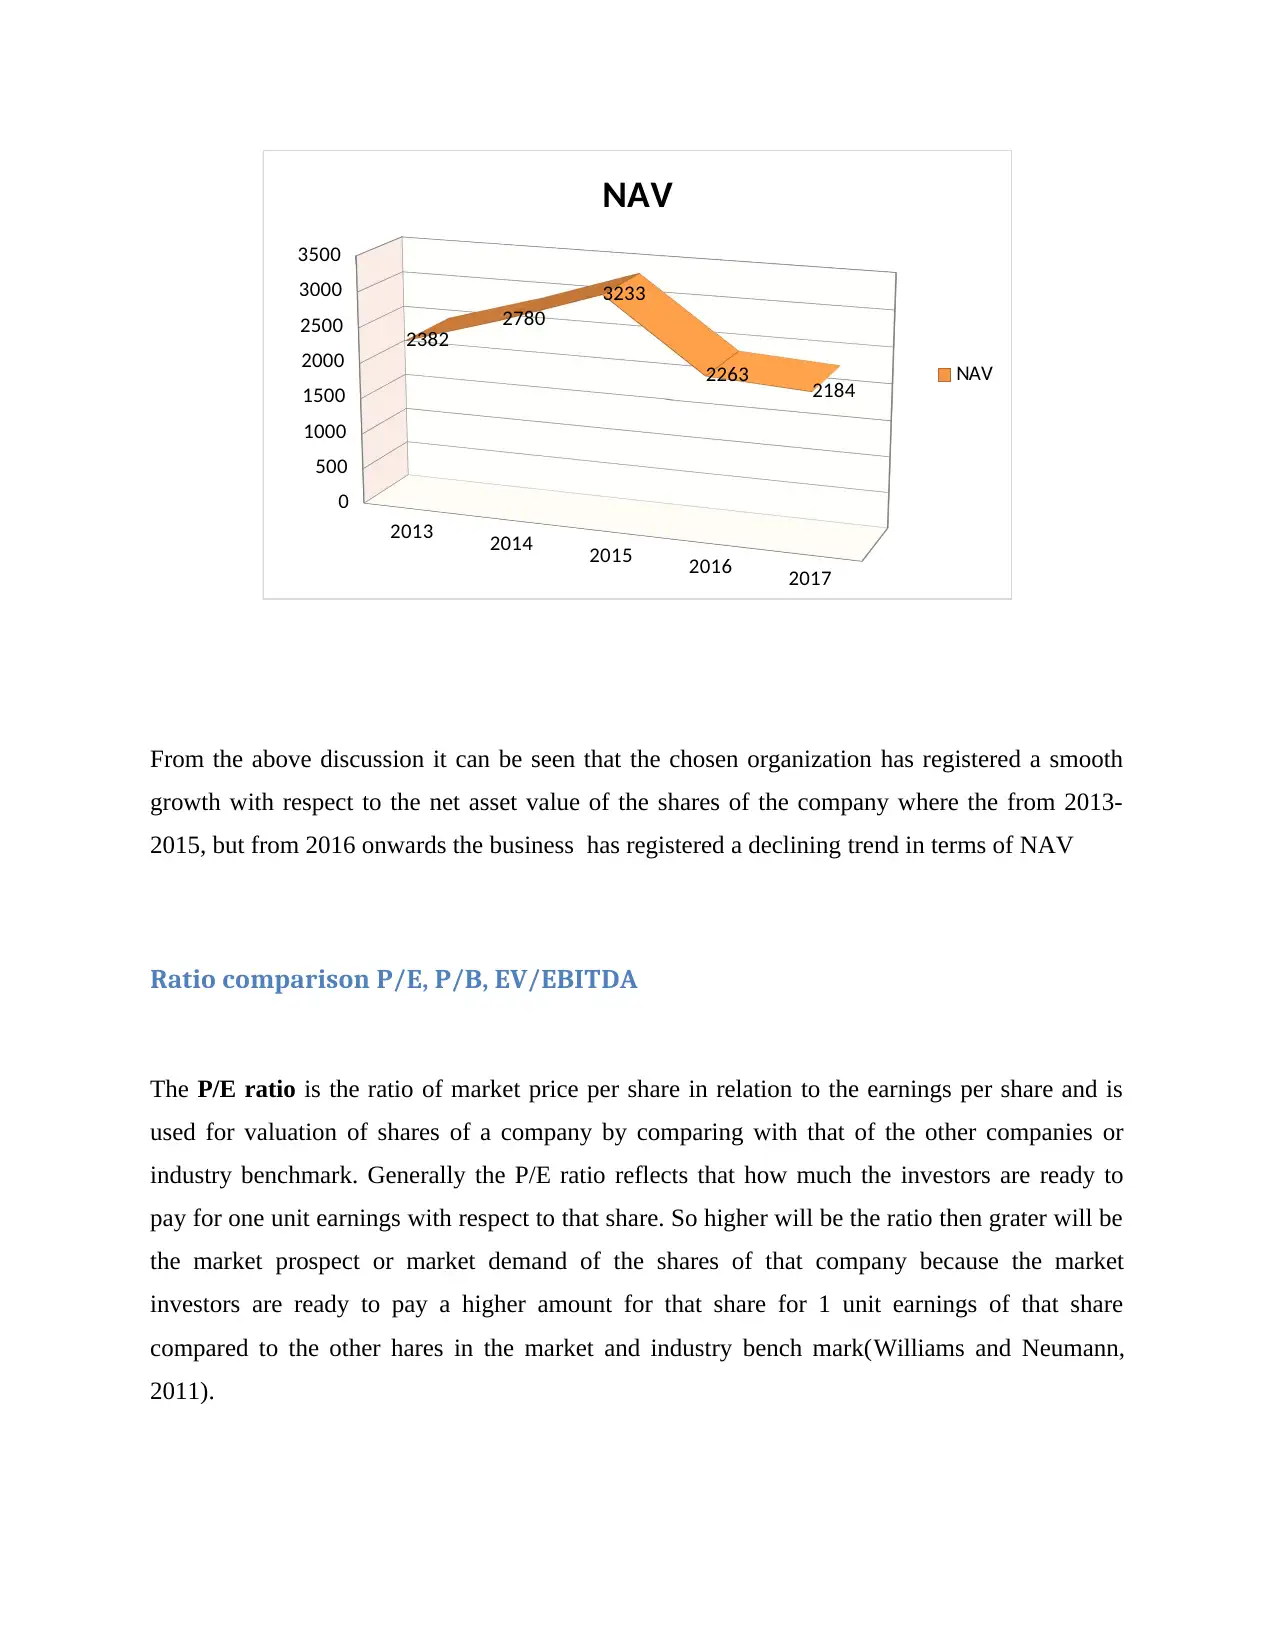
From the above discussion it can be seen that the chosen organization has registered a smooth
growth with respect to the net asset value of the shares of the company where the from 2013-
2015, but from 2016 onwards the business has registered a declining trend in terms of NAV
Ratio comparison P/E, P/B, EV/EBITDA
The P/E ratio is the ratio of market price per share in relation to the earnings per share and is
used for valuation of shares of a company by comparing with that of the other companies or
industry benchmark. Generally the P/E ratio reflects that how much the investors are ready to
pay for one unit earnings with respect to that share. So higher will be the ratio then grater will be
the market prospect or market demand of the shares of that company because the market
investors are ready to pay a higher amount for that share for 1 unit earnings of that share
compared to the other hares in the market and industry bench mark(Williams and Neumann,
2011).
0
500
1000
1500
2000
2500
3000
3500
2382 2780
3233
2263 2184
NAV
NAV
From the above discussion it can be seen that the chosen organization has registered a smooth
growth with respect to the net asset value of the shares of the company where the from 2013-
2015, but from 2016 onwards the business has registered a declining trend in terms of NAV
Ratio comparison P/E, P/B, EV/EBITDA
The P/E ratio is the ratio of market price per share in relation to the earnings per share and is
used for valuation of shares of a company by comparing with that of the other companies or
industry benchmark. Generally the P/E ratio reflects that how much the investors are ready to
pay for one unit earnings with respect to that share. So higher will be the ratio then grater will be
the market prospect or market demand of the shares of that company because the market
investors are ready to pay a higher amount for that share for 1 unit earnings of that share
compared to the other hares in the market and industry bench mark(Williams and Neumann,
2011).
⊘ This is a preview!⊘
Do you want full access?
Subscribe today to unlock all pages.
Trusted by 1+ million students worldwide
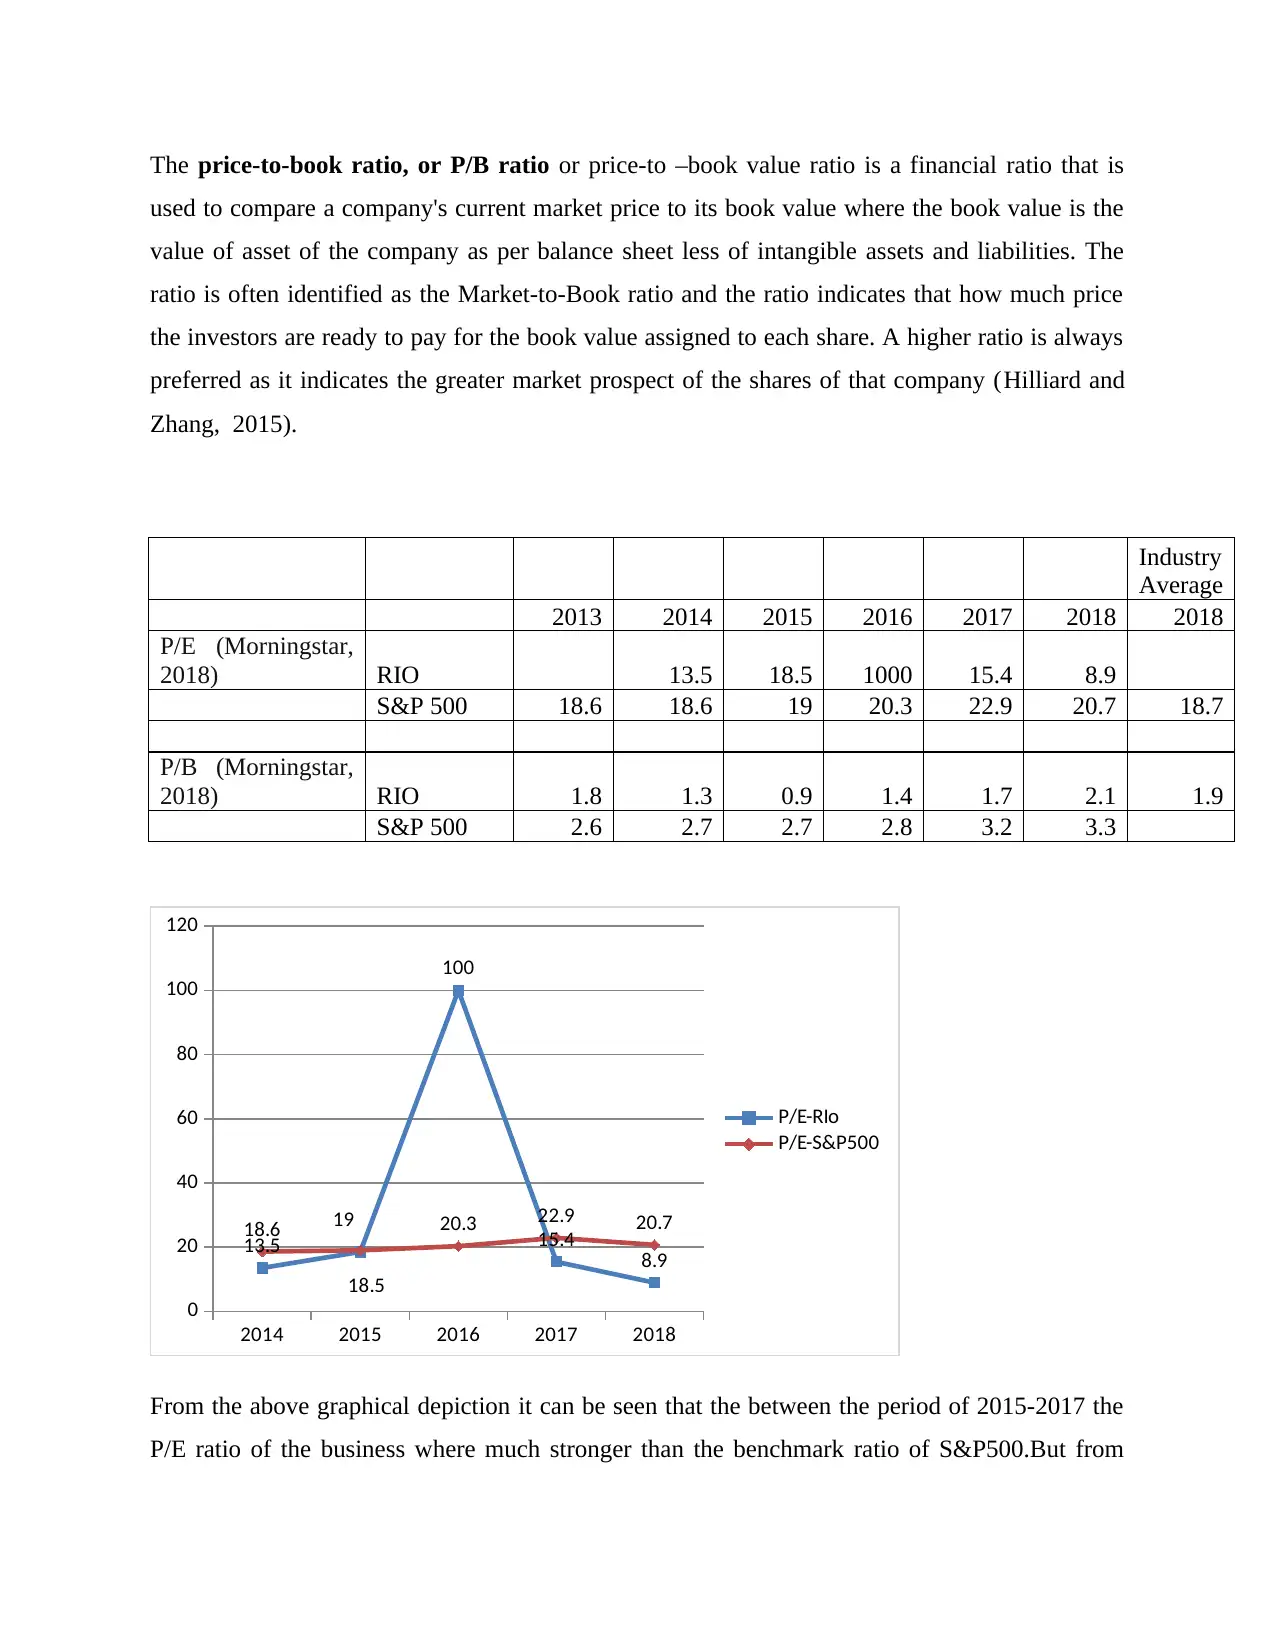
The price-to-book ratio, or P/B ratio or price-to –book value ratio is a financial ratio that is
used to compare a company's current market price to its book value where the book value is the
value of asset of the company as per balance sheet less of intangible assets and liabilities. The
ratio is often identified as the Market-to-Book ratio and the ratio indicates that how much price
the investors are ready to pay for the book value assigned to each share. A higher ratio is always
preferred as it indicates the greater market prospect of the shares of that company (Hilliard and
Zhang, 2015).
Industry
Average
2013 2014 2015 2016 2017 2018 2018
P/E (Morningstar,
2018) RIO 13.5 18.5 1000 15.4 8.9
S&P 500 18.6 18.6 19 20.3 22.9 20.7 18.7
P/B (Morningstar,
2018) RIO 1.8 1.3 0.9 1.4 1.7 2.1 1.9
S&P 500 2.6 2.7 2.7 2.8 3.2 3.3
2014 2015 2016 2017 2018
0
20
40
60
80
100
120
13.5
18.5
100
15.4 8.9
18.6 19 20.3 22.9 20.7
P/E-RIo
P/E-S&P500
From the above graphical depiction it can be seen that the between the period of 2015-2017 the
P/E ratio of the business where much stronger than the benchmark ratio of S&P500.But from
Paraphrase This Document
Need a fresh take? Get an instant paraphrase of this document with our AI Paraphraser
2017 onwards the valuation of the business in terms of the ratio has declined compared to the
S&P500 benchmarked index. Finally the P/E of 2018 is 8.9 which is much lower than the
industry average of 18.7.Thus the business has registered a declining performance with respect to
return on share holders equity from 2017 onwards in comparison to the industry standard with
respect to the P/E ratio.
2013 2014 2015 2016 2017 2018
0
0.5
1
1.5
2
2.5
3
3.5
1.8
1.3
0.9
1.4
1.7
2.1
2.6 2.7 2.7 2.8
3.2 3.3
P/B,RIO
P/B.S&P500
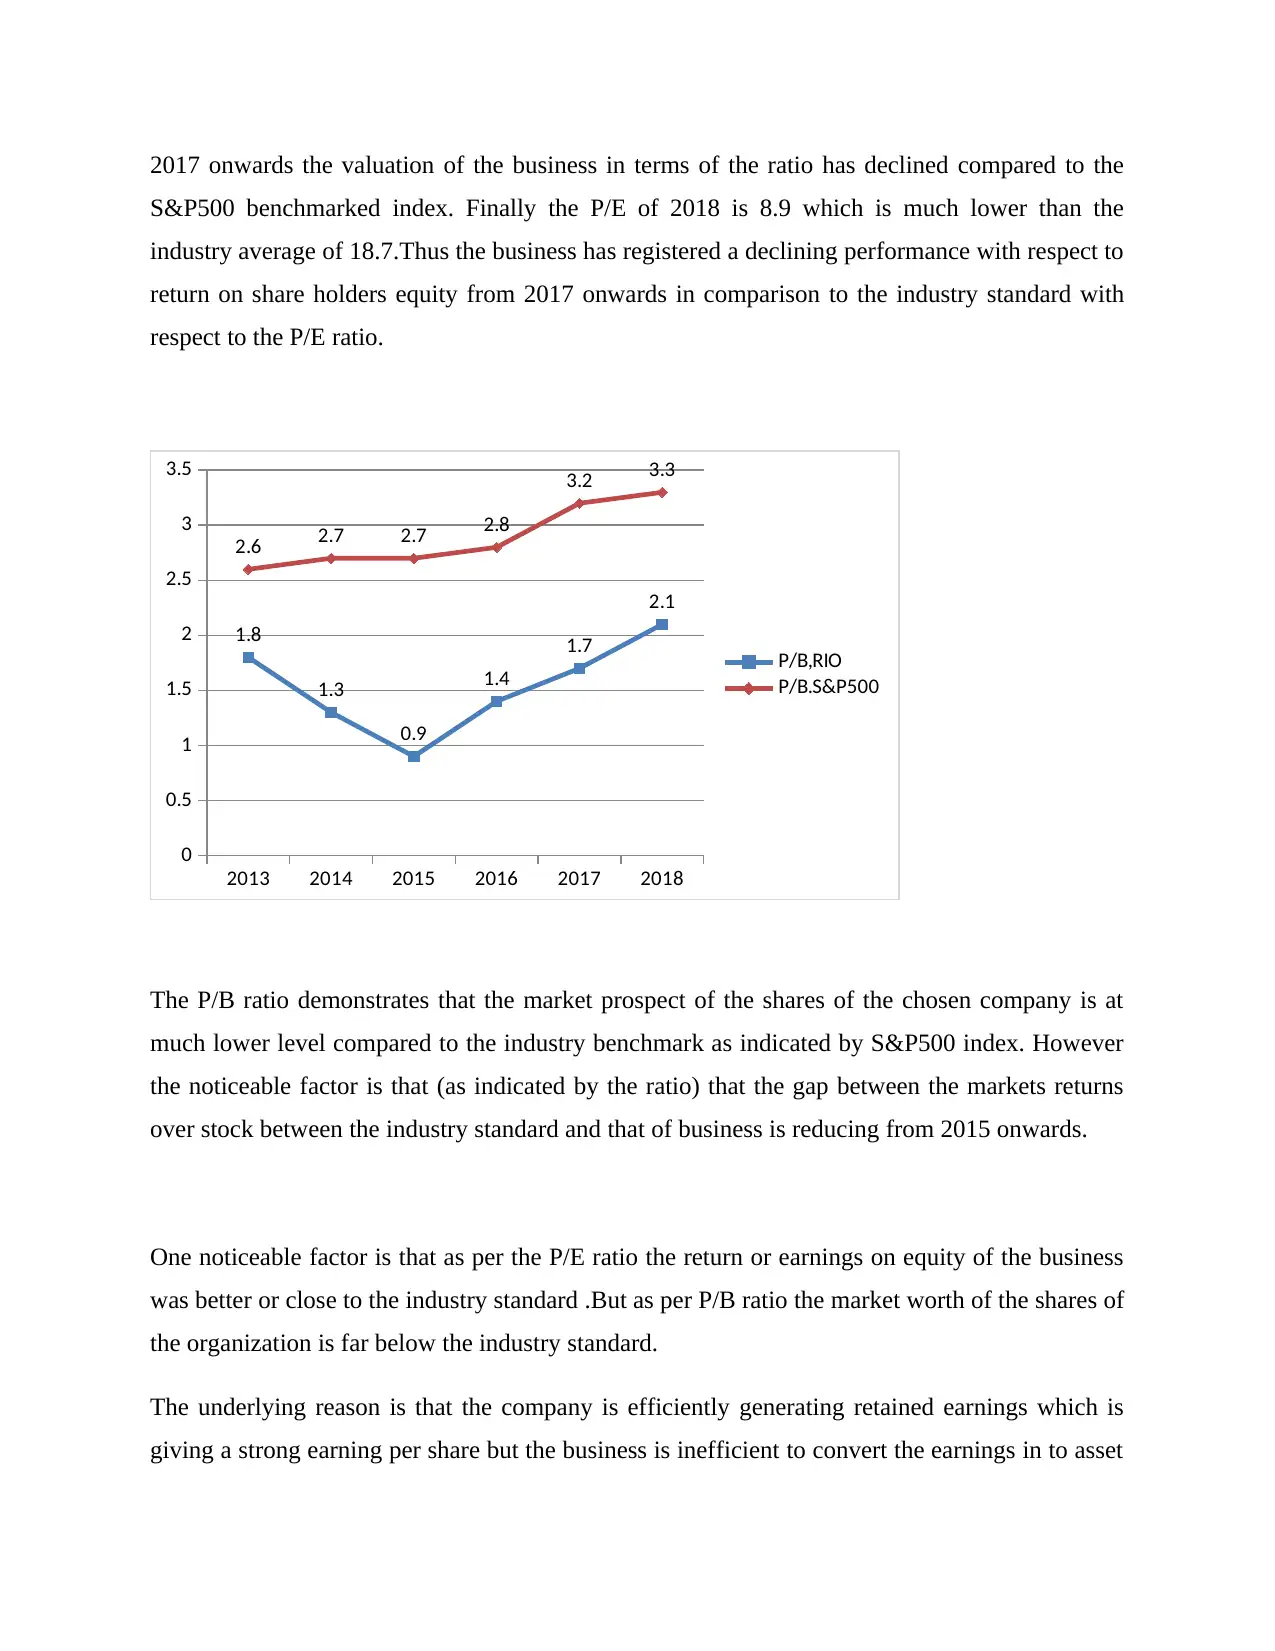
The P/B ratio demonstrates that the market prospect of the shares of the chosen company is at
much lower level compared to the industry benchmark as indicated by S&P500 index. However
the noticeable factor is that (as indicated by the ratio) that the gap between the markets returns
over stock between the industry standard and that of business is reducing from 2015 onwards.
One noticeable factor is that as per the P/E ratio the return or earnings on equity of the business
was better or close to the industry standard .But as per P/B ratio the market worth of the shares of
the organization is far below the industry standard.
The underlying reason is that the company is efficiently generating retained earnings which is
giving a strong earning per share but the business is inefficient to convert the earnings in to asset
S&P500 benchmarked index. Finally the P/E of 2018 is 8.9 which is much lower than the
industry average of 18.7.Thus the business has registered a declining performance with respect to
return on share holders equity from 2017 onwards in comparison to the industry standard with
respect to the P/E ratio.
2013 2014 2015 2016 2017 2018
0
0.5
1
1.5
2
2.5
3
3.5
1.8
1.3
0.9
1.4
1.7
2.1
2.6 2.7 2.7 2.8
3.2 3.3
P/B,RIO
P/B.S&P500
The P/B ratio demonstrates that the market prospect of the shares of the chosen company is at
much lower level compared to the industry benchmark as indicated by S&P500 index. However
the noticeable factor is that (as indicated by the ratio) that the gap between the markets returns
over stock between the industry standard and that of business is reducing from 2015 onwards.
One noticeable factor is that as per the P/E ratio the return or earnings on equity of the business
was better or close to the industry standard .But as per P/B ratio the market worth of the shares of
the organization is far below the industry standard.
The underlying reason is that the company is efficiently generating retained earnings which is
giving a strong earning per share but the business is inefficient to convert the earnings in to asset
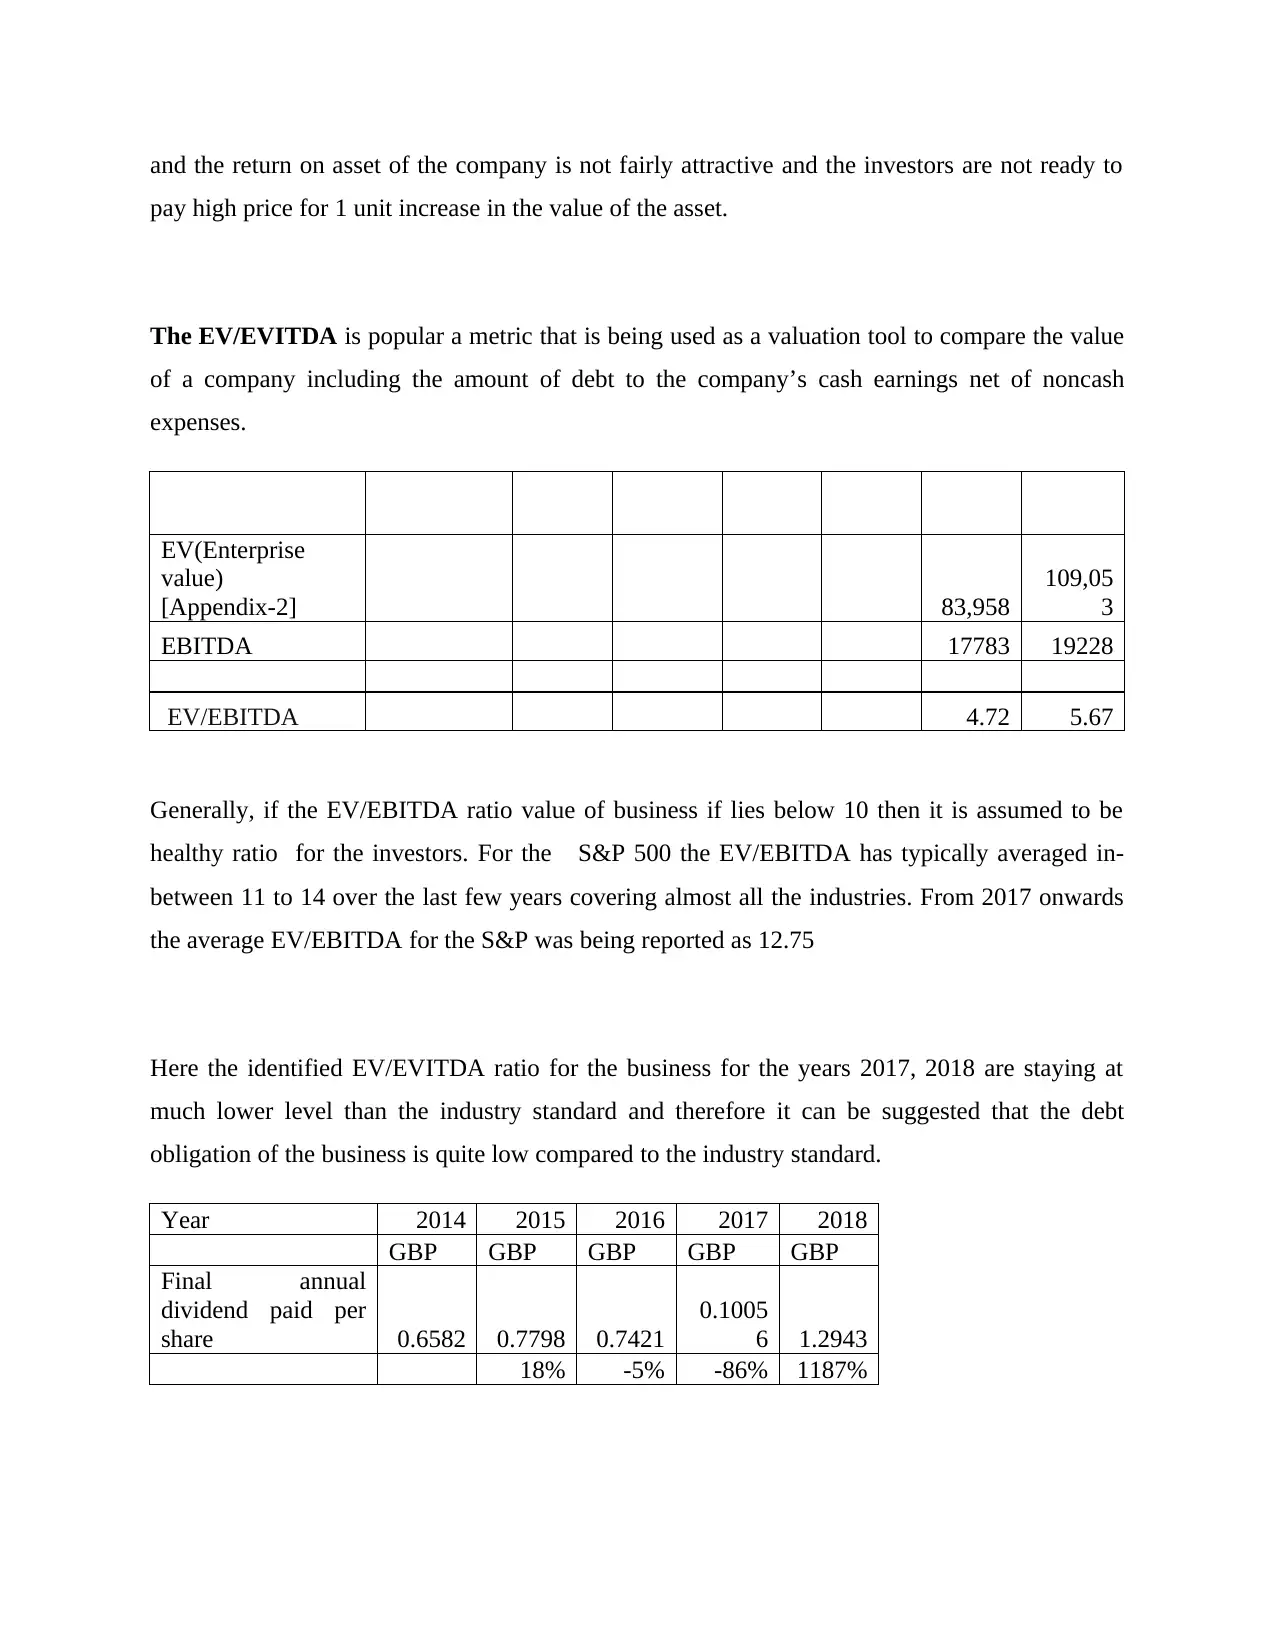
and the return on asset of the company is not fairly attractive and the investors are not ready to
pay high price for 1 unit increase in the value of the asset.
The EV/EVITDA is popular a metric that is being used as a valuation tool to compare the value
of a company including the amount of debt to the company’s cash earnings net of noncash
expenses.
EV(Enterprise
value)
[Appendix-2] 83,958
109,05
3
EBITDA 17783 19228
EV/EBITDA 4.72 5.67
Generally, if the EV/EBITDA ratio value of business if lies below 10 then it is assumed to be
healthy ratio for the investors. For the S&P 500 the EV/EBITDA has typically averaged in-
between 11 to 14 over the last few years covering almost all the industries. From 2017 onwards
the average EV/EBITDA for the S&P was being reported as 12.75
Here the identified EV/EVITDA ratio for the business for the years 2017, 2018 are staying at
much lower level than the industry standard and therefore it can be suggested that the debt
obligation of the business is quite low compared to the industry standard.
Year 2014 2015 2016 2017 2018
GBP GBP GBP GBP GBP
Final annual
dividend paid per
share 0.6582 0.7798 0.7421
0.1005
6 1.2943
18% -5% -86% 1187%
⊘ This is a preview!⊘
Do you want full access?
Subscribe today to unlock all pages.
Trusted by 1+ million students worldwide
1 out of 24
Related Documents


Your All-in-One AI-Powered Toolkit for Academic Success.
+13062052269
info@desklib.com
Available 24*7 on WhatsApp / Email
![[object Object]](/_next/static/media/star-bottom.7253800d.svg)
Unlock your academic potential
Copyright © 2020–2026 A2Z Services. All Rights Reserved. Developed and managed by ZUCOL.