Analysis of Capital Structure and Gearing Ratio for Two Companies
VerifiedAdded on 2023/06/11
|6
|1469
|459
Report
AI Summary
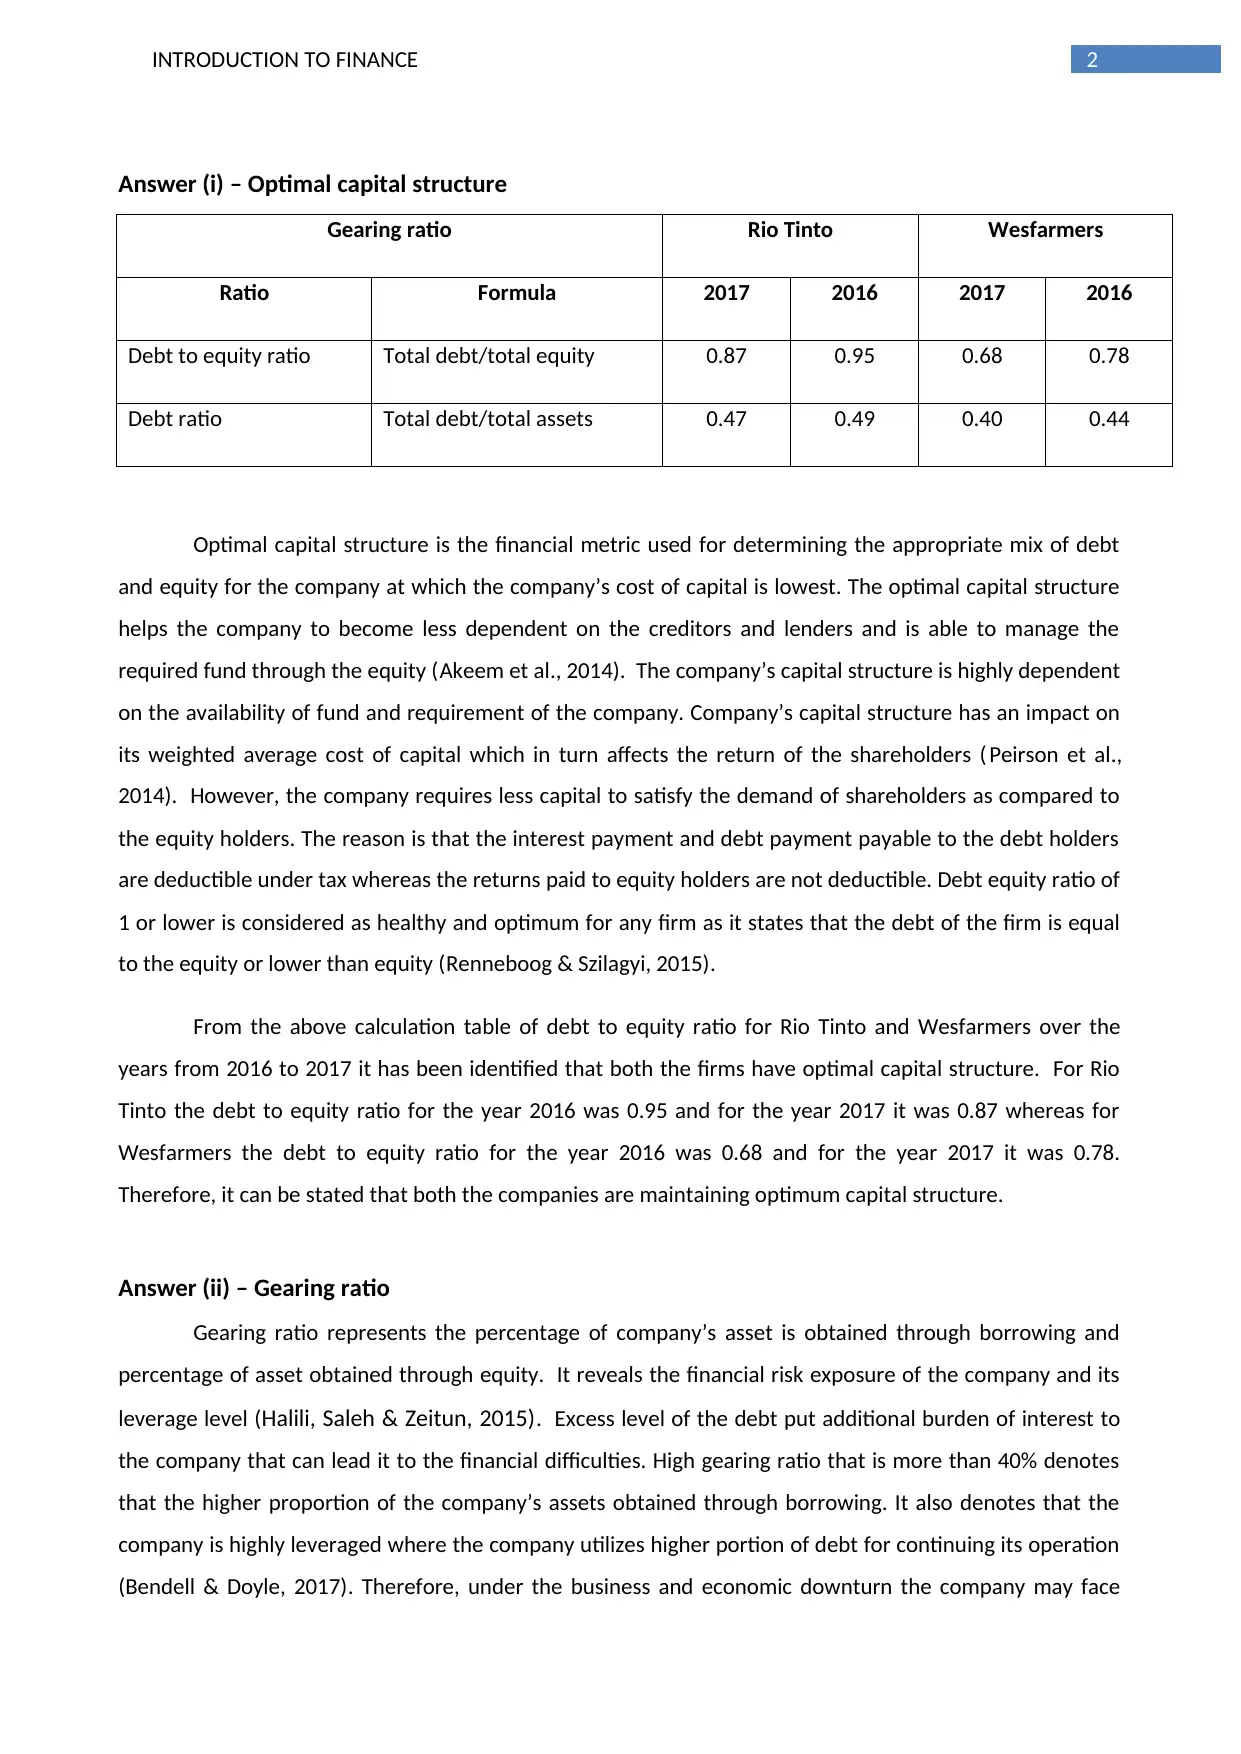
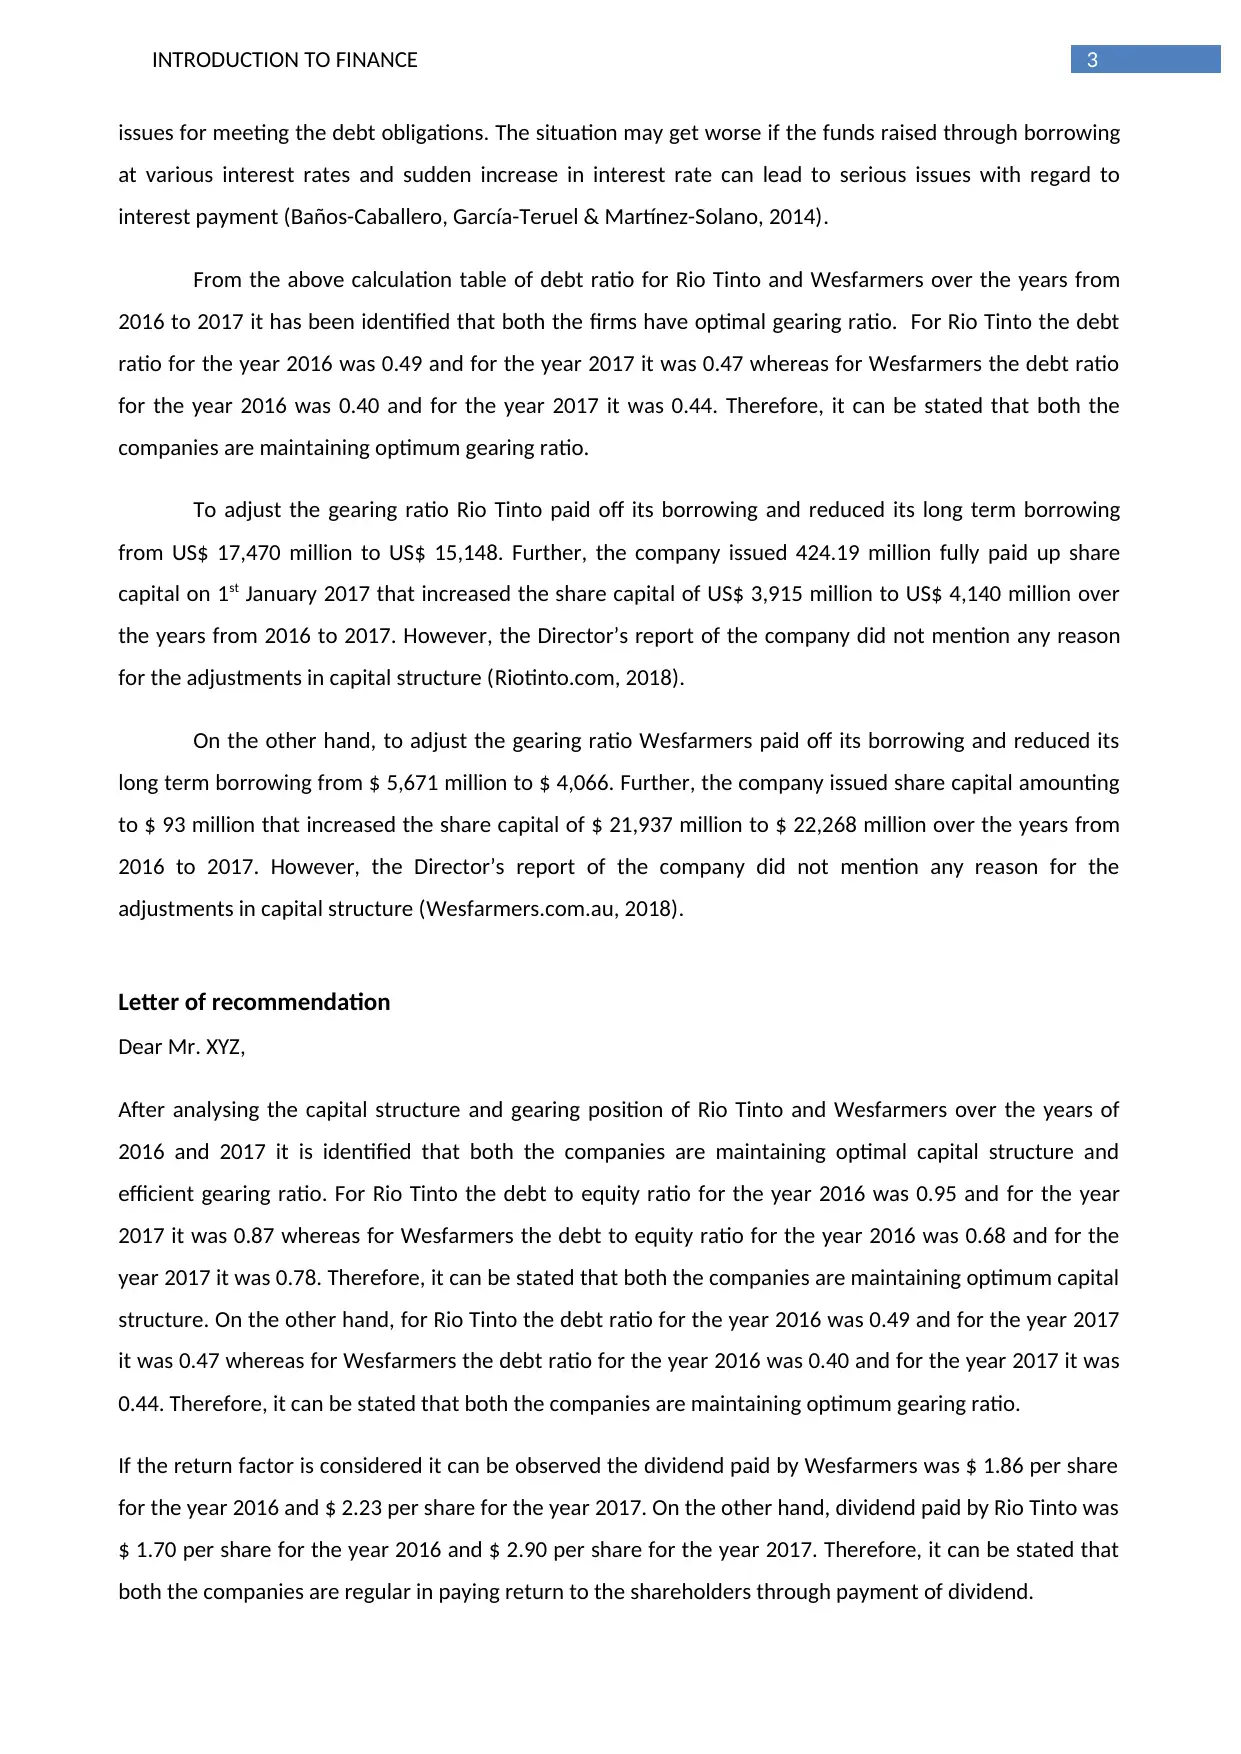
This report provides an analysis of the capital structure and gearing ratios of Rio Tinto and Wesfarmers for the years 2016 and 2017. It evaluates whether the companies maintain an optimal capital structure, indicated by a debt-to-equity ratio of 1 or lower, and an efficient gearing ratio, representin...
Read More
Contribute Materials
Your contribution can guide someone’s learning journey. Share your
documents today.

Running head: INTRODUCTION TO FINANCE
Introduction to finance
Name of the student
Name of the university
Student ID
Author note
Introduction to finance
Name of the student
Name of the university
Student ID
Author note
Secure Best Marks with AI Grader
Need help grading? Try our AI Grader for instant feedback on your assignments.

1INTRODUCTION TO FINANCE
Table of Contents
Answer (i) – Optimal capital structure..............................................................................................................2
Answer (ii) – Gearing ratio................................................................................................................................2
Letter of recommendation...............................................................................................................................3
Reference.........................................................................................................................................................5

2INTRODUCTION TO FINANCE
Answer (i) – Optimal capital structure
Gearing ratio Rio Tinto Wesfarmers
Ratio Formula 2017 2016 2017 2016
Debt to equity ratio Total debt/total equity 0.87 0.95 0.68 0.78
Debt ratio Total debt/total assets 0.47 0.49 0.40 0.44
Optimal capital structure is the financial metric used for determining the appropriate mix of debt
and equity for the company at which the company’s cost of capital is lowest. The optimal capital structure
helps the company to become less dependent on the creditors and lenders and is able to manage the
required fund through the equity (Akeem et al., 2014). The company’s capital structure is highly dependent
on the availability of fund and requirement of the company. Company’s capital structure has an impact on
its weighted average cost of capital which in turn affects the return of the shareholders ( Peirson et al.,
2014). However, the company requires less capital to satisfy the demand of shareholders as compared to
the equity holders. The reason is that the interest payment and debt payment payable to the debt holders
are deductible under tax whereas the returns paid to equity holders are not deductible. Debt equity ratio of
1 or lower is considered as healthy and optimum for any firm as it states that the debt of the firm is equal
to the equity or lower than equity (Renneboog & Szilagyi, 2015).
From the above calculation table of debt to equity ratio for Rio Tinto and Wesfarmers over the
years from 2016 to 2017 it has been identified that both the firms have optimal capital structure. For Rio
Tinto the debt to equity ratio for the year 2016 was 0.95 and for the year 2017 it was 0.87 whereas for
Wesfarmers the debt to equity ratio for the year 2016 was 0.68 and for the year 2017 it was 0.78.
Therefore, it can be stated that both the companies are maintaining optimum capital structure.
Answer (ii) – Gearing ratio
Gearing ratio represents the percentage of company’s asset is obtained through borrowing and
percentage of asset obtained through equity. It reveals the financial risk exposure of the company and its
leverage level (Halili, Saleh & Zeitun, 2015). Excess level of the debt put additional burden of interest to
the company that can lead it to the financial difficulties. High gearing ratio that is more than 40% denotes
that the higher proportion of the company’s assets obtained through borrowing. It also denotes that the
company is highly leveraged where the company utilizes higher portion of debt for continuing its operation
(Bendell & Doyle, 2017). Therefore, under the business and economic downturn the company may face

3INTRODUCTION TO FINANCE
issues for meeting the debt obligations. The situation may get worse if the funds raised through borrowing
at various interest rates and sudden increase in interest rate can lead to serious issues with regard to
interest payment (Baños-Caballero, García-Teruel & Martínez-Solano, 2014).
From the above calculation table of debt ratio for Rio Tinto and Wesfarmers over the years from
2016 to 2017 it has been identified that both the firms have optimal gearing ratio. For Rio Tinto the debt
ratio for the year 2016 was 0.49 and for the year 2017 it was 0.47 whereas for Wesfarmers the debt ratio
for the year 2016 was 0.40 and for the year 2017 it was 0.44. Therefore, it can be stated that both the
companies are maintaining optimum gearing ratio.
To adjust the gearing ratio Rio Tinto paid off its borrowing and reduced its long term borrowing
from US$ 17,470 million to US$ 15,148. Further, the company issued 424.19 million fully paid up share
capital on 1st January 2017 that increased the share capital of US$ 3,915 million to US$ 4,140 million over
the years from 2016 to 2017. However, the Director’s report of the company did not mention any reason
for the adjustments in capital structure (Riotinto.com, 2018).
On the other hand, to adjust the gearing ratio Wesfarmers paid off its borrowing and reduced its
long term borrowing from $ 5,671 million to $ 4,066. Further, the company issued share capital amounting
to $ 93 million that increased the share capital of $ 21,937 million to $ 22,268 million over the years from
2016 to 2017. However, the Director’s report of the company did not mention any reason for the
adjustments in capital structure (Wesfarmers.com.au, 2018).
Letter of recommendation
Dear Mr. XYZ,
After analysing the capital structure and gearing position of Rio Tinto and Wesfarmers over the years of
2016 and 2017 it is identified that both the companies are maintaining optimal capital structure and
efficient gearing ratio. For Rio Tinto the debt to equity ratio for the year 2016 was 0.95 and for the year
2017 it was 0.87 whereas for Wesfarmers the debt to equity ratio for the year 2016 was 0.68 and for the
year 2017 it was 0.78. Therefore, it can be stated that both the companies are maintaining optimum capital
structure. On the other hand, for Rio Tinto the debt ratio for the year 2016 was 0.49 and for the year 2017
it was 0.47 whereas for Wesfarmers the debt ratio for the year 2016 was 0.40 and for the year 2017 it was
0.44. Therefore, it can be stated that both the companies are maintaining optimum gearing ratio.
If the return factor is considered it can be observed the dividend paid by Wesfarmers was $ 1.86 per share
for the year 2016 and $ 2.23 per share for the year 2017. On the other hand, dividend paid by Rio Tinto was
$ 1.70 per share for the year 2016 and $ 2.90 per share for the year 2017. Therefore, it can be stated that
both the companies are regular in paying return to the shareholders through payment of dividend.
Secure Best Marks with AI Grader
Need help grading? Try our AI Grader for instant feedback on your assignments.

4INTRODUCTION TO FINANCE
Therefore, taking into consideration all the above stated facts, it is identified that the company’s gearing
ratio is optimum to maintain the strong leverage position and the capital structure is stating that the
companies are maintaining optimal capital structure. Hence, it is recommended that both the stocks can be
included in your portfolio.
Sincerely,
Mr. John Hudson
Investment analyst

5INTRODUCTION TO FINANCE
Reference
Akeem, L.B., Terer, E.K., Kiyanjui, M.W. & Kayode, A.M., (2014). Effects of capital structure on firm’s
performance: Empirical study of manufacturing companies in Nigeria. Journal of Finance and
Investment Analysis, 3(4), pp.39-57.
Baños-Caballero, S., García-Teruel, P.J. & Martínez-Solano, P., (2014). Working capital management,
corporate performance, and financial constraints. Journal of Business Research, 67(3), pp.332-338.
Bendell, J. & Doyle, I., (2017). Healing capitalism: five years in the life of business, finance and corporate
responsibility. Routledge.
Halili, E, Saleh, A & Zeitun, R., (2015). 'Governance and Long-Term Operating Performance of Family
and Non-Family Firms in Australia', Studies in Economics and Finance, vol.32, no.4, pp.398-421.
Peirson, G., Brown, R., Easton, S. & Howard, P., (2014). Business finance. McGraw-Hill Education Australia.
Renneboog, L. & Szilagyi, P.G., (2015). How relevant is dividend policy under low shareholder
protection?. Journal of International Financial Markets, Institutions and Money.
Riotinto.com. (2018). [online] Available at:
https://www.riotinto.com/documents/RT_2017_Annual_Report.pdf [Accessed 29 May 2018].
Wesfarmers.com.au. (2018). [online] Available at:
https://www.wesfarmers.com.au/docs/default-source/default-document-library/2017-annual-
report.pdf?sfvrsn=0 [Accessed 29 May 2018].
1 out of 6
Related Documents

Your All-in-One AI-Powered Toolkit for Academic Success.
+13062052269
info@desklib.com
Available 24*7 on WhatsApp / Email
Unlock your academic potential
© 2024 | Zucol Services PVT LTD | All rights reserved.