PRJM6003 - Project Risk Management Assessment 2: Budget Report
VerifiedAdded on 2022/11/14
|21
|4455
|120
Report
AI Summary
This report provides a comprehensive analysis of project risk management, focusing on budget creation and risk mitigation strategies. It begins with an executive summary and an introduction outlining the project scope and objectives. The report recommends a baseline budget and explores potential risk events, followed by a discussion on contingency planning and sensitivity analysis. It delves into controlling sensitive cost variables and risk events, and examines organizational policies relevant to project finance. The report utilizes Monte Carlo simulation to model uncertainties and assess the impact of various risk factors on the project budget. The appendix includes a quick output report, probability distributions for cost variables, correlation matrices, and consequences of risk events, offering a detailed overview of the financial risks associated with the project.

1
RISK MANAGEMENT IN THE PROJECT
Student Name:
Course
Date
RISK MANAGEMENT IN THE PROJECT
Student Name:
Course
Date
Paraphrase This Document
Need a fresh take? Get an instant paraphrase of this document with our AI Paraphraser
2
Executive summary
In this articles we shall discuss about the project risk management, we shall start our discussion
by recommending the baseline for the budget and then we shall explain the two risk events which
might occur. Moreover we shall discus the recommendation for the contingency here we shall
discuss how contingency costs are used and why they are not included in some budget baselines.
Furthermore we shall discuss the sensitivity analysis here we shall discuss on the highly critical
cost variables as well as risk events.
Also, we shall conduct detailed discussion and comparison between corporate policy and
outcomes. In addition we summarize in the Appendix by discussing quick output report, risk
probability, cost variable, , correlation matrix and consequences of one risk events.
3
Table of Contents
Introduction.................................................................................................................................................4
Baseline budget...........................................................................................................................................5
Monte Carlo Simulation...............................................................................................................................7
Risk events...................................................................................................................................................8
Risk Management....................................................................................................................................8
The Beta an passive risk management...............................................................................................12
Contingency cost.......................................................................................................................................13
Sensitivity analysis.....................................................................................................................................14
Controlling of most sensitive variables..................................................................................................15
Controlling sensitive risk event..............................................................................................................15
Organizational policy.................................................................................................................................16
Appendix...................................................................................................................................................17
Quick output report...............................................................................................................................17
Probability distribution for cost variable...............................................................................................17
Consequences of one risk event............................................................................................................18
Probability of One Risk Event................................................................................................................18
Correlation matrix.................................................................................................................................18
Bibliography...............................................................................................................................................20
⊘ This is a preview!⊘
Do you want full access?
Subscribe today to unlock all pages.
Trusted by 1+ million students worldwide
4
Budget report using Monte Carlo simulation
Introduction
A budget report is any report which is used internally by the management in comparing the
estimates, projections of the budgets with the real performances which were achieved during a
specific period of time. More precisely the budget report is prepared so as to be used in
comparing how close the budget performance was the real outcomes with the accounting period.
Budget reporting can be done with the utilization of a famous simulation tool named Monte
Carlo which is a method used in understanding the effects of uncertainty and risk in cost,
forecasting models, financial and projects management1. A Monte Carlo simulator assists
individual for all the possible outcomes to have a great idea in minizing the risk when budgeting
the report.
The purpose of this article is generate a more detail budget report using Monte Carlos simulation
and also to evaluate various risks related to the finance in the Starbucks Company2. The company
faces a lot of risk when they are intending to managed their finances. The major reason behind
deployment of the project is to make sure that existing and future risks will be handled well in
the company3.
1 Arenas, Daniel, Lanair, Lett, Klusaritz, and Teitelman. "A Monte Carlo simulation approach for estimating the health and
economic impact of interventions provided at a student-run clinic." PloS one 12, no. 12 (2017): e0189718.
2 Acebes, Fernando, Pereda, Poza, Pajares, and Galán. "Stochastic earned value analysis using Monte Carlo simulation and
statistical learning techniques." International Journal of Project Management 33, no. 7 (2015): 1597-1609.
3 Baalousha, Musa. "Using Monte Carlo simulation to estimate natural groundwater recharge in Qatar." Modeling Earth Systems
and Environment 2, no. 2 (2016): 87.
Paraphrase This Document
Need a fresh take? Get an instant paraphrase of this document with our AI Paraphraser
5
Baseline budget
Baseline budget is extensively used in company, project management and accounting to refer to
similar concepts4. In the company, baseline budgeting uses the current spending levels as a
baseline for preparing the budget of the future fiscal year. In project risk management baseline
budget is very crucial in using in the time –phased plan which includes the estimate projects
indirect and direct costs5. Moreover, it includes the needed reference points that can be used in
analysis the company performances. The project manager faces a lot of challenges as they are
trying to make proper estimation and in creating project baselines. The company project baseline
includes a unit price analysis, cost breakdown structure, cash flows and overhead costs6. The
budget baseline can be prepared in according with the project size and requirements. After
preparing a baseline schedule then the next thing is to plan for the baseline budget which it had
already be created. Some considerations should be put in place when creating the budget
baselines, this considerations includes the following work scope, work breakdown, duration of
the project, indirect and direct costs and risks.
Baselines should be change when the also changes in scope. As the project progresses, the
project scope may change based on the technical requires. Once the scope changes, then the cost
of items should be calculated based on the new conditions. During the project execution period at
least one task may have been underestimated.
Below is a budget baseline of based on cost variables
4 Zhu, Lin, He, Shang, Zhang, and Ma. "Influencing factors and scenario forecasts of carbon emissions of the Chinese power
industry: Based on a Generalized Divisia Index Model and Monte Carlo Simulation." Energies 11, no. 9 (2018): 2398.
5 Korytárová, Jana, and Pospíšilová. "Evaluation of investment risks in CBA with Monte Carlo method." Acta Universitatis
Agriculturae et Silviculturae Mendelianae Brunensis 63, no. 1 (2015): 245-251.
6 Weber, Mark, Victor Gorshelev, and Serdyuchenko. "Uncertainty budgets of major ozone absorption cross sections used in UV
remote sensing applications." Atmospheric Measurement Techniques 9, no. 9 (2016): 4459-4470.
6
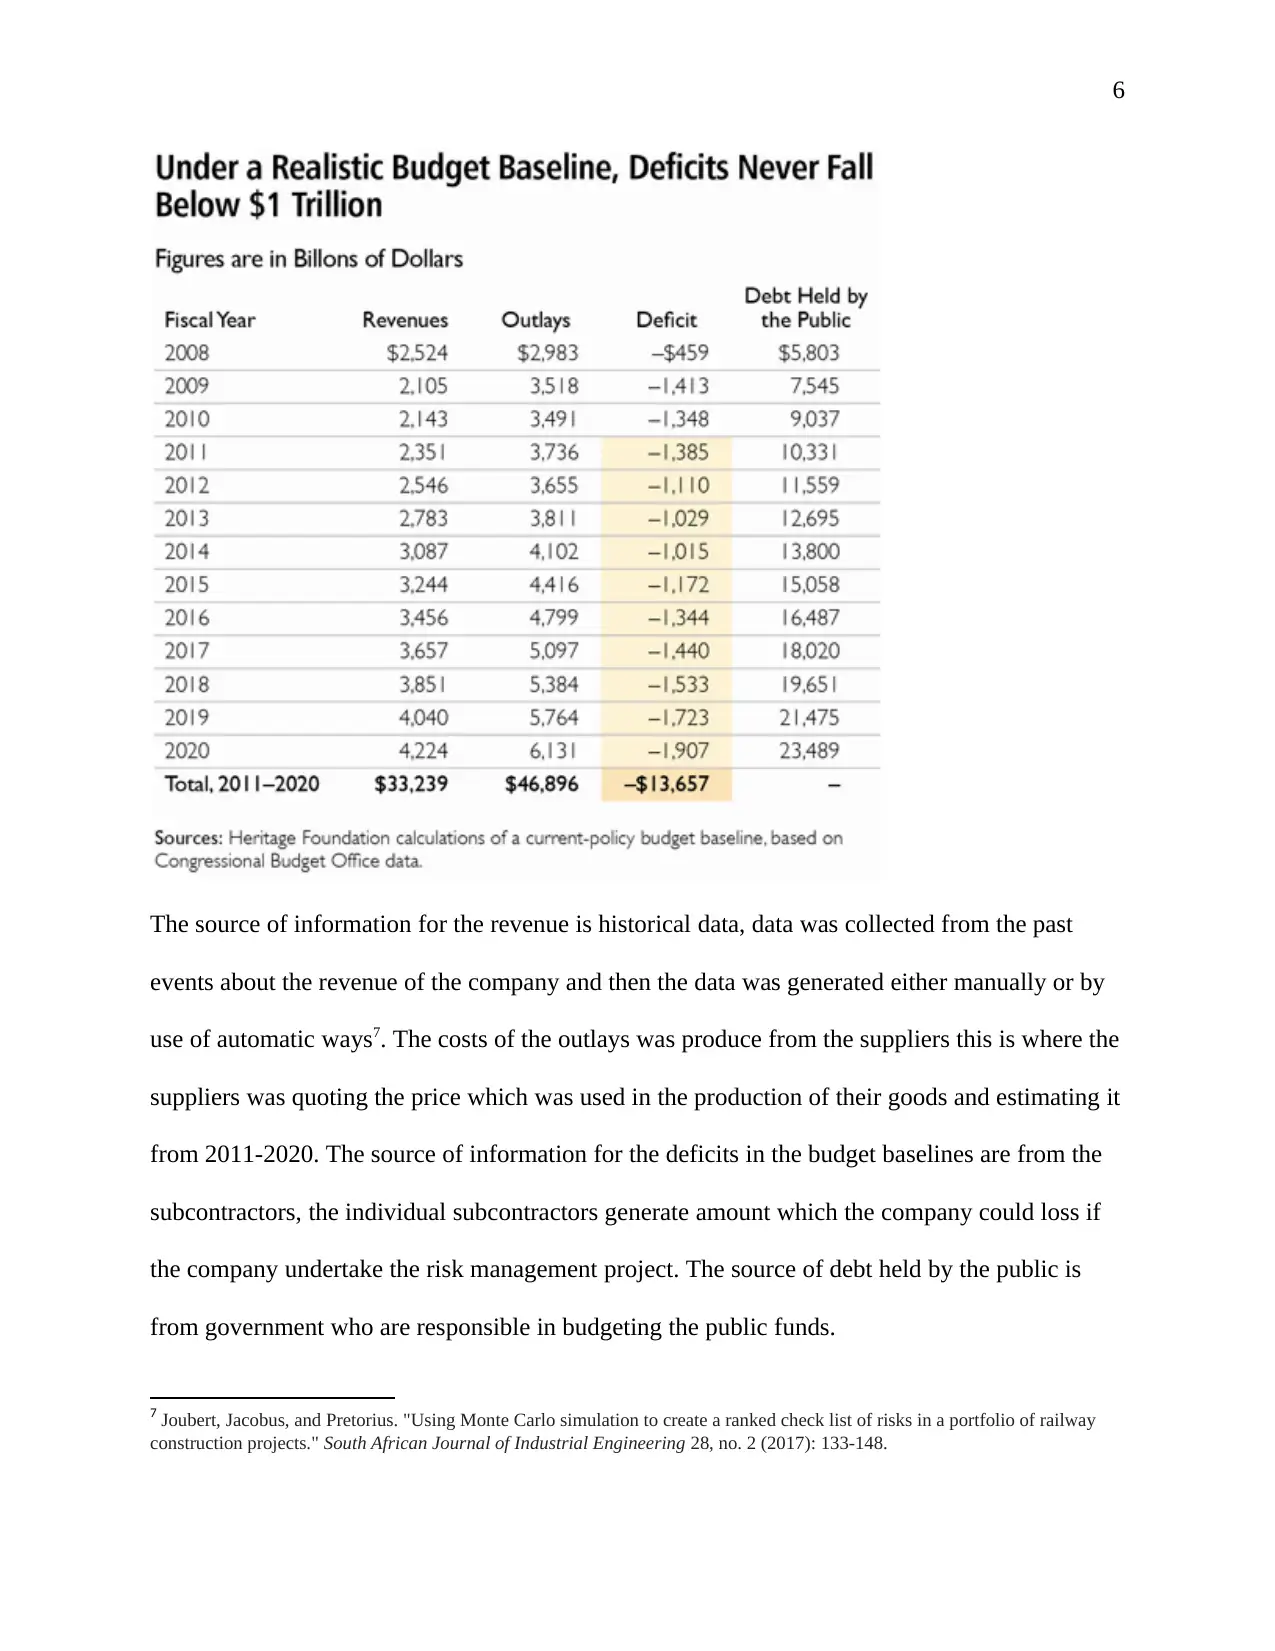
The source of information for the revenue is historical data, data was collected from the past
events about the revenue of the company and then the data was generated either manually or by
use of automatic ways7. The costs of the outlays was produce from the suppliers this is where the
suppliers was quoting the price which was used in the production of their goods and estimating it
from 2011-2020. The source of information for the deficits in the budget baselines are from the
subcontractors, the individual subcontractors generate amount which the company could loss if
the company undertake the risk management project. The source of debt held by the public is
from government who are responsible in budgeting the public funds.
7 Joubert, Jacobus, and Pretorius. "Using Monte Carlo simulation to create a ranked check list of risks in a portfolio of railway
construction projects." South African Journal of Industrial Engineering 28, no. 2 (2017): 133-148.
⊘ This is a preview!⊘
Do you want full access?
Subscribe today to unlock all pages.
Trusted by 1+ million students worldwide
7
MCS - Monte Carlo Simulation
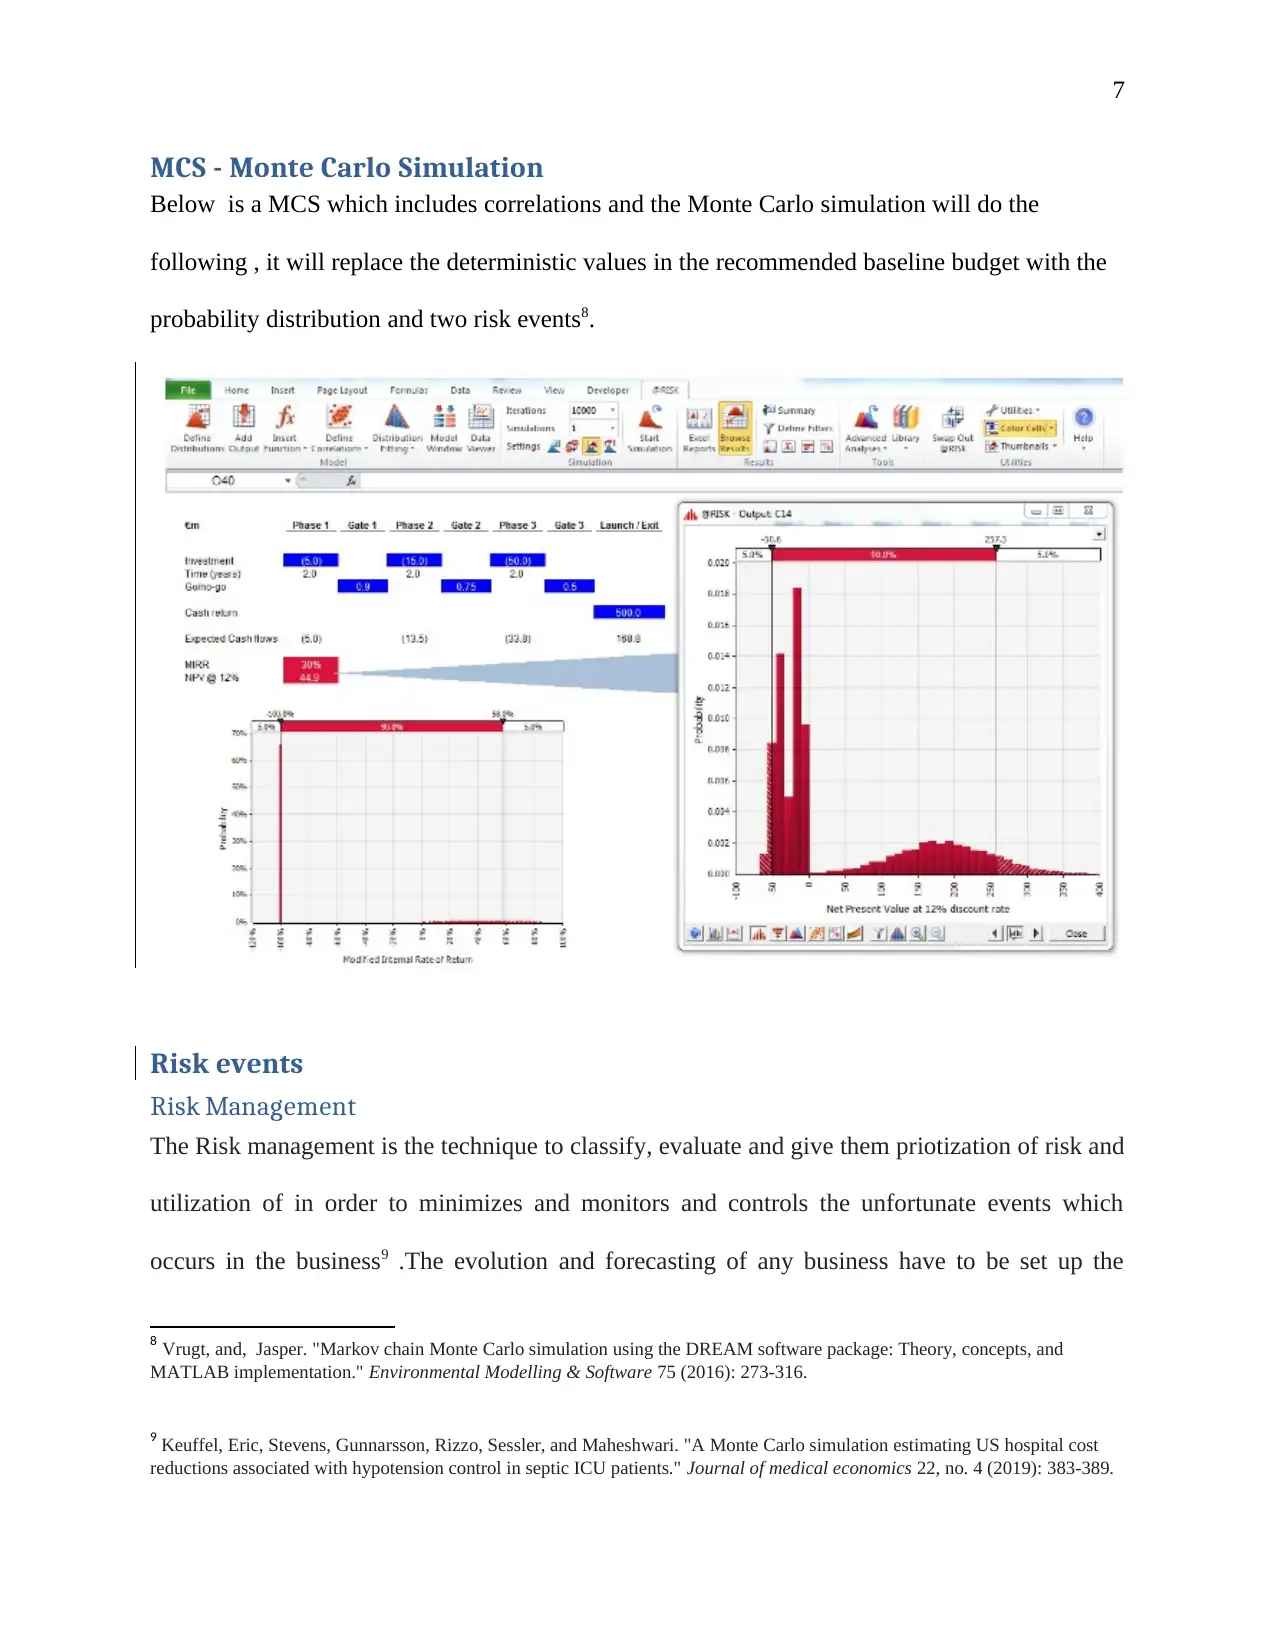
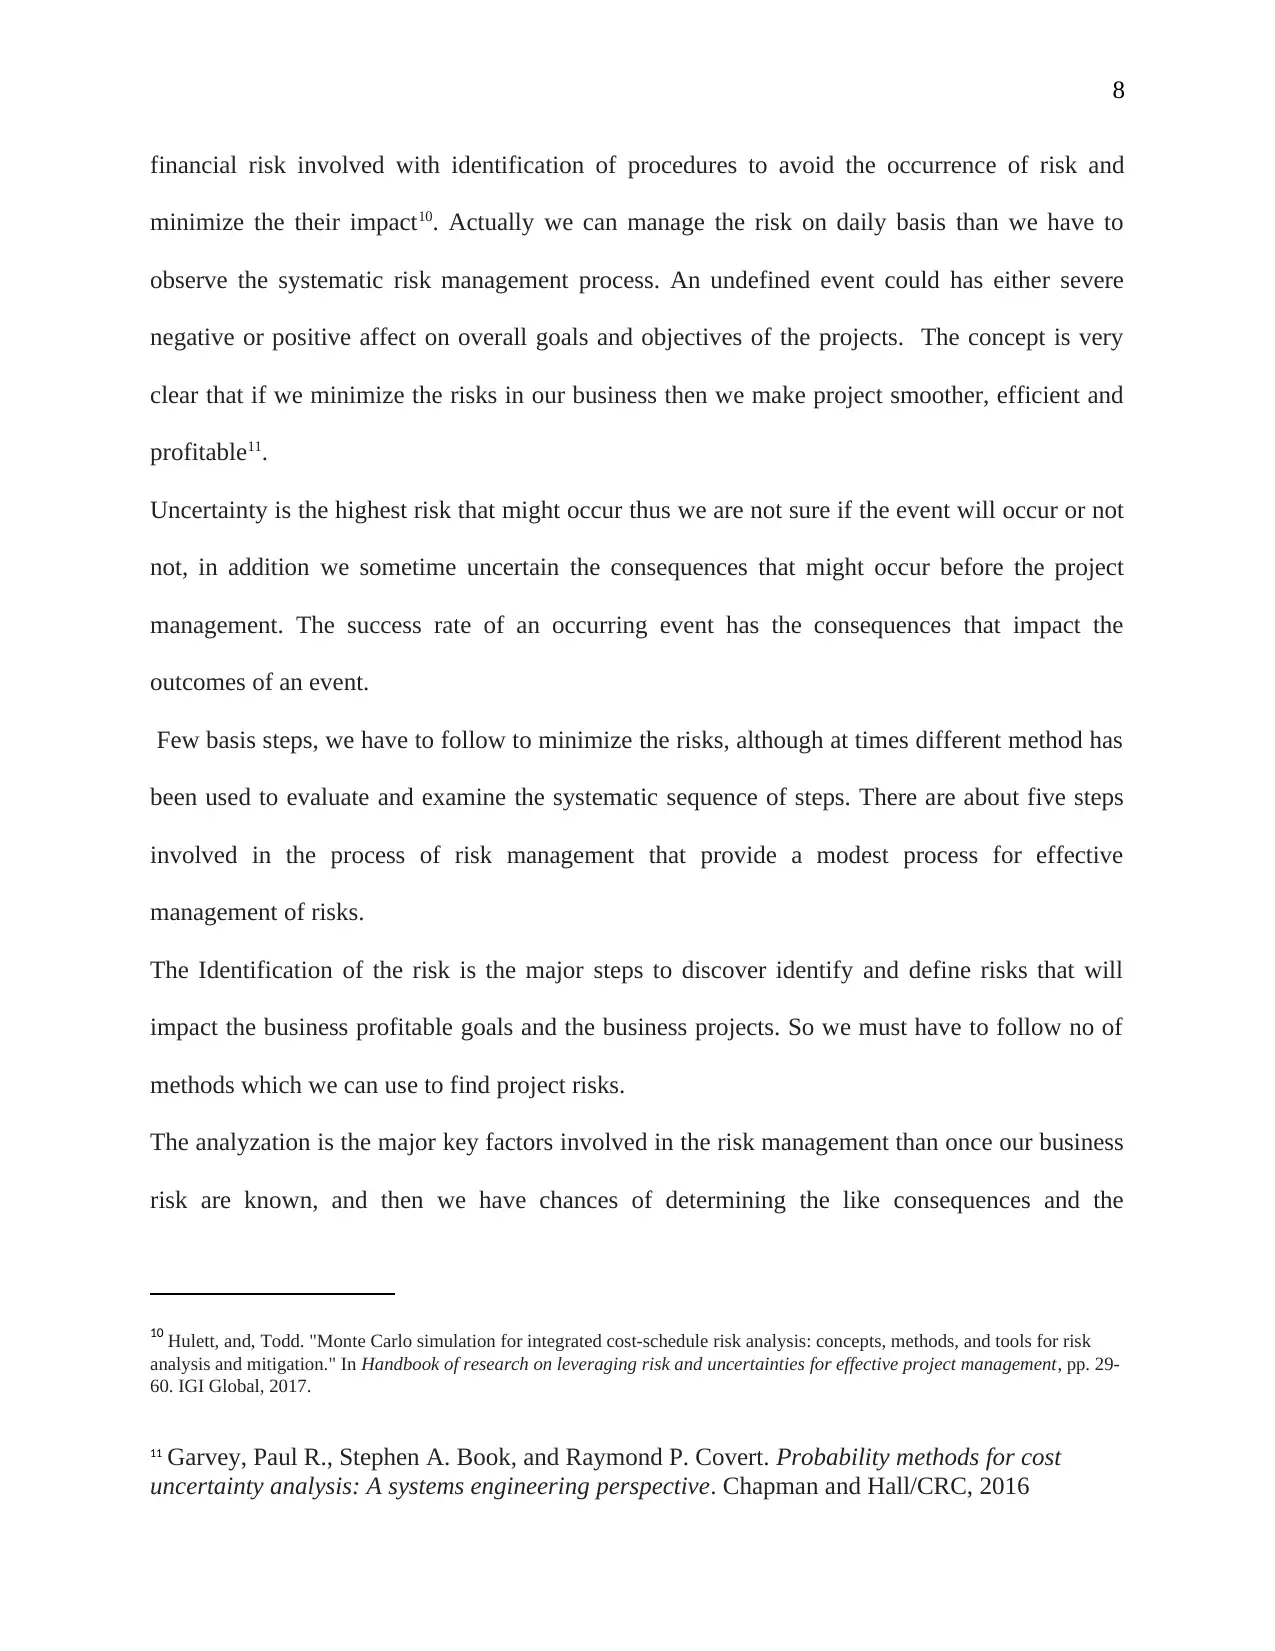
Below is a MCS which includes correlations and the Monte Carlo simulation will do the
following , it will replace the deterministic values in the recommended baseline budget with the
probability distribution and two risk events8.
Risk events
Risk Management
The Risk management is the technique to classify, evaluate and give them priotization of risk and
utilization of in order to minimizes and monitors and controls the unfortunate events which
occurs in the business9 .The evolution and forecasting of any business have to be set up the
8 Vrugt, and, Jasper. "Markov chain Monte Carlo simulation using the DREAM software package: Theory, concepts, and
MATLAB implementation." Environmental Modelling & Software 75 (2016): 273-316.
9 Keuffel, Eric, Stevens, Gunnarsson, Rizzo, Sessler, and Maheshwari. "A Monte Carlo simulation estimating US hospital cost
reductions associated with hypotension control in septic ICU patients." Journal of medical economics 22, no. 4 (2019): 383-389.
MCS - Monte Carlo Simulation
Below is a MCS which includes correlations and the Monte Carlo simulation will do the
following , it will replace the deterministic values in the recommended baseline budget with the
probability distribution and two risk events8.
Risk events
Risk Management
The Risk management is the technique to classify, evaluate and give them priotization of risk and
utilization of in order to minimizes and monitors and controls the unfortunate events which
occurs in the business9 .The evolution and forecasting of any business have to be set up the
8 Vrugt, and, Jasper. "Markov chain Monte Carlo simulation using the DREAM software package: Theory, concepts, and
MATLAB implementation." Environmental Modelling & Software 75 (2016): 273-316.
9 Keuffel, Eric, Stevens, Gunnarsson, Rizzo, Sessler, and Maheshwari. "A Monte Carlo simulation estimating US hospital cost
reductions associated with hypotension control in septic ICU patients." Journal of medical economics 22, no. 4 (2019): 383-389.
Paraphrase This Document
Need a fresh take? Get an instant paraphrase of this document with our AI Paraphraser
8
financial risk involved with identification of procedures to avoid the occurrence of risk and
minimize the their impact10. Actually we can manage the risk on daily basis than we have to
observe the systematic risk management process. An undefined event could has either severe
negative or positive affect on overall goals and objectives of the projects. The concept is very
clear that if we minimize the risks in our business then we make project smoother, efficient and
profitable11.
Uncertainty is the highest risk that might occur thus we are not sure if the event will occur or not
not, in addition we sometime uncertain the consequences that might occur before the project
management. The success rate of an occurring event has the consequences that impact the
outcomes of an event.
Few basis steps, we have to follow to minimize the risks, although at times different method has
been used to evaluate and examine the systematic sequence of steps. There are about five steps
involved in the process of risk management that provide a modest process for effective
management of risks.
The Identification of the risk is the major steps to discover identify and define risks that will
impact the business profitable goals and the business projects. So we must have to follow no of
methods which we can use to find project risks.
The analyzation is the major key factors involved in the risk management than once our business
risk are known, and then we have chances of determining the like consequences and the
10 Hulett, and, Todd. "Monte Carlo simulation for integrated cost-schedule risk analysis: concepts, methods, and tools for risk
analysis and mitigation." In Handbook of research on leveraging risk and uncertainties for effective project management, pp. 29-
60. IGI Global, 2017.
11 Garvey, Paul R., Stephen A. Book, and Raymond P. Covert. Probability methods for cost
uncertainty analysis: A systems engineering perspective. Chapman and Hall/CRC, 2016
9
likelihood of every risk in business12. There is a need to understand and depict the risk nature and
associated negative impacts on business outcomes as well and our objectives which were in our
mind from the stat of the business. The information must be kept in all the ongoing or future
projects13.
In each and every business or project, the evaluation of the is risk is at the top of the rank. The
project manager must evaluate or given higher rank to the identified risk with proper
examination of magnitude of the risk, that describe combination of both the probability of
occurrence and outcome results. It is major responsibility of the Project manager to come up
with the decision on whether to accept the risk or to warrant treatment due to the seriousness of
the risks.
The treatment of the risk depends upon the risk reaction planning ,while during this step the PM
diagnosis the highest level of risks and setup the project plan in order to modify and treat
identified risks for attaining acceptable risk steps that we must have to follow from the beginning
.At the point the question arises that how can the management minimize the likelihood of the
negative risk step identifications and then as well as improving the chances to construct risk
mitigation strategies and preventive both contingency plans at a given point .
The monitorization and review the risk aims to keep the uncertainty of the risk which is effective
for de-risk of the project. It means we can move with confidence in order to meet the goals of the
12 Pandey, Mahesh, Cheng, and Van der Weide. "Higher moments and probability distribution of maintenance cost in the delay
time model." Proceedings of the Institution of Mechanical Engineers, Part O: Journal of Risk and Reliability 230, no. 4 (2016):
354-363.
13 Sarkar, Biswajit, Chaudhuri, and Moon. "Manufacturing setup cost reduction and quality improvement for the distribution free
continuous-review inventory model with a service level constraint." Journal of Manufacturing Systems 34 (2015): 74-82.
⊘ This is a preview!⊘
Do you want full access?
Subscribe today to unlock all pages.
Trusted by 1+ million students worldwide
10
project through proper identification as well as management of risks, unsuitable barriers that
followed by the stockholder14.
The risk management process assists in resolving the problems when they exist in the project
because those problems have been canvassed at the initial of the project. Impulsive reactions
must be avoided for rectifying problems which will occurr in the business. Our outcomes are that
we reduce the effects of threats in the project and apprehend the opportunities.
The Finance risk management takes place all over the world. Risk management which is
inadequate can result into outcomes which are severe for the economy certainty of the individual
or the companies. At the corporate level when the investor buys the government bonds at the risk
as compared to when the fund manager agree on the exposure of the currency with the currency
derivatives and also when the bank froze company or personal account15.
The stockbrokers will utilizes the financial instruments and managers who are responsible money
will utilizes approaches such as investment diversification and portfolio to manage the risks. The
risk is a negative term, but in the investment term the risk related with performance and also it is
very necessary.
The risk investment is digression from a required outcome, so digression is the market
benchmark .It must be positive or negative so that higher returns can be achieve in the long run
than we have to accept the short risks in shape of wavering of market.
14 Dai, Jian, Yang, Guo, Jensen, and Hu. "Path cost distribution estimation using trajectory data." Proceedings of the VLDB
Endowment 10, no. 3 (2016): 85-96.
15 Damnjanovic, Ivan, and Reinschmidt. "Second Moment Approach for the Probability Distribution of Project Performance
Functions." In Data Analytics for Engineering and Construction Project Risk Management, pp. 45-64. Springer, Cham, 2020.
Paraphrase This Document
Need a fresh take? Get an instant paraphrase of this document with our AI Paraphraser
11
How much this wavering depends on the tolerance of risk which describes the capacity of
volatility based on specific financial surroundings taking into account with uncertainty and the
likelihood of losses incurring.
The measurement of the investors risk comes in variety of techniques to ascertain the risk. Then
we study most commonly techniques are standard deviation and second is dispersion. The
stockholders aspects on the average return of the investment and then calculate the standard
deviation of similar period of time. If they believe they can tolerate the risk, financially then
proceed to invest in the market.
The Psychology of the risk management concern not fully address on investors risk so we have
to study the behavioral finances which underwrote an vital component to risk calculation,
validating to the people on how investors gains and losses. This is the right of the inventors to
know about how much an asset deviated from its expected outcomes. Here most important is
VAT value at risk which show us the path16.
The Beta and passive risk management is another risk measurement which states the period in
which the assets is in the negative level as compared to the time of solving the problem by taking
the three measures. The magnitude of each negative period, the duration of the each, and final is
frequency. The Beta known as market risk. The Beta assists us to recognize the passive and
active risk concepts, so the active risk is alpha and passive risk denotes to Beta.
The active managers keep an eye to hunt for an alpha, the measures of excess returns then
systematic risk is only the influencing factor.
16 Flores, Ana, Tierney, and Watt. "Where Mind Connects With Matter: Replicating the Correlation Matrix Method2." The
Journal of Parapsychology 82, no. 2 (2018): 107-108.
12
If unexpected economic situations developed in the county cause’s energy stocks to decline then
this is the time to decide by the manager, example of alpha risk occurs in serious conditions.
The cost of risk is to succeed incurring losses as well as risks, however, the overall risk
management cost is the overall addition of of all sides of company’s business processes
associated with the unwanted risk that include administrative expenses, transfer expenses, risk
control expenses, loss adjustment costs and retained losses as well that come in and out of the
company17 .
The most significant component of any risk management program is the controlling of the cost.
The company risk management process will place the owners in control of the insurance
program. So further we discuss that how we minimize risks by using unique services.
The risk management minimizes by reducing Insurance, taxes, premiums and fees, direct and
indirect loss cost includes deductibles and uncovered losses, administrative expenses and
services and risk control expenses.
The digital risk is too much involved nowadays in business transactions interconnected to supply
chain ,customers ,and partners then the assets that security teams have been trying to protect
become expose. If we want to manage these digital risks, we need to start looking outside the
traditional perimeters than we have to study the social media, file sharing ,shadow IT, file
storage ,forums and code sharing sites.
The major issues comes in digital risk is data loss detection in which attackers can leverage
exposed leaked or loss of sensitive codes which exploit our organization targeted by the cyber-
attacks.
17 Arbey, Alexandre, Fichet, Mahmoudi, and Moreau. "The correlation matrix of Higgs rates at the LHC." Journal of High
Energy Physics 2016, no. 11 (2016): 97.
⊘ This is a preview!⊘
Do you want full access?
Subscribe today to unlock all pages.
Trusted by 1+ million students worldwide
1 out of 21
Related Documents


Your All-in-One AI-Powered Toolkit for Academic Success.
+13062052269
info@desklib.com
Available 24*7 on WhatsApp / Email
![[object Object]](/_next/static/media/star-bottom.7253800d.svg)
Unlock your academic potential
Copyright © 2020–2026 A2Z Services. All Rights Reserved. Developed and managed by ZUCOL.