Risk Management Technique for Investors at DBS Bank: Analysis
VerifiedAdded on 2023/04/23
|31
|7638
|204
Report
AI Summary
This report delves into the risk management techniques employed by investors at DBS Bank in Singapore, examining how these strategies mitigate potential risks. It begins with an introduction to risk management in the banking sector, highlighting its significance in today's dynamic business environment. The report provides background information on DBS Bank and its risk management approach, including the use of the Value at Risk (VaR) model. It explores the rationale behind studying investor risk management, emphasizing the importance of balancing risk and return. The research aims to identify suitable risk management techniques for DBS Bank investors, focusing on the appropriateness of the CAPM and VaR models. Through a literature review, the report discusses the concepts of uncertainty and risk, and outlines the risk management process. The report further discusses the capital asset pricing model (CAPM) provides an initial framework for assessing the relationship between expected return and risk of an investment.
Running head: RISK MANAGEMENT TECHNIQUE FOR INVESTORS AT DBS BANK
Risk management technique for investors at DBS bank
Name of the Student
Name of the University
Author Note
Risk management technique for investors at DBS bank
Name of the Student
Name of the University
Author Note
Paraphrase This Document
Need a fresh take? Get an instant paraphrase of this document with our AI Paraphraser
1
RISK MANAGEMENT TECHNIQUE FOR INVESTORS AT DBS BANK
Table of Contents
Chapter 1: Introduction:.............................................................................................................2
1.1 Introduction..........................................................................................................................2
1.2 Background of the study......................................................................................................2
1.3 Background of company......................................................................................................3
1.4 Rationale of study................................................................................................................3
1.5 Research aim........................................................................................................................4
1.6 Research objective...............................................................................................................4
1.7 Research questions...............................................................................................................4
1.8 Structure of study.................................................................................................................4
1.9 Conclusion............................................................................................................................5
Chapter 2: Literature review......................................................................................................5
2.1 Introduction..........................................................................................................................5
2.2 Uncertainty and risk.............................................................................................................6
2.3 The process of risk management..........................................................................................6
2.4 Summary............................................................................................................................13
Chapter 3: Research methodology...........................................................................................14
3.1 Introduction........................................................................................................................14
3.2 Research approach.............................................................................................................14
3.3 Justification of research approach......................................................................................14
3.4 Research design..................................................................................................................14
3.5 Justification of research design..........................................................................................15
2
RISK MANAGEMENT TECHNIQUE FOR INVESTORS AT DBS BANK
3.6 Sampling strategy:..............................................................................................................15
3.8 Instruments of collecting data............................................................................................15
3.9 Procedure of collecting data...............................................................................................15
3.10 Gantt chart........................................................................................................................16
3.11 Ethical considerations......................................................................................................16
3.12 Data analysis....................................................................................................................17
Chapter 4: Discussion, Evidence and analysis.........................................................................17
4.1 Introduction........................................................................................................................17
4.2 Presentation of data............................................................................................................18
4.3 Analysis of data..................................................................................................................19
4.4 Limitations of proposed study............................................................................................20
4.5 Dissemination.....................................................................................................................20
Chapter 5: Conclusion and Recommendation..........................................................................21
5.1 Conclusion and Findings....................................................................................................21
5.2 Scope for future study........................................................................................................21
Reference list:...........................................................................................................................23
Appendix:.................................................................................................................................28
Chapter 1: Introduction:
⊘ This is a preview!⊘
Do you want full access?
Subscribe today to unlock all pages.
Trusted by 1+ million students worldwide
3
RISK MANAGEMENT TECHNIQUE FOR INVESTORS AT DBS BANK
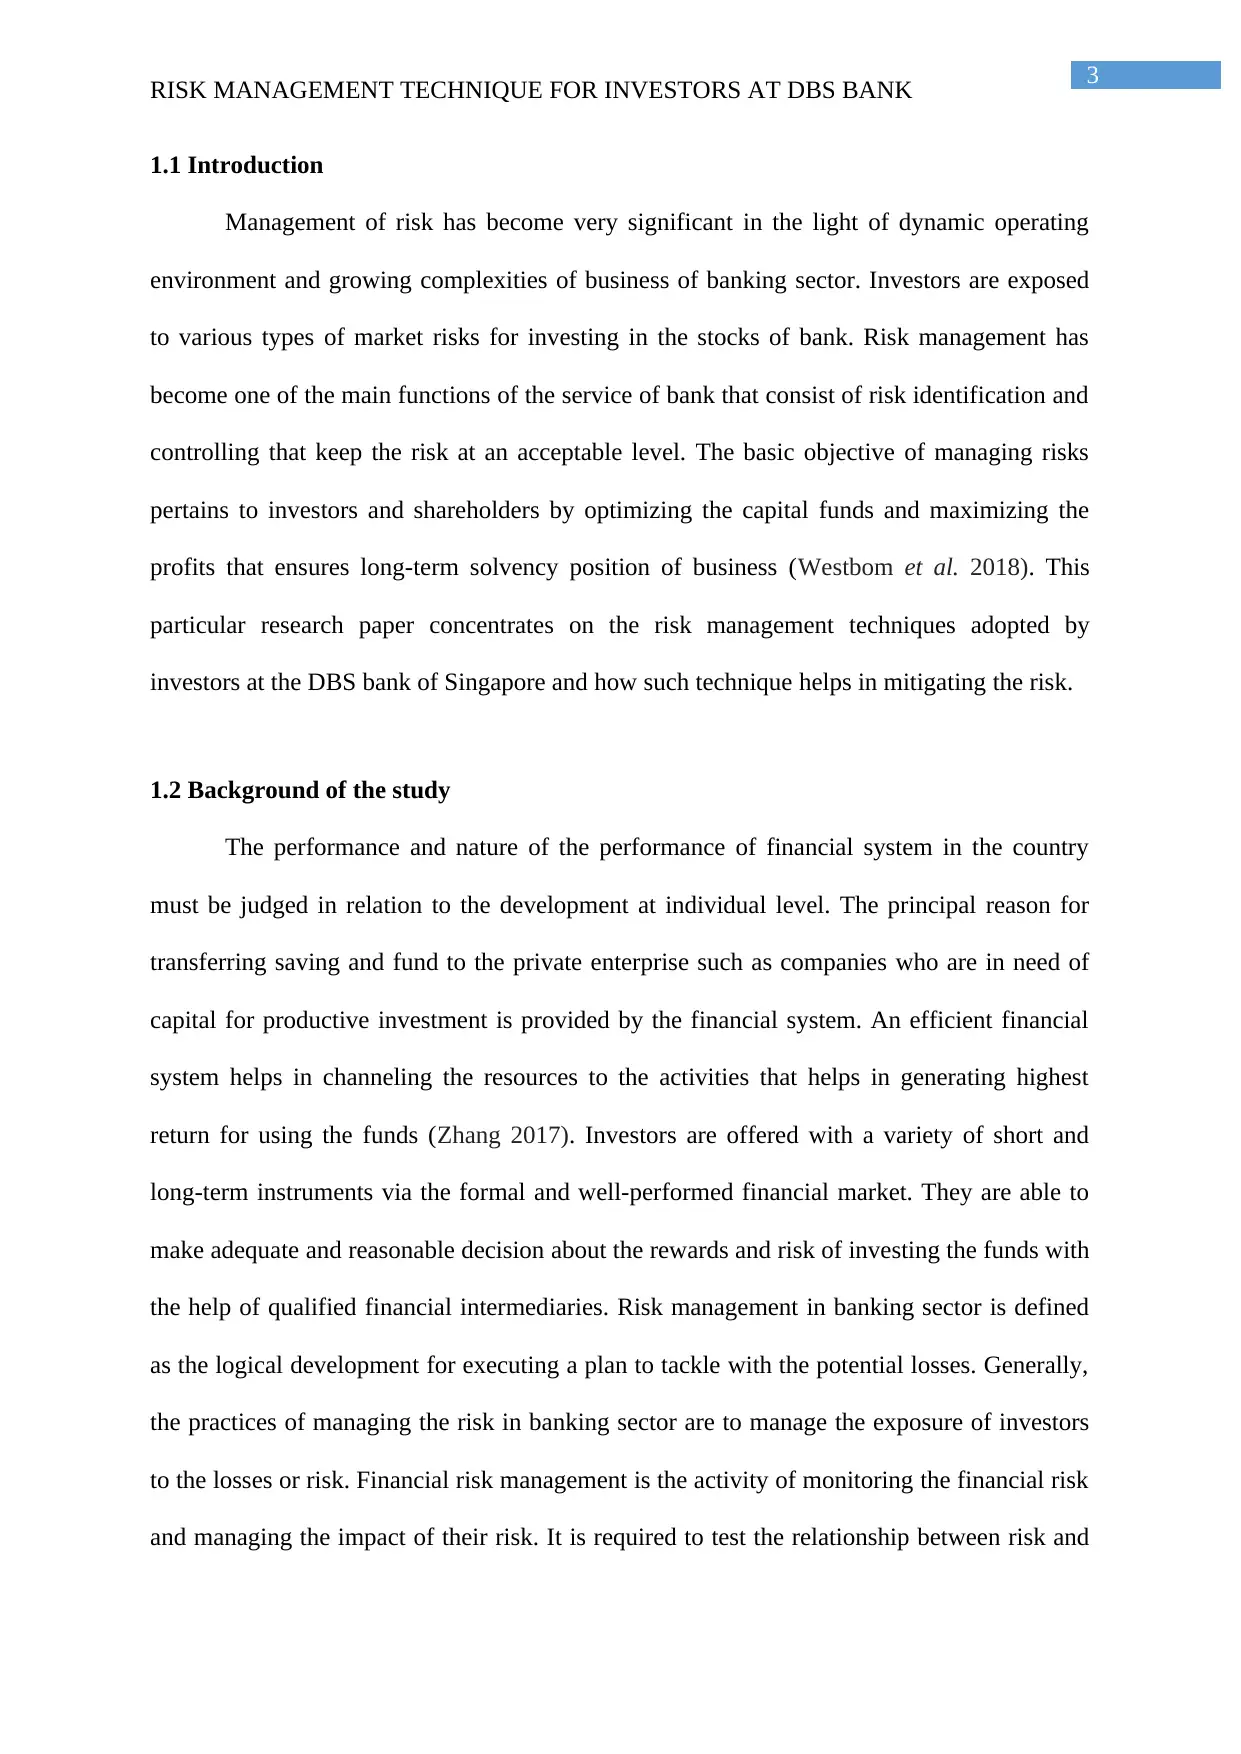
1.1 Introduction
Management of risk has become very significant in the light of dynamic operating
environment and growing complexities of business of banking sector. Investors are exposed
to various types of market risks for investing in the stocks of bank. Risk management has
become one of the main functions of the service of bank that consist of risk identification and
controlling that keep the risk at an acceptable level. The basic objective of managing risks
pertains to investors and shareholders by optimizing the capital funds and maximizing the
profits that ensures long-term solvency position of business (Westbom et al. 2018). This
particular research paper concentrates on the risk management techniques adopted by
investors at the DBS bank of Singapore and how such technique helps in mitigating the risk.
1.2 Background of the study
The performance and nature of the performance of financial system in the country
must be judged in relation to the development at individual level. The principal reason for
transferring saving and fund to the private enterprise such as companies who are in need of
capital for productive investment is provided by the financial system. An efficient financial
system helps in channeling the resources to the activities that helps in generating highest
return for using the funds (Zhang 2017). Investors are offered with a variety of short and
long-term instruments via the formal and well-performed financial market. They are able to
make adequate and reasonable decision about the rewards and risk of investing the funds with
the help of qualified financial intermediaries. Risk management in banking sector is defined
as the logical development for executing a plan to tackle with the potential losses. Generally,
the practices of managing the risk in banking sector are to manage the exposure of investors
to the losses or risk. Financial risk management is the activity of monitoring the financial risk
and managing the impact of their risk. It is required to test the relationship between risk and
RISK MANAGEMENT TECHNIQUE FOR INVESTORS AT DBS BANK
1.1 Introduction
Management of risk has become very significant in the light of dynamic operating
environment and growing complexities of business of banking sector. Investors are exposed
to various types of market risks for investing in the stocks of bank. Risk management has
become one of the main functions of the service of bank that consist of risk identification and
controlling that keep the risk at an acceptable level. The basic objective of managing risks
pertains to investors and shareholders by optimizing the capital funds and maximizing the
profits that ensures long-term solvency position of business (Westbom et al. 2018). This
particular research paper concentrates on the risk management techniques adopted by
investors at the DBS bank of Singapore and how such technique helps in mitigating the risk.
1.2 Background of the study
The performance and nature of the performance of financial system in the country
must be judged in relation to the development at individual level. The principal reason for
transferring saving and fund to the private enterprise such as companies who are in need of
capital for productive investment is provided by the financial system. An efficient financial
system helps in channeling the resources to the activities that helps in generating highest
return for using the funds (Zhang 2017). Investors are offered with a variety of short and
long-term instruments via the formal and well-performed financial market. They are able to
make adequate and reasonable decision about the rewards and risk of investing the funds with
the help of qualified financial intermediaries. Risk management in banking sector is defined
as the logical development for executing a plan to tackle with the potential losses. Generally,
the practices of managing the risk in banking sector are to manage the exposure of investors
to the losses or risk. Financial risk management is the activity of monitoring the financial risk
and managing the impact of their risk. It is required to test the relationship between risk and
Paraphrase This Document
Need a fresh take? Get an instant paraphrase of this document with our AI Paraphraser
4
RISK MANAGEMENT TECHNIQUE FOR INVESTORS AT DBS BANK
return and analyze the inter dependency and correlation between such variables (Mensah and
Premaratne 2017).
1.3 Background of company
DBS bank is a leading financial and banking services corporation headquartered in
Singapore that was earlier known as development bank of Singapore Limited. The
organization is well placed as partner to capture the opportunities across the region. Since the
focus of bank is on the market of Asia, the organization is exposed to risks concentration
within the region. Risks at DBS are effectively assessed by relying on specialist knowledge
of industry segments and regional markets. The approach to risk management at DBS
comprises of three building blocks including policies, risk methodologies and system, process
and report (Dbs.com 2019). The risk methodology used by the bank is VaR (Value at risk)
Model that helps in computation of potential losses of risk position due to movement of
movement of market in accordance with given level of confidence over a specified time
horizon. It is a model used by the bank, which is based on historical simulation with a
holding period of one day. The exposure to market risk is limited and monitored by using an
average of potential loss beyond a given level of confidence. The predictiveness of the VaR
model is verified by conducting the back testing with makes a comparison between the
positions at the close of each day with profit and loss arising from position of the next
business day (Dbs.com 2019).
1.4 Rationale of study
It is essential for investors to evaluate the risks associated with their investment to
create relationship between return and risk. Undertaking this research paper helps in ensuring
that there is sufficient basis of analysis for ensuring that loss generated from investment does
not exceed the acceptable boundaries. In addition to this, the importance of model of risk
5
RISK MANAGEMENT TECHNIQUE FOR INVESTORS AT DBS BANK
management as a tool of mitigating risk is essential for the purpose of investment. In order
for investors to have best portfolio of investment, it is essential to evaluate the risks
pertaining to their overall investment.
1.5 Research aim
The aim of research is to identify suitable technique for management of risk for the
investors of DBS bank.
1.6 Research objective
The objective of research is to identify the most appropriate technique of managing
risks associated with investment for investors of DBS bank. In addition to this, the research
paper also intends to evaluate the appropriateness and measures of risk management
technique for investors using the model of CAPM and VaR.
1.7 Research questions
How the application of CAPM determines the effectiveness of risk management at
DBS bank?
What is the impact of risk management technique of VaR on investors?
1.8 Structure of study
For gaining a better understanding of the overall research study, the whole research
paper is divided into several chapters that are segregated further.
⊘ This is a preview!⊘
Do you want full access?
Subscribe today to unlock all pages.
Trusted by 1+ million students worldwide
6
RISK MANAGEMENT TECHNIQUE FOR INVESTORS AT DBS BANK
1.9 Conclusion
The first chapter presented an introductory approach to the research paper by
outlining the objectives and aims of research. This also includes a brief introduction on the
company selected and the risk methodology used by company for managing the risk.
Researcher has also provided rationale for conducting this research paper.
Chapter 2: Literature review
2.1 Introduction
This chapter deals with the in depth study of several theories and model used by
investors related to risk management. It sets out the conceptual framework and determines the
relationship between risk and uncertainty of investment. Literature review also provides
theoretical framework on the models of risk management. This section also outlines the
importance and theories associated with model of VaR and CAPM.
Chapter1IntroductionChapter2LiteraturereviewChapter3ResearchMethodologyChapter4Chapter5ConclusionandRecommendations
Paraphrase This Document
Need a fresh take? Get an instant paraphrase of this document with our AI Paraphraser
7
RISK MANAGEMENT TECHNIQUE FOR INVESTORS AT DBS BANK
2.2 Uncertainty and risk
Risk can be defined in number of ways and the term risk and uncertainty are the two
common techniques in the risk management literature. Uncertainty is the occurrence and non-
occurrence of outcome because the probability of their occurrence is not known. Uncertainty
is related with the imperfect information and poor knowledge whereas risk is attributable to
situations with well-defined boundaries and considerable data (Abdoh and Varela 2018). The
difference between uncertainty and risks is widely acknowledged in the literature and these
terms are used interchangeably. For the purpose of review, the focus is on the management of
risk by investors at DBS bank.
2.3 The process of risk management
There are several definitions of risk management in literature and it is defined as a
systematic approach that helps in setting the best course of action under uncertainty situations
by the assessment, identification, understanding, communication and acting on risky issues.
Management of risk is a disciplined and structured approach that has purpose of managing
and evaluating the uncertainties faced by aligning the process, technology, strategy and
knowledge of organization. Process of risk management include all the process and
regulations of organization for the assessment, identification, control and analysis of the
potential risk along with supervision of efficiency and profitability of the measures that have
been taken. There are two approaches to the analysis of risk, which include qualitative and
quantitative analysis.
A considerable portion of research in investment management is devoted to
understand how the investors evaluate the riskiness of return and securities are associated
with risks. The discipline of finance has developed much theory about the management of
risk and its usefulness in assessing return. The capital asset pricing model (CAPM) provides
8
RISK MANAGEMENT TECHNIQUE FOR INVESTORS AT DBS BANK
an initial framework for assessing the relationship between expected return and risk of an
investment. This particular model is widely used in the application for evaluating the
performance of managed portfolios and estimating the cost of capital for firms. The tradeoff
between the risks and return generated by the assets is well explained the CAPM because the
risk of an asset is measured as the covariance of the return of one assets with the overall
market return. The model is based on the prediction that there is a linear relation between the
expected return of any two assets and the covariance of the return of the assets with the return
generated on the market portfolio. There are two types of risks associated with each assets
and such risk include diversifiable risk and non-diversifiable risk.
The reason why CAPM is attractive amongst investors is that it offers intuitively
appealing and powerful predictions regarding the measurement of the relationship between
the expected return and risk and measurement of risk alone. It ideally depicts how the price of
securities are set by the financial market and ultimately determining the return on the capital
investment. The model provides a methodology for quantification of risk and translation of
such risk into expected return on equity (Sutrisno and Nasri 2018). In an attempt to develop,
financial managers mostly use the usefulness of computation of cost of equity and for
supplementing their own techniques and judgment, such model. However, the application of
the model continues to generate, but now it is rather applied as the course to manage
investment.
The portfolio model on the assets that is weighed in the mean variance portfolios
provides an algebraic condition. The algebraic declaration is transformed by the CAPM
model into a testable declaration and between the relationship between expected return and
risk by identifying efficient portfolios. CAPM relies on the theoretical market portfolio that
comprise of all assets such as foreign stocks and real estate. CAPM is tested and analyzed
⊘ This is a preview!⊘
Do you want full access?
Subscribe today to unlock all pages.
Trusted by 1+ million students worldwide
9
RISK MANAGEMENT TECHNIQUE FOR INVESTORS AT DBS BANK
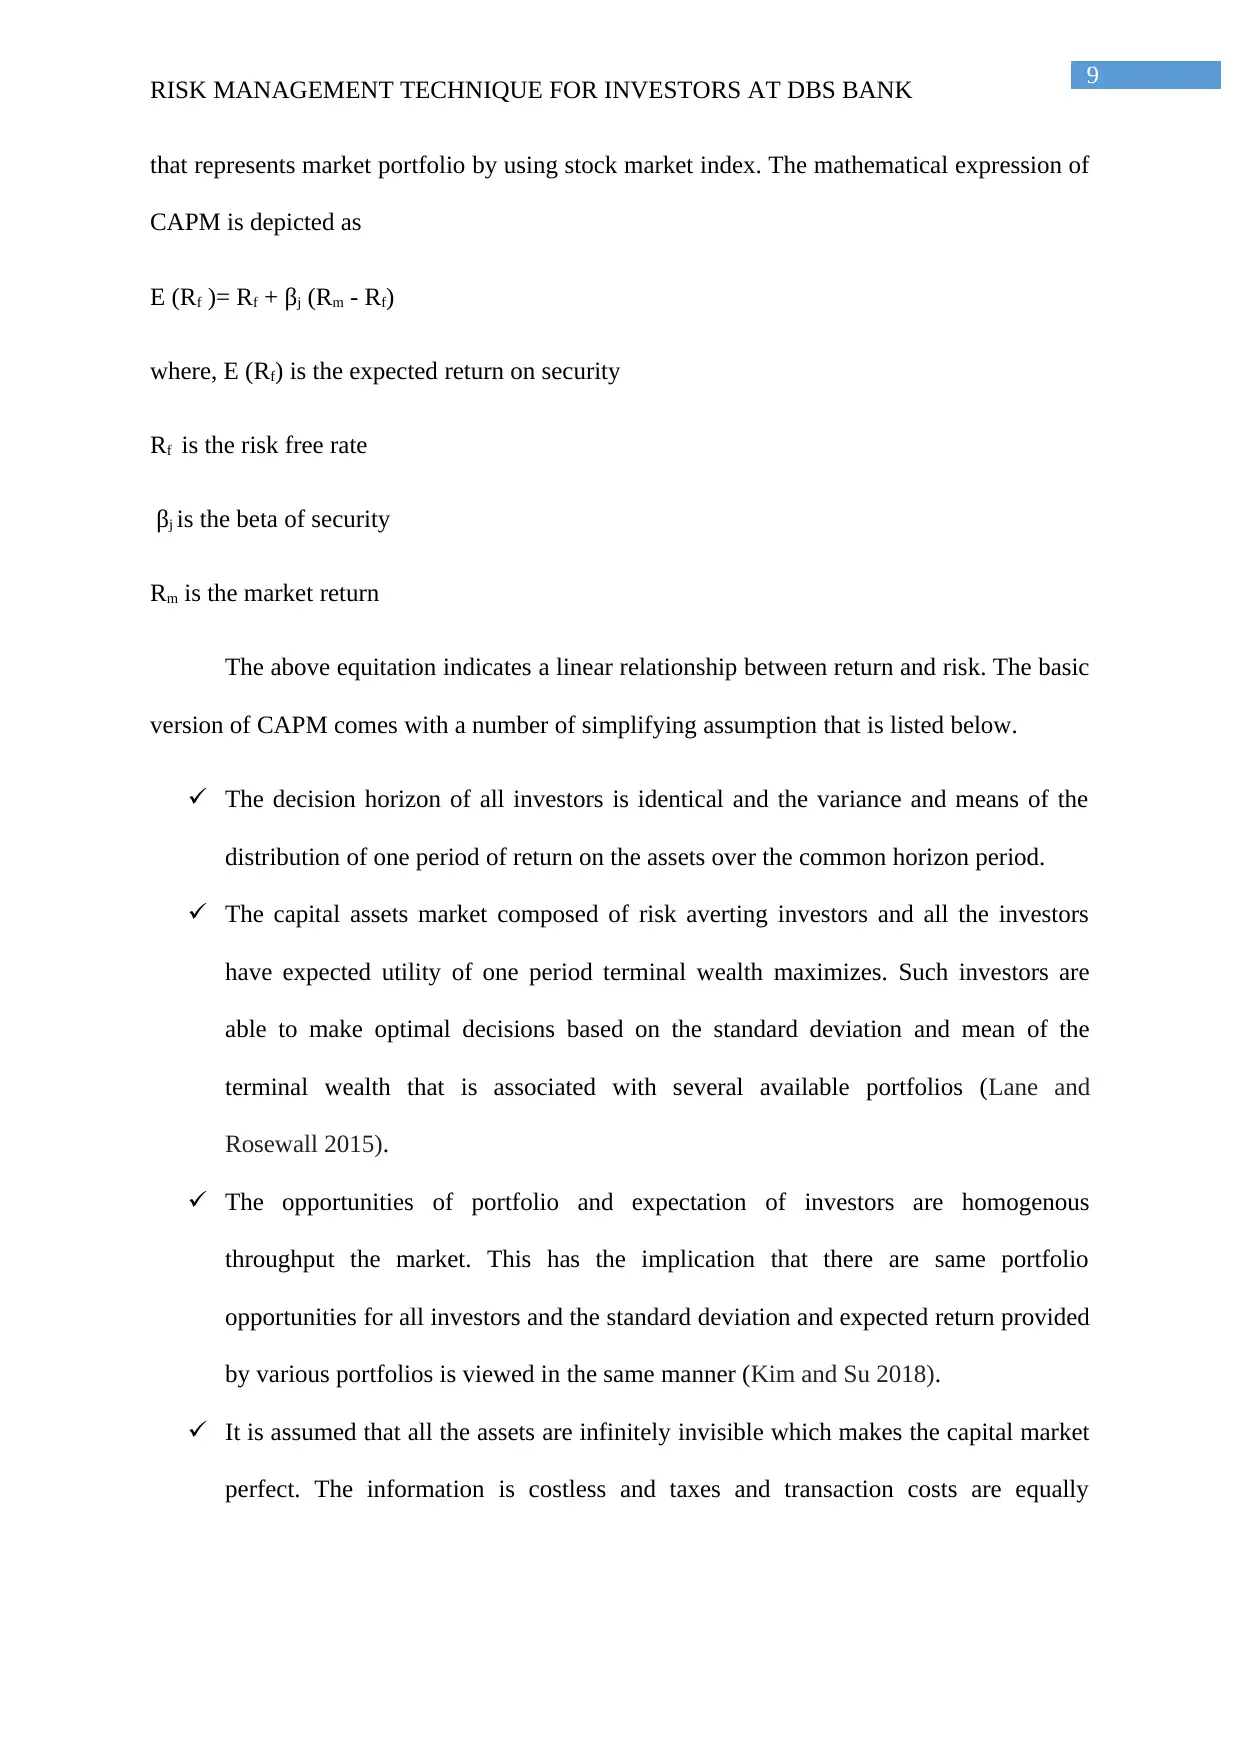
that represents market portfolio by using stock market index. The mathematical expression of
CAPM is depicted as
E (Rf )= Rf + βj (Rm - Rf)
where, E (Rf) is the expected return on security
Rf is the risk free rate
βj is the beta of security
Rm is the market return
The above equitation indicates a linear relationship between return and risk. The basic
version of CAPM comes with a number of simplifying assumption that is listed below.
The decision horizon of all investors is identical and the variance and means of the
distribution of one period of return on the assets over the common horizon period.
The capital assets market composed of risk averting investors and all the investors
have expected utility of one period terminal wealth maximizes. Such investors are
able to make optimal decisions based on the standard deviation and mean of the
terminal wealth that is associated with several available portfolios (Lane and
Rosewall 2015).
The opportunities of portfolio and expectation of investors are homogenous
throughput the market. This has the implication that there are same portfolio
opportunities for all investors and the standard deviation and expected return provided
by various portfolios is viewed in the same manner (Kim and Su 2018).
It is assumed that all the assets are infinitely invisible which makes the capital market
perfect. The information is costless and taxes and transaction costs are equally
RISK MANAGEMENT TECHNIQUE FOR INVESTORS AT DBS BANK
that represents market portfolio by using stock market index. The mathematical expression of
CAPM is depicted as
E (Rf )= Rf + βj (Rm - Rf)
where, E (Rf) is the expected return on security
Rf is the risk free rate
βj is the beta of security
Rm is the market return
The above equitation indicates a linear relationship between return and risk. The basic
version of CAPM comes with a number of simplifying assumption that is listed below.
The decision horizon of all investors is identical and the variance and means of the
distribution of one period of return on the assets over the common horizon period.
The capital assets market composed of risk averting investors and all the investors
have expected utility of one period terminal wealth maximizes. Such investors are
able to make optimal decisions based on the standard deviation and mean of the
terminal wealth that is associated with several available portfolios (Lane and
Rosewall 2015).
The opportunities of portfolio and expectation of investors are homogenous
throughput the market. This has the implication that there are same portfolio
opportunities for all investors and the standard deviation and expected return provided
by various portfolios is viewed in the same manner (Kim and Su 2018).
It is assumed that all the assets are infinitely invisible which makes the capital market
perfect. The information is costless and taxes and transaction costs are equally
Paraphrase This Document
Need a fresh take? Get an instant paraphrase of this document with our AI Paraphraser
10
RISK MANAGEMENT TECHNIQUE FOR INVESTORS AT DBS BANK
available for everyone. In addition to this, all the investors are offered with same
lending and borrowing rate.
While making investment portfolios, liquidity is regarded as the driver in influencing
the price of stocks. It was founded by the study that the data is explained in a better manner
with the help of liquidity adjusted CAPM as against the standard CAPM. Furthermore, it was
evident that there is weaker influence of the level of liquidity and importance of liquidity risk
over market risk. The pricing of liquidity risk in the Australian market was analyzed using the
data exploring the impact of several measures of liquidity risk on the stock return using the
CAPM model that is liquidity adjusted (Grace et al. 2015). The study strongly evident the co
movement between market illiquidity and stock return, market illiquidity and market return,
market illiquidity and individual stock illiquidity.
Many scholars have studies the capital asset pricing model and have came out with
different and mixed results. One of the studies conducted on the Greek stock market came
with findings that did not support the basic statement of the model that is the validity of high
return and high risk was proved wrong. For some years, the findings generated better results
but the model was not supported overall. Another study conducted on the model identified
that the exact return generated by the assets could not be explained using the CAPM. The
return was significantly negative that arises as a result of instability and it is a known fact that
the returns of stock is influenced the instability of market (Ajibola et al. 2015). However, the
time series of stock return is forecasted by the instability of the stock.
The association between the beta coefficient and the signs of market return and the
beta coefficient is studies by one author for the stocks listed on one of the stock exchanges.
CAPM was viewed as the additional return on the portfolio of market. It was also determined
11
RISK MANAGEMENT TECHNIQUE FOR INVESTORS AT DBS BANK
that the cross sectional difference of additional expected returns on the stocks is seen as a
measure of risk of assets and is totally captured by the value of beta (Cornell et al. 2017).
It is believed that using the CAPM intends to satisfy the investors in two ways that is
in terms of risk associated with the security and for the time value of money. The risk free
rate is denotation of the fact that the investors are compensated for investing the money over
a period of time. For the additional risk undertaken by the investors, they are provided with
the risk premium for comportment. The validity of the model has been tested by conducting a
number of studies and the model has not always been supported by the result (Magnani and
Zucchella 2018). It was founded by one of the empirical studies that the model results in
moderating the statistical problems arising from the measurement errors in the estimates of
beta. In addition to this, it was also ascertained by the author that the relation between beta
and average return is very close to the linear and any portfolio have higher (lower) returns
having (higher) lower value of betas (Alshomaly et al. 2018). It was forecasted using the
model that there is linear relationship between the expected return on assets above the risk
free rate and non-diversifiable risk that is measured by the beta value of security.
Some of the empirical evidence supported that there exists linear and positive
relationship between the risk and expected return. It was found that the concept of CAPM is
valid and both the return and risk are integrated into the market. Research conducted on some
of other stock exchange such as Athens stock exchange that the volatility is positively related
to return as indicated by significant and positive risk premium. In one of the study that was
conducted on eight Taiwanese industries discovered that there is a mix influence of returns of
stock due to conditional volatility (Iosrjournals.org 2019). Nevertheless, it was found that
only the coefficient with negative returns are significant and such negative risk premium is
suggestive of the fact that for holding risky stocks investors are penalized. It is indicated by
most of the researches on the stock market that they have the characteristics of higher return
⊘ This is a preview!⊘
Do you want full access?
Subscribe today to unlock all pages.
Trusted by 1+ million students worldwide
1 out of 31
Related Documents


Your All-in-One AI-Powered Toolkit for Academic Success.
+13062052269
info@desklib.com
Available 24*7 on WhatsApp / Email
![[object Object]](/_next/static/media/star-bottom.7253800d.svg)
Unlock your academic potential
Copyright © 2020–2026 A2Z Services. All Rights Reserved. Developed and managed by ZUCOL.