University Finance Module: Risk Management Techniques Portfolio Report
VerifiedAdded on 2021/12/21
|11
|1363
|25
Report
AI Summary
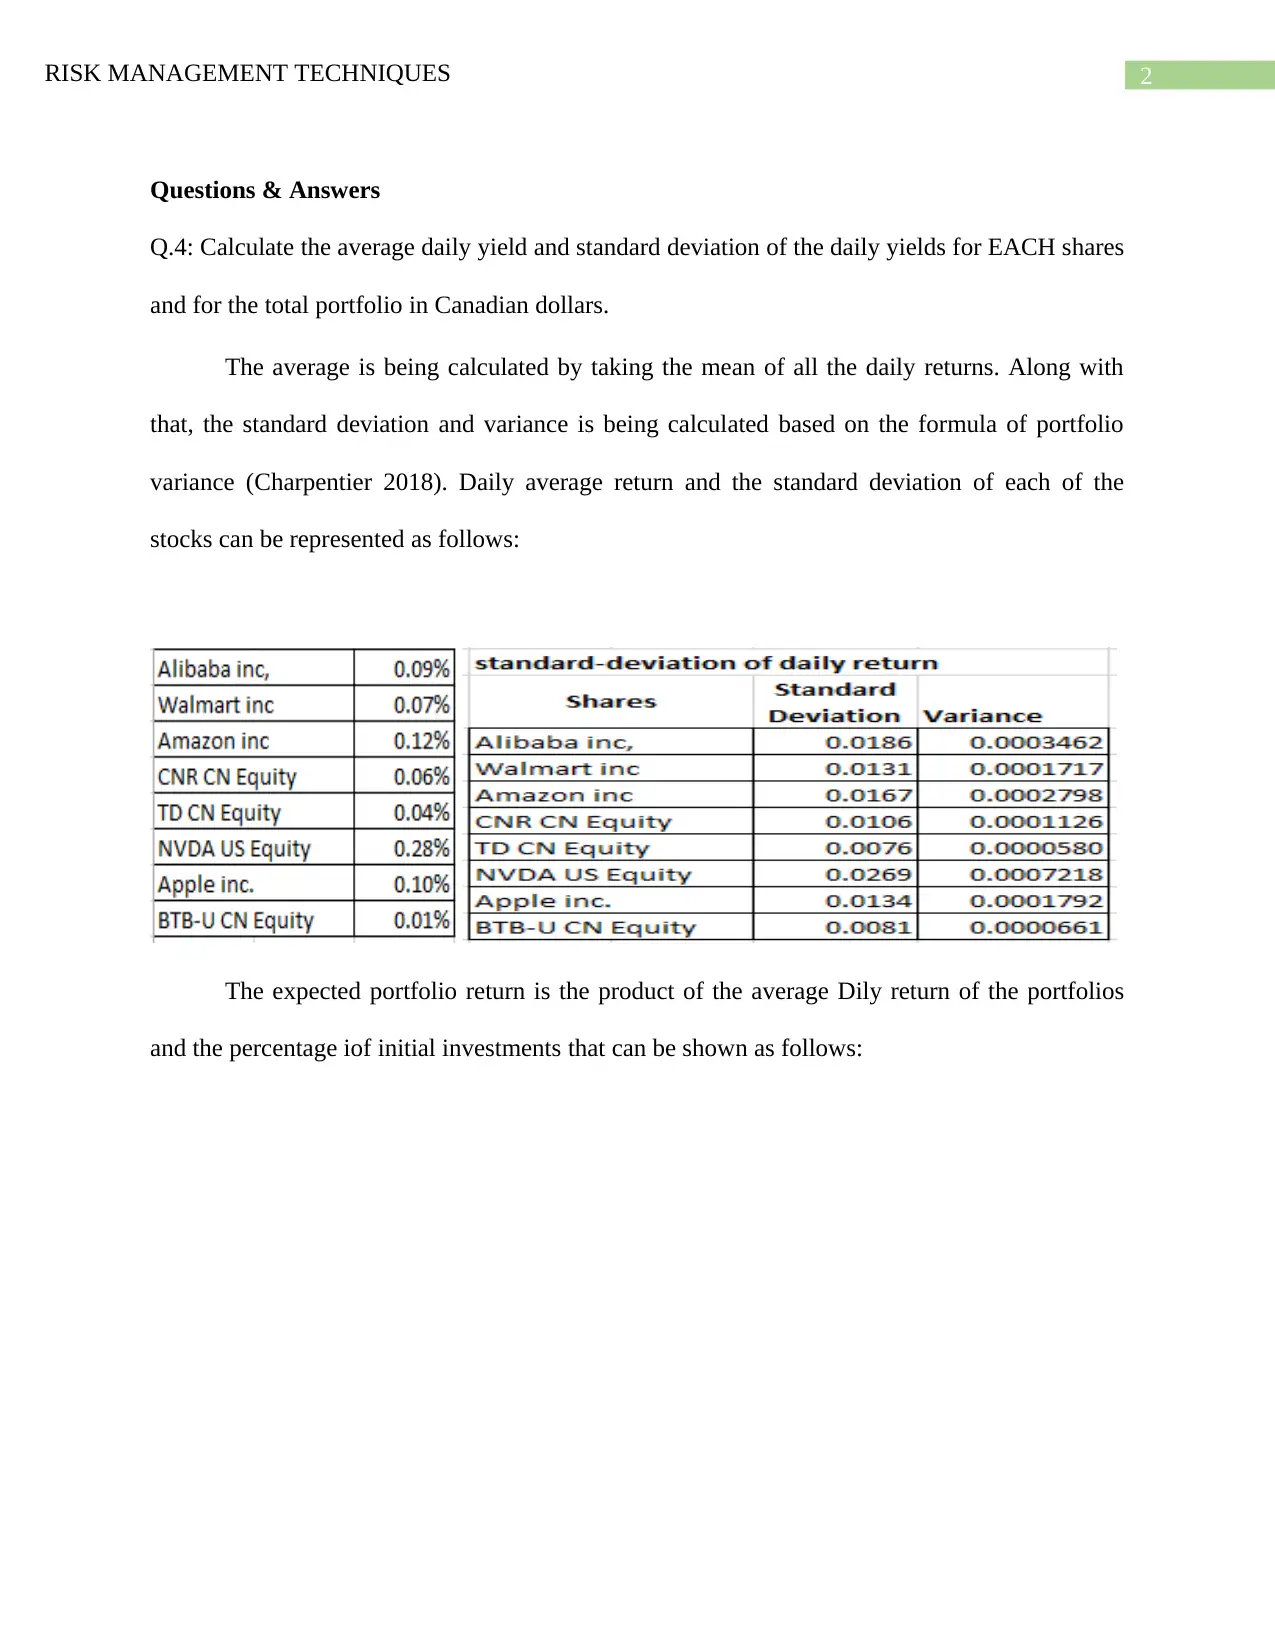
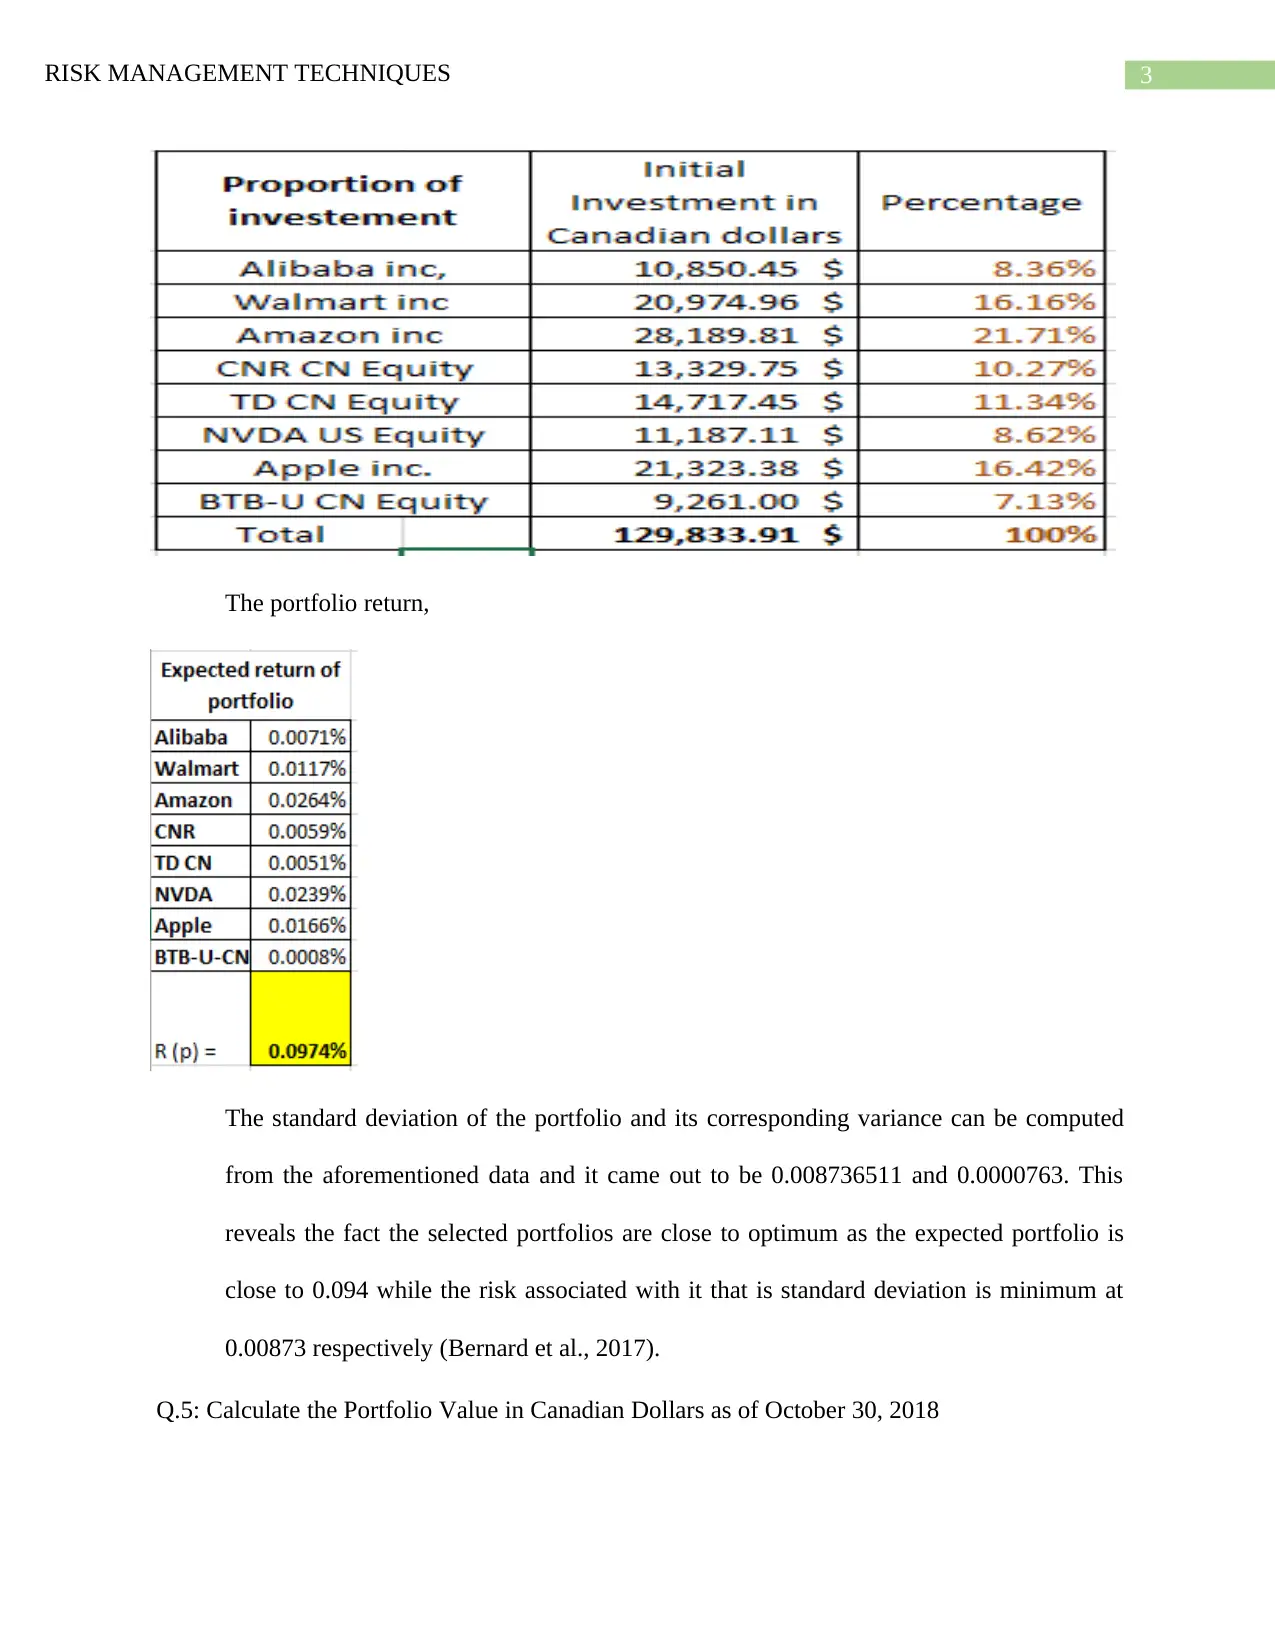
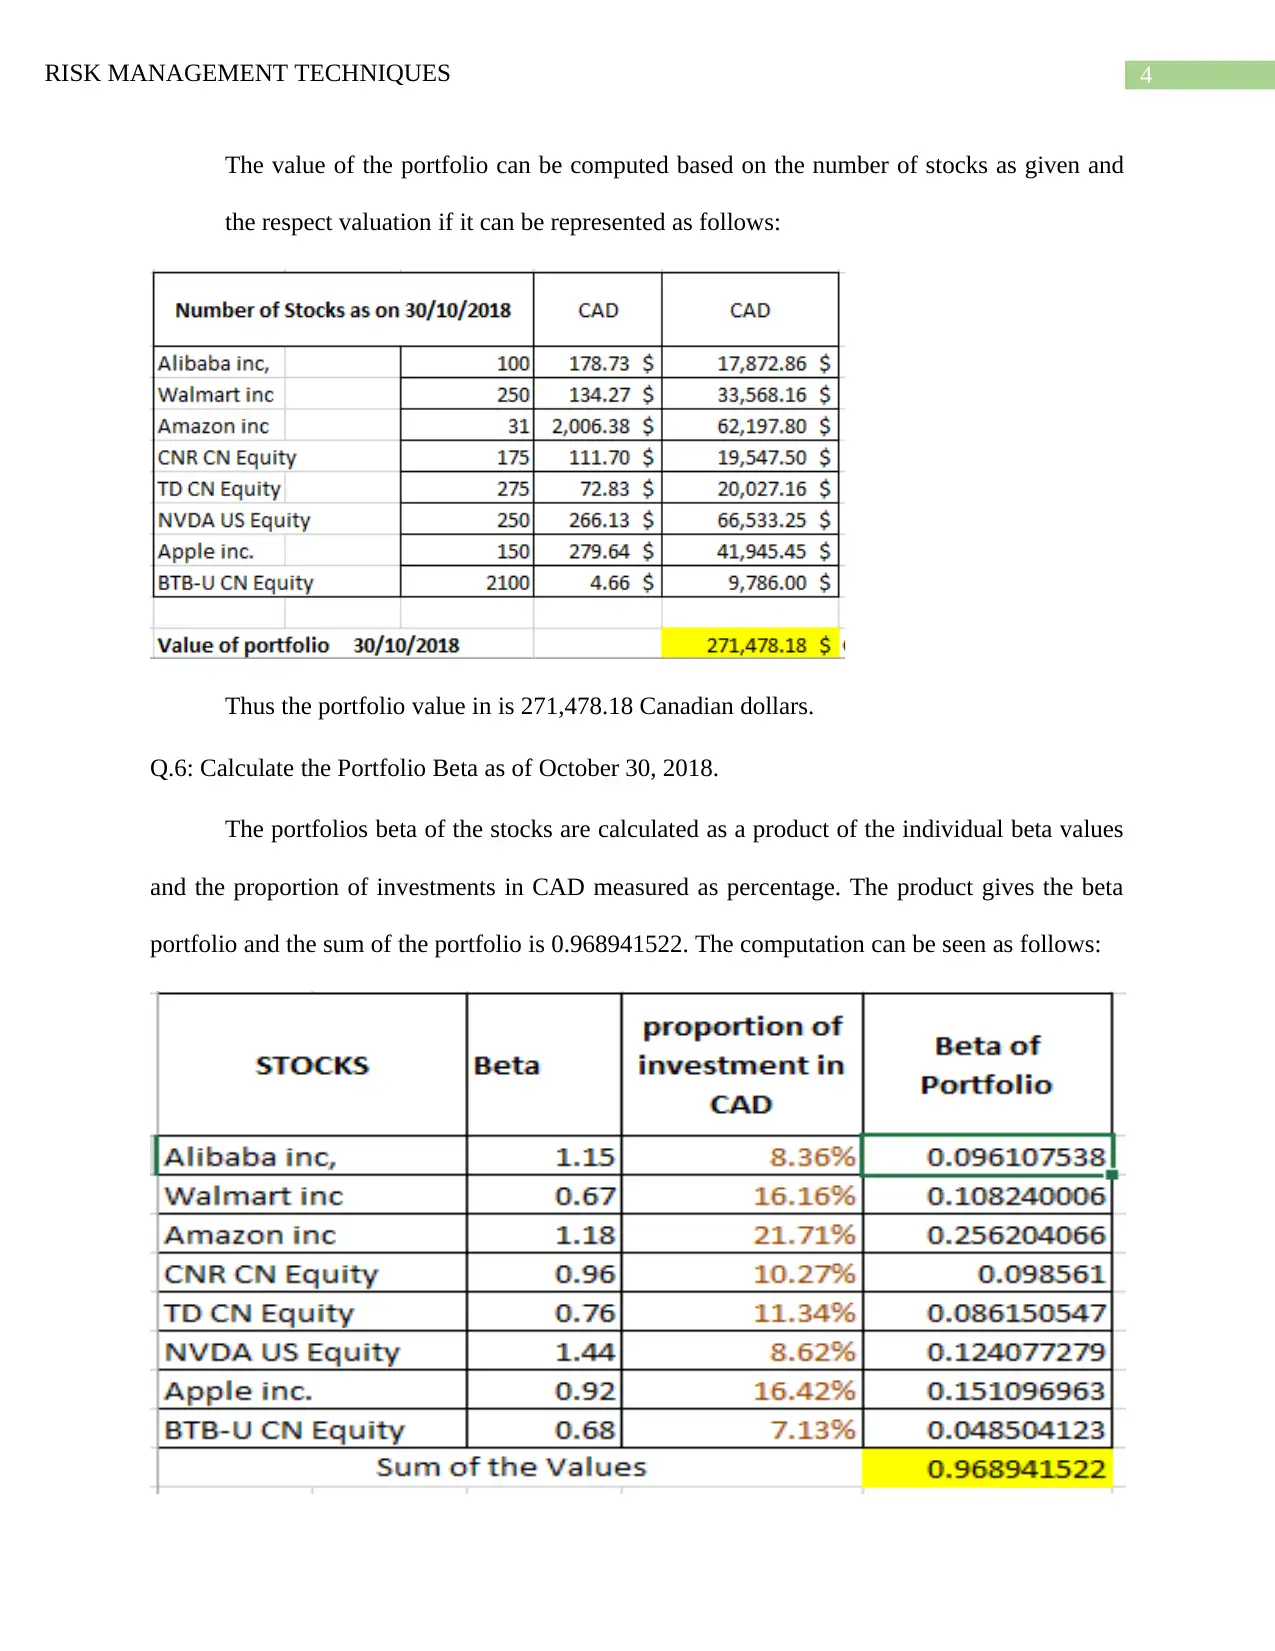
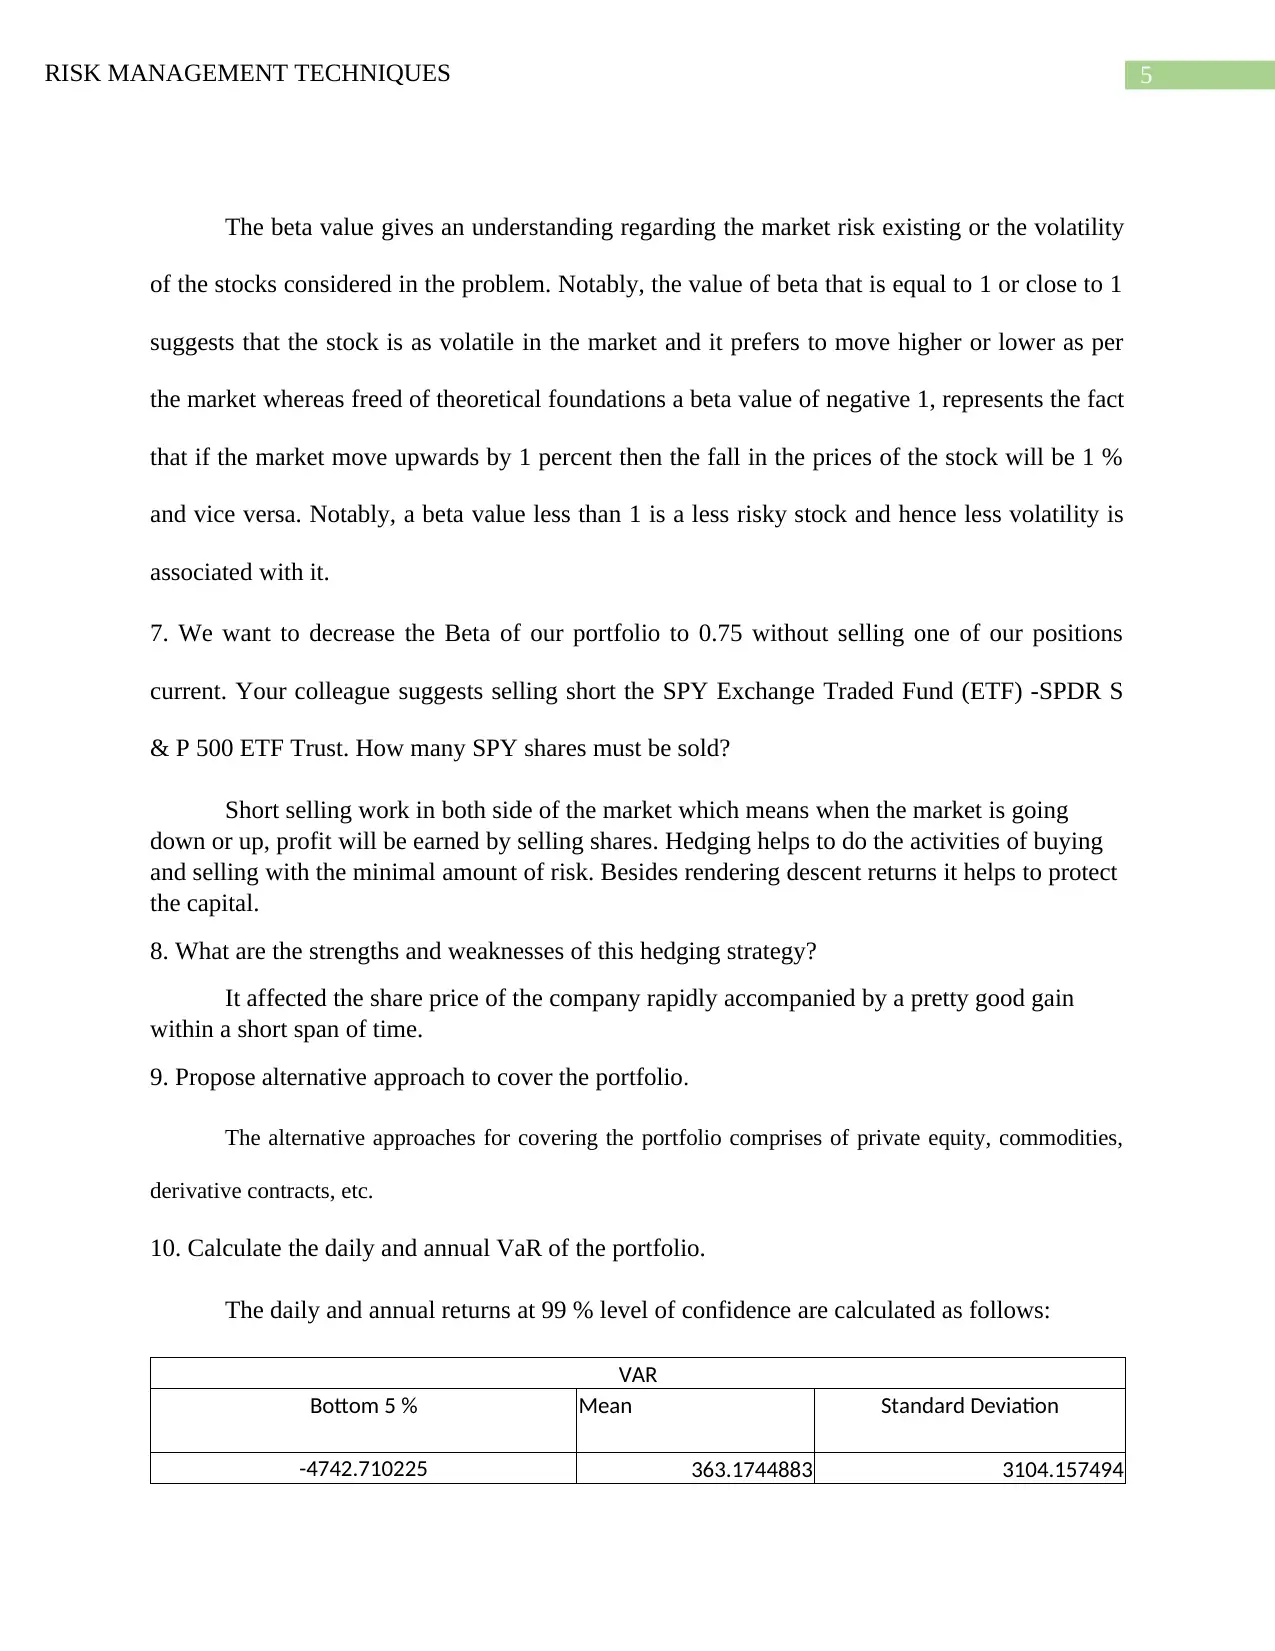
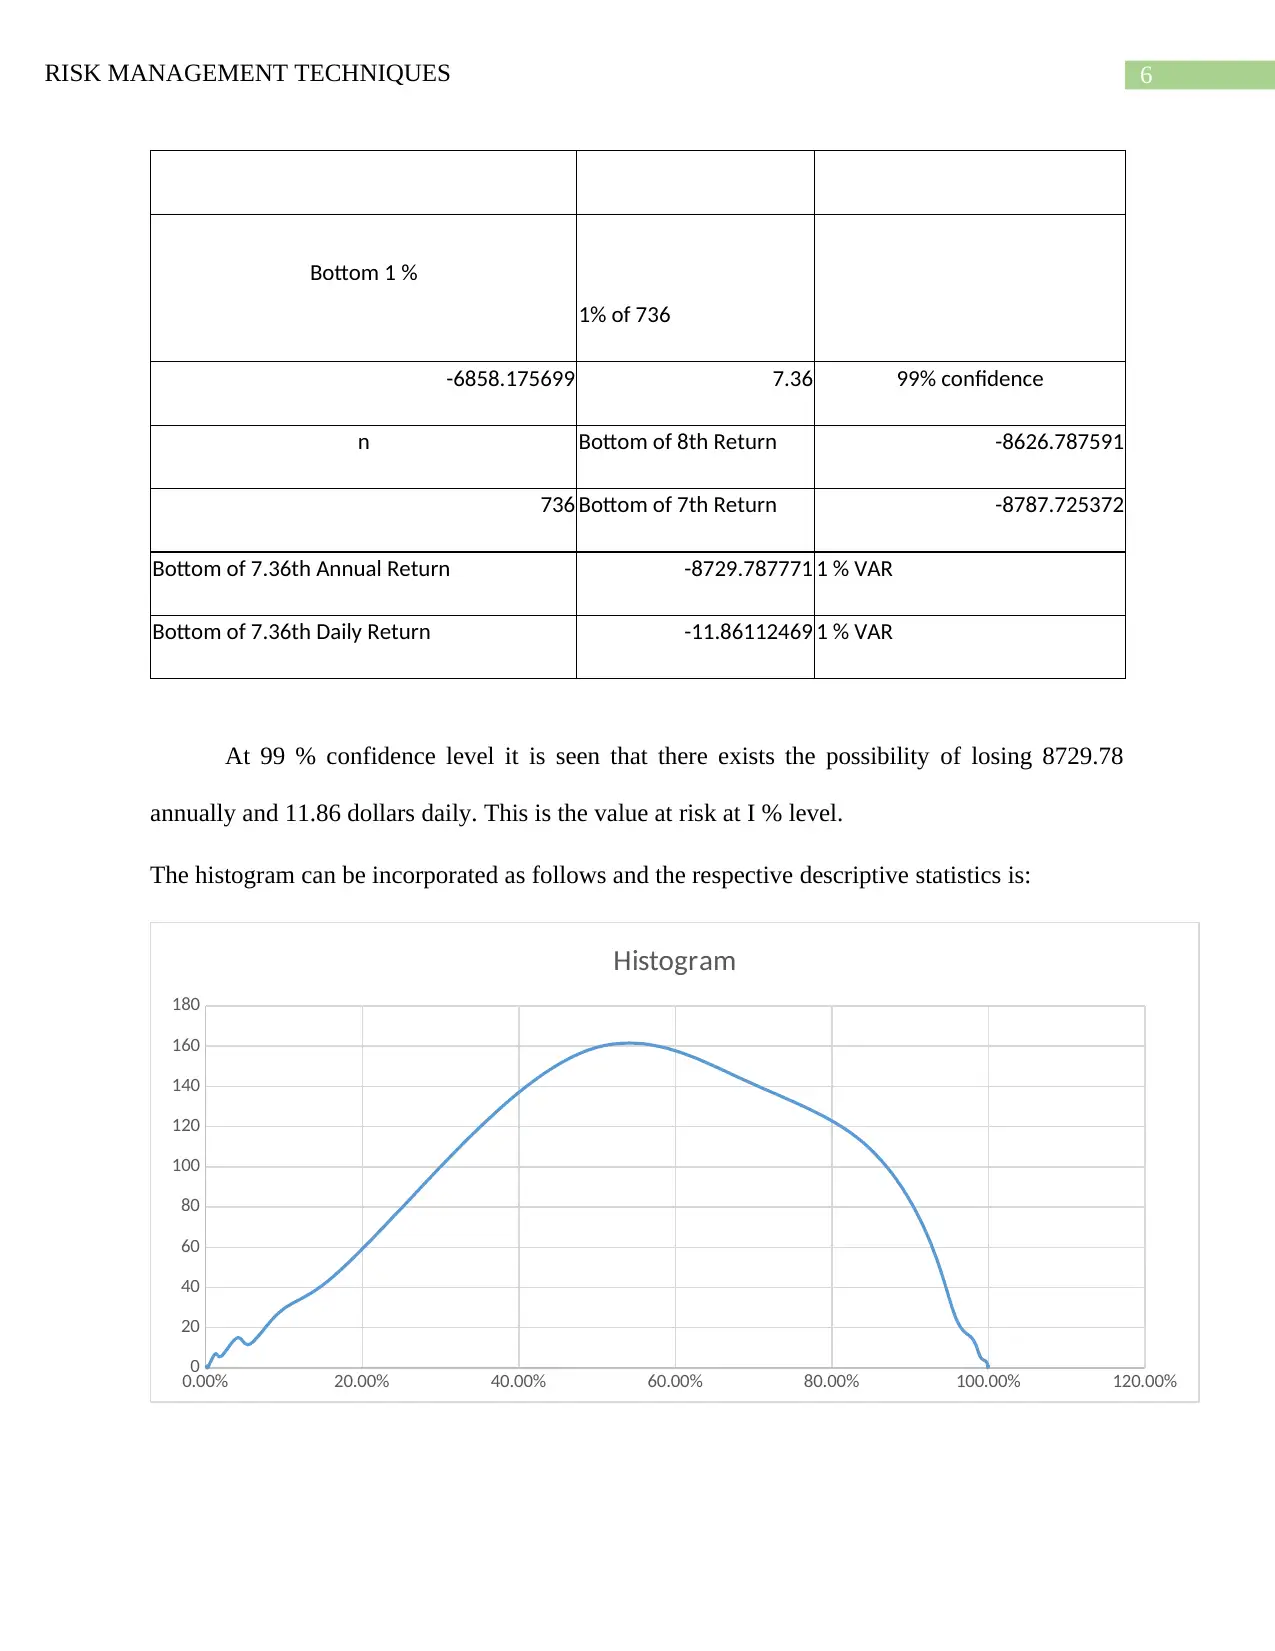
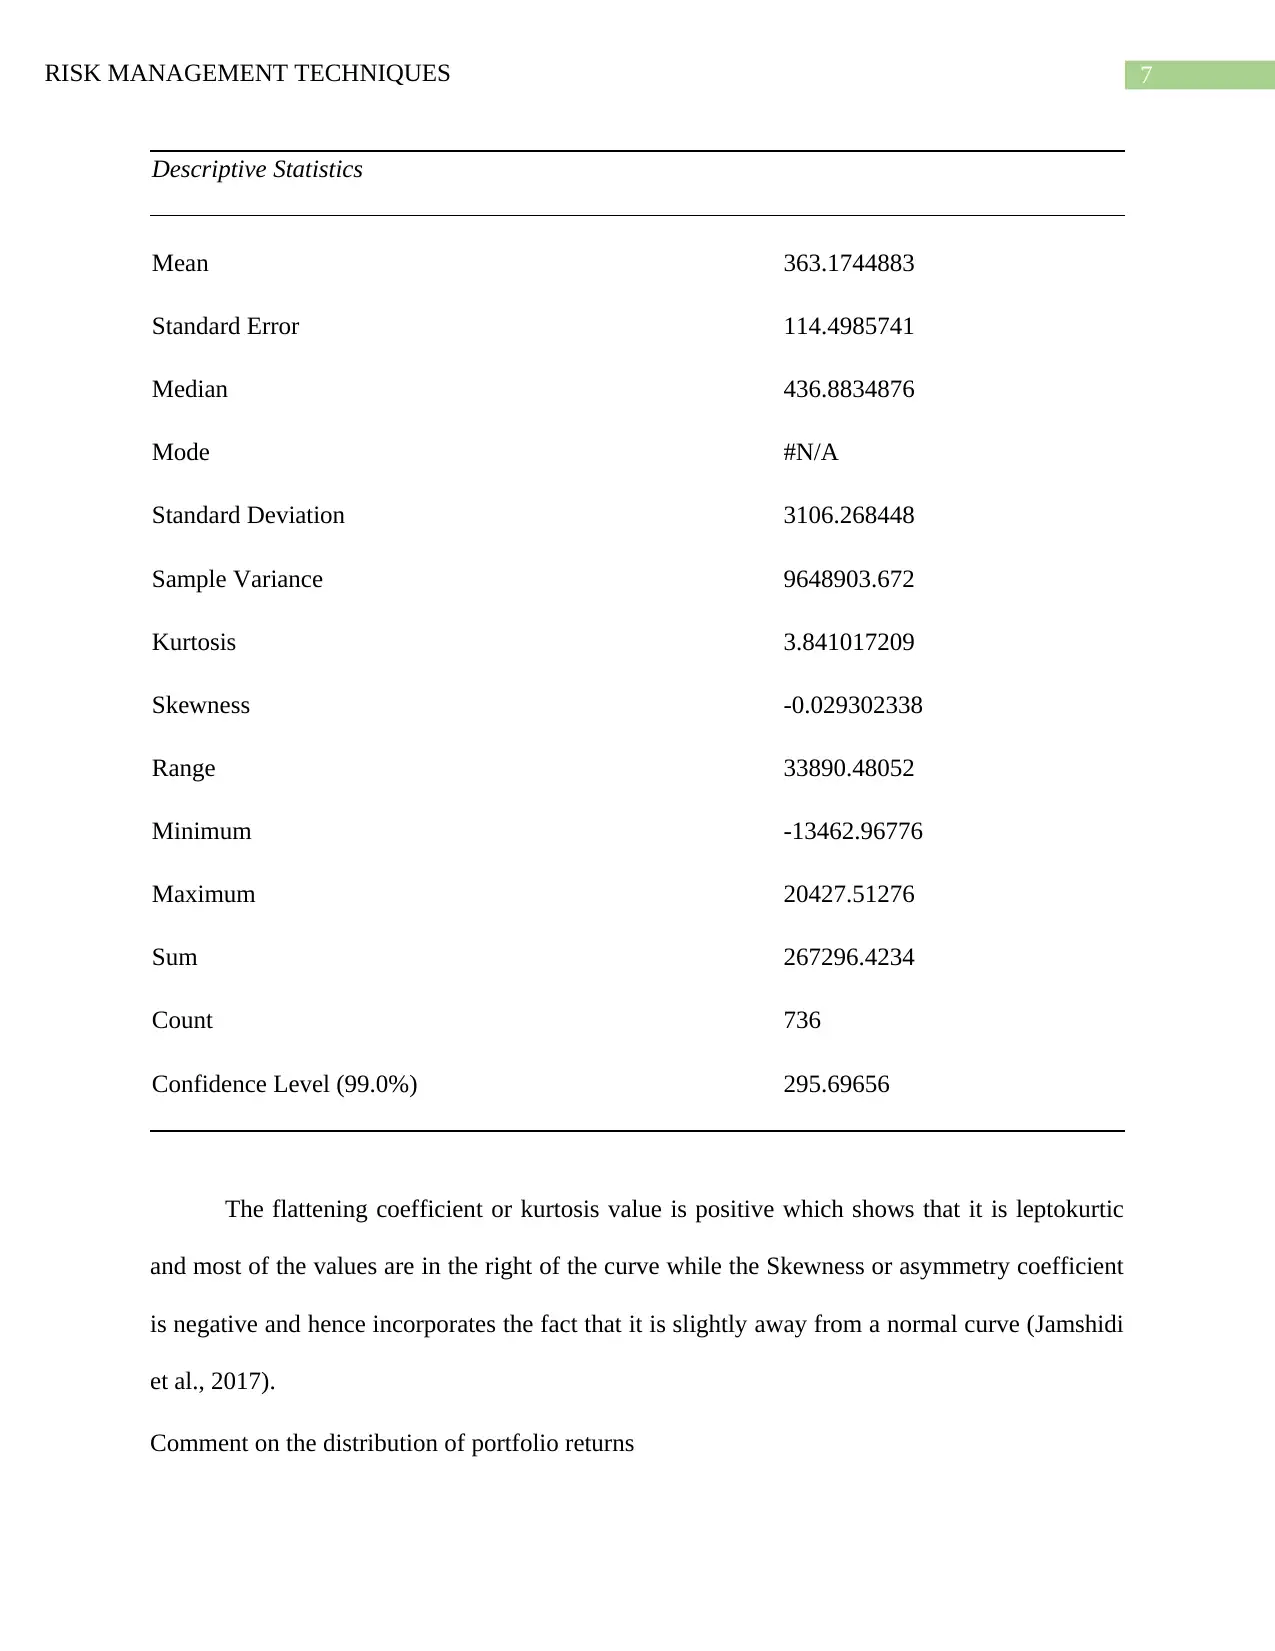
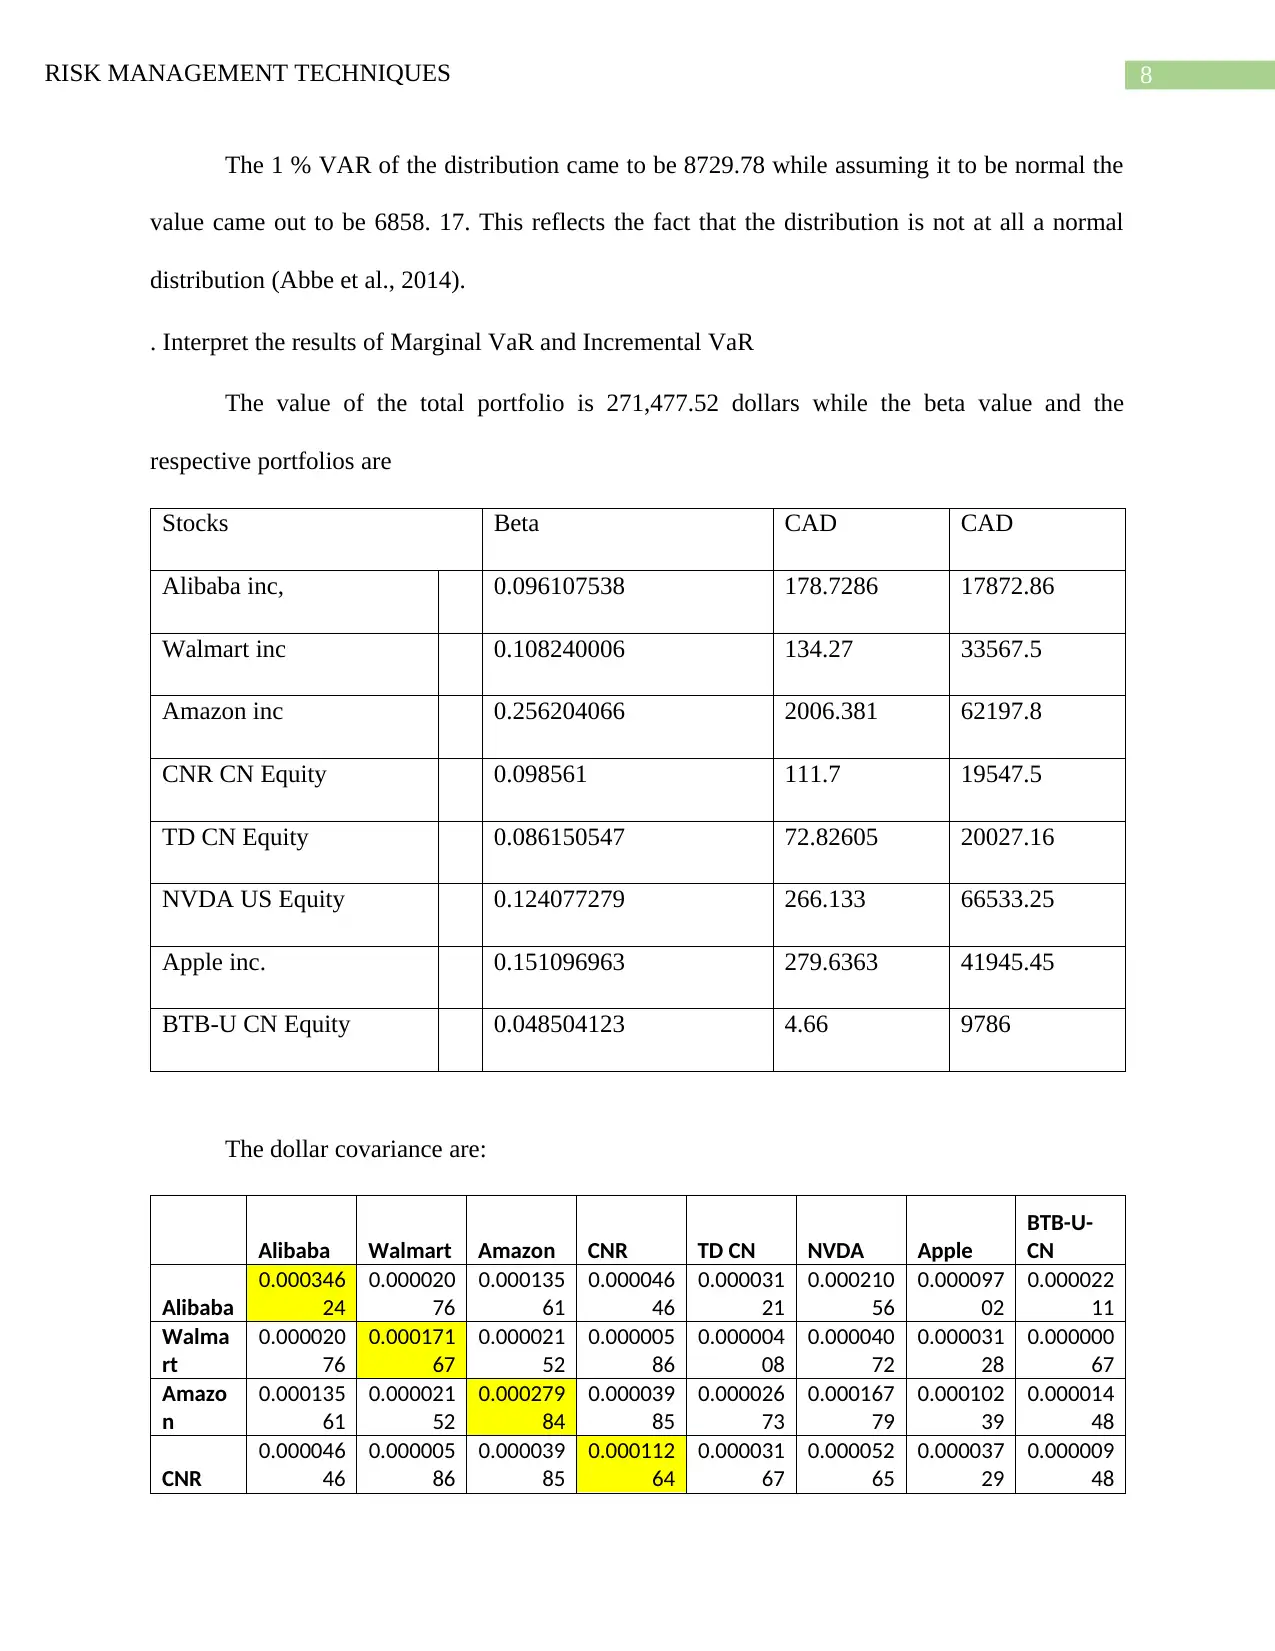
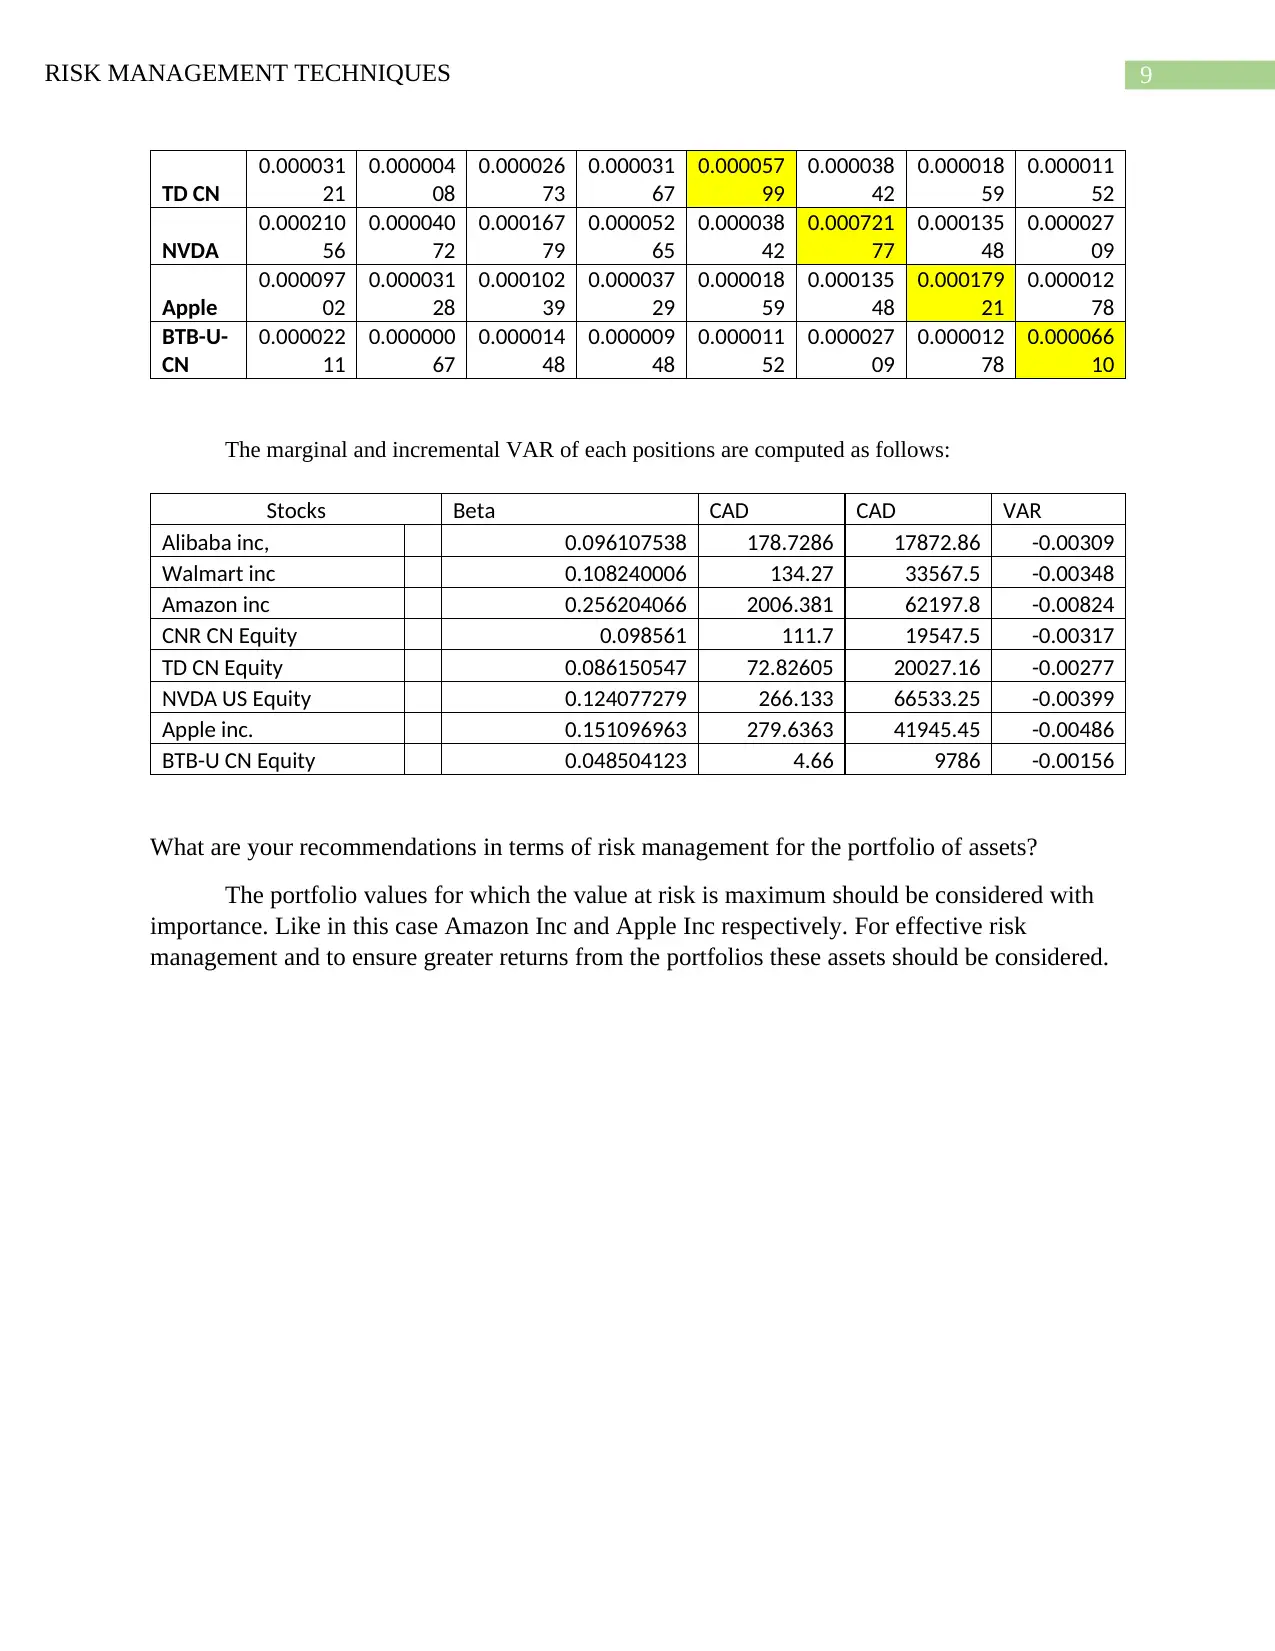
This report delves into financial risk management techniques, offering a comprehensive analysis of a given investment portfolio. It begins by calculating the average daily yield and standard deviation for each share and the total portfolio, providing insights into the expected portfolio return and associated risk. The report then determines the portfolio's value in Canadian dollars and calculates its beta, offering an understanding of market risk and volatility. Furthermore, it explores hedging strategies, proposing and evaluating the use of short selling SPY ETF shares to reduce portfolio beta. The report also suggests alternative approaches to cover the portfolio and calculates both daily and annual Value at Risk (VaR) at a 99% confidence level, offering a detailed interpretation of the results, including marginal and incremental VaR. Finally, the report provides recommendations for effective risk management, emphasizing the importance of considering assets with maximum value at risk for optimal portfolio management.

0
Running head: RISK MANAGEMENT TECHNIQUES
RISK MANAGEMENT TECHNIQUES
Name of the Student
Name of the University
Author’s Note
Running head: RISK MANAGEMENT TECHNIQUES
RISK MANAGEMENT TECHNIQUES
Name of the Student
Name of the University
Author’s Note
Paraphrase This Document
Need a fresh take? Get an instant paraphrase of this document with our AI Paraphraser

1RISK MANAGEMENT TECHNIQUES
Table of Contents
Questions & Answers......................................................................................................................2
References......................................................................................................................................10

2RISK MANAGEMENT TECHNIQUES
Questions & Answers
Q.4: Calculate the average daily yield and standard deviation of the daily yields for EACH shares
and for the total portfolio in Canadian dollars.
The average is being calculated by taking the mean of all the daily returns. Along with
that, the standard deviation and variance is being calculated based on the formula of portfolio
variance (Charpentier 2018). Daily average return and the standard deviation of each of the
stocks can be represented as follows:
The expected portfolio return is the product of the average Dily return of the portfolios
and the percentage iof initial investments that can be shown as follows:
⊘ This is a preview!⊘
Do you want full access?
Subscribe today to unlock all pages.

Trusted by 1+ million students worldwide

3RISK MANAGEMENT TECHNIQUES
The portfolio return,
The standard deviation of the portfolio and its corresponding variance can be computed
from the aforementioned data and it came out to be 0.008736511 and 0.0000763. This
reveals the fact the selected portfolios are close to optimum as the expected portfolio is
close to 0.094 while the risk associated with it that is standard deviation is minimum at
0.00873 respectively (Bernard et al., 2017).
Q.5: Calculate the Portfolio Value in Canadian Dollars as of October 30, 2018
Paraphrase This Document
Need a fresh take? Get an instant paraphrase of this document with our AI Paraphraser

4RISK MANAGEMENT TECHNIQUES
The value of the portfolio can be computed based on the number of stocks as given and
the respect valuation if it can be represented as follows:
Thus the portfolio value in is 271,478.18 Canadian dollars.
Q.6: Calculate the Portfolio Beta as of October 30, 2018.
The portfolios beta of the stocks are calculated as a product of the individual beta values
and the proportion of investments in CAD measured as percentage. The product gives the beta
portfolio and the sum of the portfolio is 0.968941522. The computation can be seen as follows:

5RISK MANAGEMENT TECHNIQUES
The beta value gives an understanding regarding the market risk existing or the volatility
of the stocks considered in the problem. Notably, the value of beta that is equal to 1 or close to 1
suggests that the stock is as volatile in the market and it prefers to move higher or lower as per
the market whereas freed of theoretical foundations a beta value of negative 1, represents the fact
that if the market move upwards by 1 percent then the fall in the prices of the stock will be 1 %
and vice versa. Notably, a beta value less than 1 is a less risky stock and hence less volatility is
associated with it.
7. We want to decrease the Beta of our portfolio to 0.75 without selling one of our positions
current. Your colleague suggests selling short the SPY Exchange Traded Fund (ETF) -SPDR S
& P 500 ETF Trust. How many SPY shares must be sold?
Short selling work in both side of the market which means when the market is going
down or up, profit will be earned by selling shares. Hedging helps to do the activities of buying
and selling with the minimal amount of risk. Besides rendering descent returns it helps to protect
the capital.
8. What are the strengths and weaknesses of this hedging strategy?
It affected the share price of the company rapidly accompanied by a pretty good gain
within a short span of time.
9. Propose alternative approach to cover the portfolio.
The alternative approaches for covering the portfolio comprises of private equity, commodities,
derivative contracts, etc.
10. Calculate the daily and annual VaR of the portfolio.
The daily and annual returns at 99 % level of confidence are calculated as follows:
VAR
Bottom 5 % Mean Standard Deviation
-4742.710225 363.1744883 3104.157494
⊘ This is a preview!⊘
Do you want full access?
Subscribe today to unlock all pages.

Trusted by 1+ million students worldwide

6RISK MANAGEMENT TECHNIQUES
Bottom 1 %
1% of 736
-6858.175699 7.36 99% confidence
n Bottom of 8th Return -8626.787591
736 Bottom of 7th Return -8787.725372
Bottom of 7.36th Annual Return -8729.787771 1 % VAR
Bottom of 7.36th Daily Return -11.86112469 1 % VAR
At 99 % confidence level it is seen that there exists the possibility of losing 8729.78
annually and 11.86 dollars daily. This is the value at risk at I % level.
The histogram can be incorporated as follows and the respective descriptive statistics is:
0.00% 20.00% 40.00% 60.00% 80.00% 100.00% 120.00%
0
20
40
60
80
100
120
140
160
180
Histogram
Paraphrase This Document
Need a fresh take? Get an instant paraphrase of this document with our AI Paraphraser

7RISK MANAGEMENT TECHNIQUES
Descriptive Statistics
Mean 363.1744883
Standard Error 114.4985741
Median 436.8834876
Mode #N/A
Standard Deviation 3106.268448
Sample Variance 9648903.672
Kurtosis 3.841017209
Skewness -0.029302338
Range 33890.48052
Minimum -13462.96776
Maximum 20427.51276
Sum 267296.4234
Count 736
Confidence Level (99.0%) 295.69656
The flattening coefficient or kurtosis value is positive which shows that it is leptokurtic
and most of the values are in the right of the curve while the Skewness or asymmetry coefficient
is negative and hence incorporates the fact that it is slightly away from a normal curve (Jamshidi
et al., 2017).
Comment on the distribution of portfolio returns

8RISK MANAGEMENT TECHNIQUES
The 1 % VAR of the distribution came to be 8729.78 while assuming it to be normal the
value came out to be 6858. 17. This reflects the fact that the distribution is not at all a normal
distribution (Abbe et al., 2014).
. Interpret the results of Marginal VaR and Incremental VaR
The value of the total portfolio is 271,477.52 dollars while the beta value and the
respective portfolios are
Stocks Beta CAD CAD
Alibaba inc, 0.096107538 178.7286 17872.86
Walmart inc 0.108240006 134.27 33567.5
Amazon inc 0.256204066 2006.381 62197.8
CNR CN Equity 0.098561 111.7 19547.5
TD CN Equity 0.086150547 72.82605 20027.16
NVDA US Equity 0.124077279 266.133 66533.25
Apple inc. 0.151096963 279.6363 41945.45
BTB-U CN Equity 0.048504123 4.66 9786
The dollar covariance are:
Alibaba Walmart Amazon CNR TD CN NVDA Apple
BTB-U-
CN
Alibaba
0.000346
24
0.000020
76
0.000135
61
0.000046
46
0.000031
21
0.000210
56
0.000097
02
0.000022
11
Walma
rt
0.000020
76
0.000171
67
0.000021
52
0.000005
86
0.000004
08
0.000040
72
0.000031
28
0.000000
67
Amazo
n
0.000135
61
0.000021
52
0.000279
84
0.000039
85
0.000026
73
0.000167
79
0.000102
39
0.000014
48
CNR
0.000046
46
0.000005
86
0.000039
85
0.000112
64
0.000031
67
0.000052
65
0.000037
29
0.000009
48
⊘ This is a preview!⊘
Do you want full access?
Subscribe today to unlock all pages.

Trusted by 1+ million students worldwide

9RISK MANAGEMENT TECHNIQUES
TD CN
0.000031
21
0.000004
08
0.000026
73
0.000031
67
0.000057
99
0.000038
42
0.000018
59
0.000011
52
NVDA
0.000210
56
0.000040
72
0.000167
79
0.000052
65
0.000038
42
0.000721
77
0.000135
48
0.000027
09
Apple
0.000097
02
0.000031
28
0.000102
39
0.000037
29
0.000018
59
0.000135
48
0.000179
21
0.000012
78
BTB-U-
CN
0.000022
11
0.000000
67
0.000014
48
0.000009
48
0.000011
52
0.000027
09
0.000012
78
0.000066
10
The marginal and incremental VAR of each positions are computed as follows:
Stocks Beta CAD CAD VAR
Alibaba inc, 0.096107538 178.7286 17872.86 -0.00309
Walmart inc 0.108240006 134.27 33567.5 -0.00348
Amazon inc 0.256204066 2006.381 62197.8 -0.00824
CNR CN Equity 0.098561 111.7 19547.5 -0.00317
TD CN Equity 0.086150547 72.82605 20027.16 -0.00277
NVDA US Equity 0.124077279 266.133 66533.25 -0.00399
Apple inc. 0.151096963 279.6363 41945.45 -0.00486
BTB-U CN Equity 0.048504123 4.66 9786 -0.00156
What are your recommendations in terms of risk management for the portfolio of assets?
The portfolio values for which the value at risk is maximum should be considered with
importance. Like in this case Amazon Inc and Apple Inc respectively. For effective risk
management and to ensure greater returns from the portfolios these assets should be considered.
Paraphrase This Document
Need a fresh take? Get an instant paraphrase of this document with our AI Paraphraser

10RISK MANAGEMENT TECHNIQUES
References
Abbe, E., Khandani, A., & Lo, A. W. (2014). U.S. Patent Application No. 14/453,446.
https://patents.google.com/patent/US20140351104A1/en
Bernard, C., Rüschendorf, L., & Vanduffel, S. (2017). Value‐at‐risk bounds with variance
constraints. Journal of Risk and Insurance, 84(3), 923-959.
https://onlinelibrary.wiley.com/doi/abs/10.1111/jori.12108
Charpentier, A. (2018). Allocations for Value-at-Risk portfolio optimization. Machine
Learning, 14, 05. https://freakonometrics.hypotheses.org/1719?lang=fr_FR
Jamshidi, A., Faghih‐Roohi, S., Hajizadeh, S., Núñez, A., Babuska, R., Dollevoet, R., ... & De
Schutter, B. (2017). A big data analysis approach for rail failure risk assessment. Risk
analysis, 37(8), 1495-1507. https://onlinelibrary.wiley.com/doi/abs/10.1111/risa.12836
1 out of 11
Related Documents

Your All-in-One AI-Powered Toolkit for Academic Success.
+13062052269
info@desklib.com
Available 24*7 on WhatsApp / Email
Unlock your academic potential
Copyright © 2020–2025 A2Z Services. All Rights Reserved. Developed and managed by ZUCOL.