Finance Assignment: Risk and Return Analysis for ACC00716 Course

Verified

Added on  2022/08/26

|8
|1777
|17
Report
AI Summary
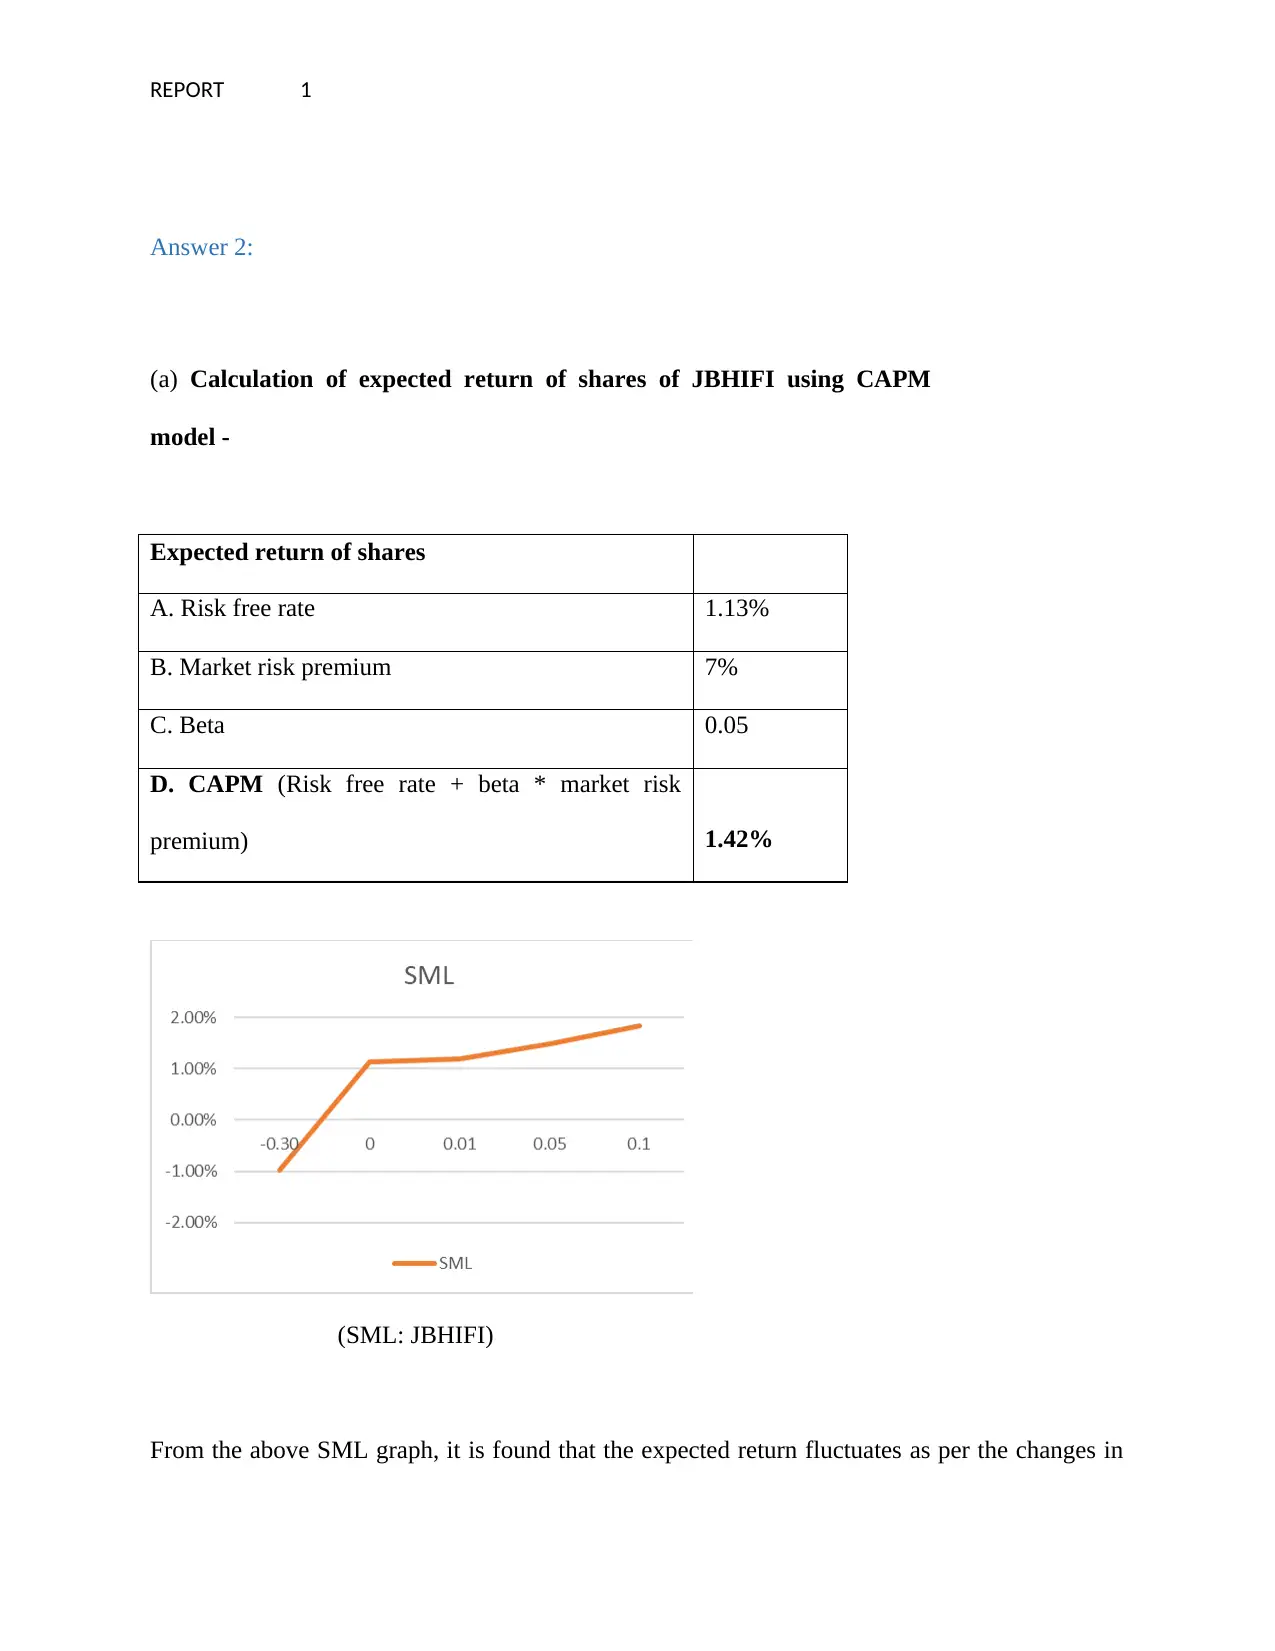
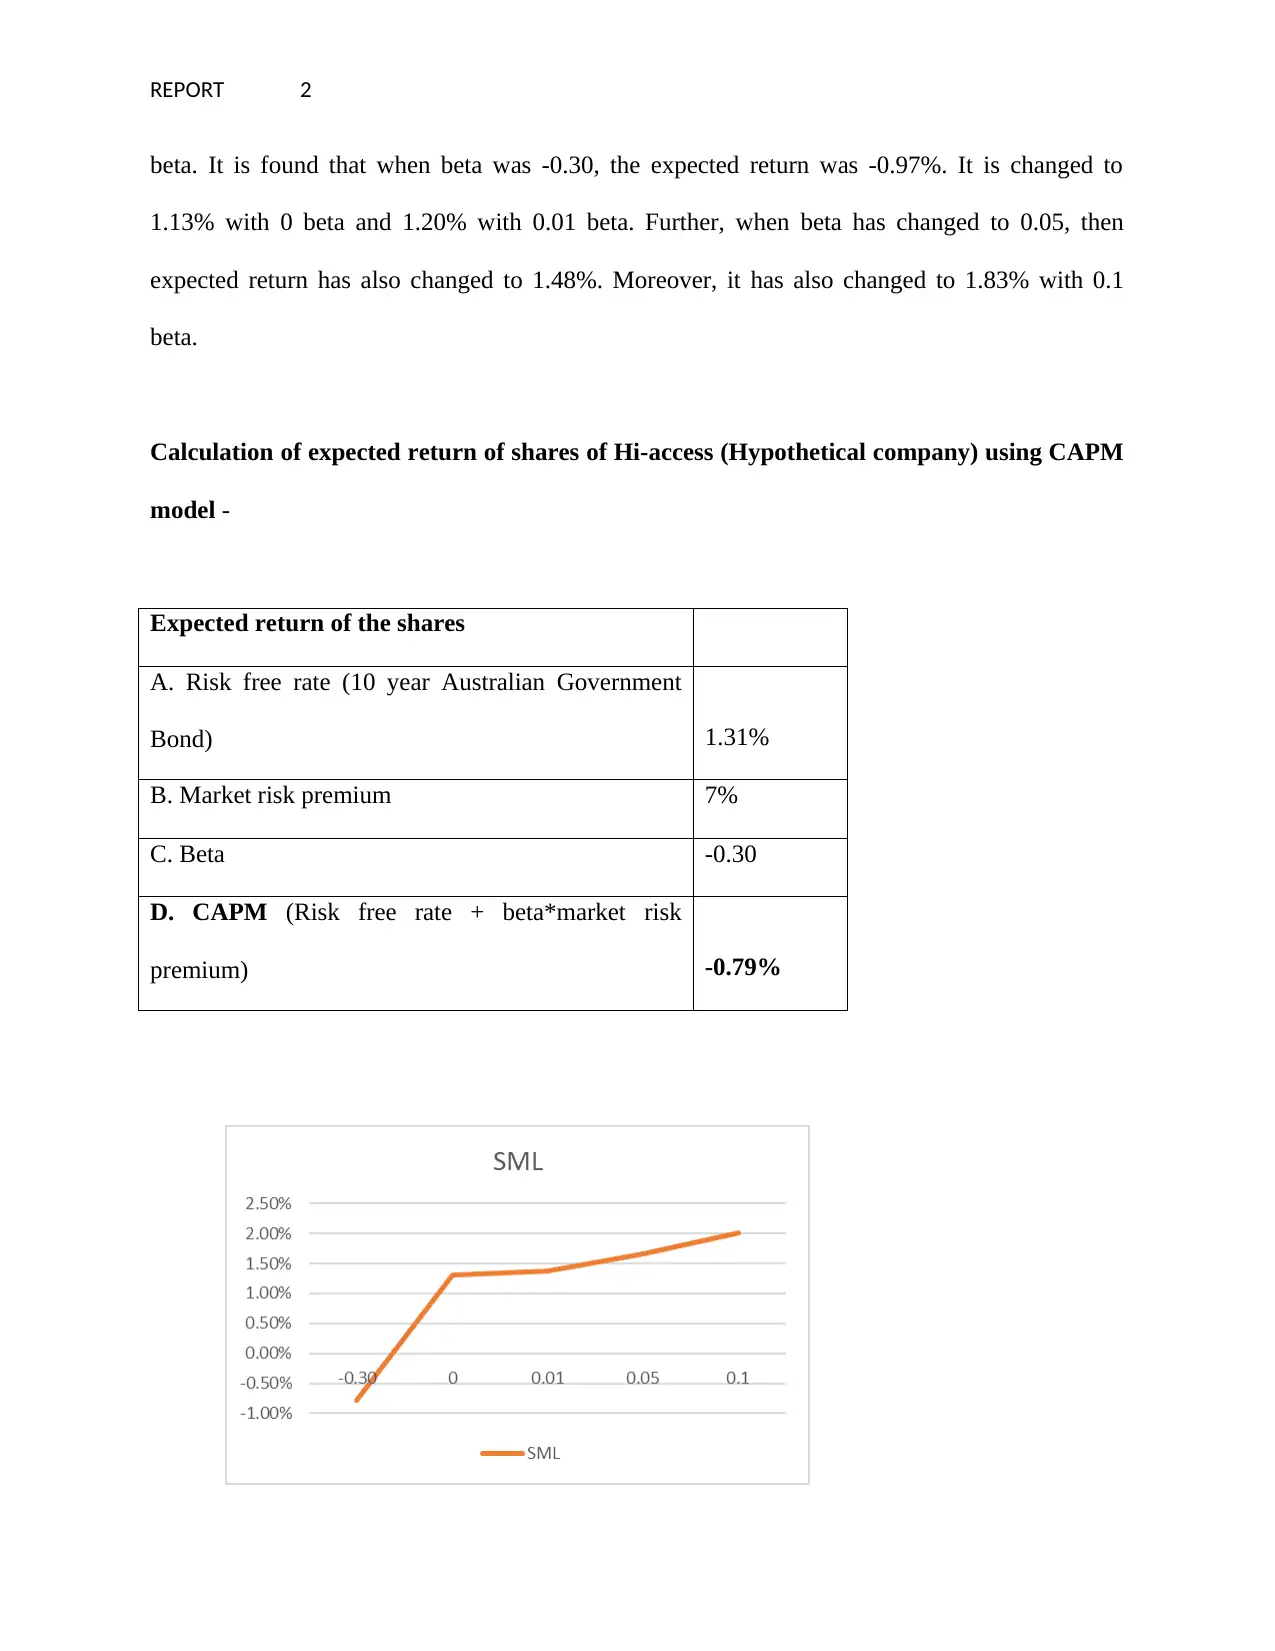
This assignment analyzes the expected return of shares for JBHIFI and a hypothetical company, Hi-access, using the Capital Asset Pricing Model (CAPM). The analysis includes calculating the risk-free rate, market risk premium, beta, and the resulting expected return for each company. The report then calculates the portfolio expected return and portfolio beta, considering the weights of each stock in the portfolio. Furthermore, the report discusses the concepts of beta, systematic risk, and the application of CAPM, including its formula and the interpretation of results. It also presents a Standard Security Market Line (SML) graph to illustrate the relationship between beta and expected return. The assignment also includes a discussion on the limitations of the CAPM model and the use of standard deviation to evaluate overall risk. Finally, the report references relevant academic literature to support the analysis.
Document Page
Running head: REPORT 0
BUSINESS FINANCE
JANUARY 11, 2020
STUDENT DETAILS:
tabler-icon-diamond-filled.svg

Paraphrase This Document

Need a fresh take? Get an instant paraphrase of this document with our AI Paraphraser
Document Page
REPORT 1
Answer 2:
(a) Calculation of expected return of shares of JBHIFI using CAPM
model -
Expected return of shares
A. Risk free rate 1.13%
B. Market risk premium 7%
C. Beta 0.05
D. CAPM (Risk free rate + beta * market risk
premium) 1.42%
(SML: JBHIFI)
From the above SML graph, it is found that the expected return fluctuates as per the changes in
Document Page
REPORT 2
beta. It is found that when beta was -0.30, the expected return was -0.97%. It is changed to
1.13% with 0 beta and 1.20% with 0.01 beta. Further, when beta has changed to 0.05, then
expected return has also changed to 1.48%. Moreover, it has also changed to 1.83% with 0.1
beta.
Calculation of expected return of shares of Hi-access (Hypothetical company) using CAPM
model -
Expected return of the shares
A. Risk free rate (10 year Australian Government
Bond) 1.31%
B. Market risk premium 7%
C. Beta -0.30
D. CAPM (Risk free rate + beta*market risk
premium) -0.79%
Document Page
REPORT 3
(SML: HI-Access)
It is found from SML graph that the expected return changes according to the fluctuations in
beta. It can see that when beta was -0.30, the expected return was -0.79%. The expected return is
increased to 1.31% with 0 beta and 1.38% with 0.01 beta. Furthermore, when beta has changed
to 0.05, then expected return is increased to 1.66%. Additionally, it is also increased to 2.01%
with 0.1 beta.
(b) Calculation of portfolio expected
return-
Particulars JBHIFI Hi-access Total
Expected return 1.42% -0.79%
Weight 0.50 0.50
Portfolio return (Expected return of
JBHIFI*portfolio weight + Expected return of
Hi-access* portfolio weight) 0.71% -0.40% 0.32%
Calculation of Portfolio Beta -
Particulars JBHIFI Hi-access Total
Beta 0.05 -0.30
Weight 0.50 0.50
Portfolio Beta (Beta of JBHIFI* portfolio 0.03 -0.15 -0.13
tabler-icon-diamond-filled.svg

Paraphrase This Document

Need a fresh take? Get an instant paraphrase of this document with our AI Paraphraser
Document Page
REPORT 4
weight + beta of Hi-access* portfolio weight)
Answer 3:
JBHIFI is Australian based home entertainment retailer. This organisation puts focus on the
electronic goods like computer, software along with different electric goods. This organisation is
listed on ASX. It is categorised as retailing entity. Market This report has analysed the expected
return of JBHIFI with the implementation of CAPM and, compared return and beta of JBHIFI
with return as well as beta of Hi-access (hypothetical company). This paper has measured
portfolio beta and portfolio expected return of both companies.
Firstly, a beta defines the function of the returns of security responding to swing in the
marketplace. The beta coefficient is considered as the measure of systematic risk (volatility) of
the own stocks as compared to unsystematic risk of whole marketplace. In numerical term, beta
states slope of line throughout the regression of figures point from separate return of stocks in
against of marketplace. Beta is helpful in measuring sensitivity of the separate securities to the
marketplace movement (Campbell, et. al, 2018). Beta is utilised in CAPM that finds expected
return of the asset utilising the beta as well as expected market return. For the calculation of beta
of company, it is needed to know risk free rate as well as market index. It can see that Beta of
Hi-access is – 0.30 that is less than beta of JBHIFI. The beta of JBHIFI is 0.05. It can see that the
beta less than 1 represents that the security is hypothetically less risky than marketplace. It can
say that portfolio is not more volatile with stocks involved than deprived of this. The security
having lower beta tends to move slowly in comparison of the market average. It is found that
beta of Hi-access is negative. The negative beta states that the stock is inversely correlated to
marketplace benchmark as if they were the opposite, mirror image of trend of benchmark
Document Page
REPORT 5
(Negrea and Toma, 2017). Secondly, expected return of CAPM formula is utilised to discount
anticipated dividends as well as capital appreciation of stocks above anticipated holding period
(Almeida, et. al, 2016). The expected return utilising CAPM is calculated from following
formula -
Expected return of JBHIFI is 1.42% depended on 0.05 beta, risk free rate 1.13% as well as
market risk premium of 7%. On other hand, expected return of Hi-access is - 0.79% based on the
- 0.30 beta, 1.31% risk free rate (Ten years Australian Government Bond) along with market risk
premium of 7%. An expected return is determined by using CAPM (Fernandez, 2019). The
capital asset pricing model is used to assess appropriate discount rate. CAPM is a measure of
connection between expected return and risk of making investment in securities. Capital asset
pricing model is utilised to assess securities as well as pricing them provided cost of capital as
well as expected rate of return. This model is mainly considered as one of the leading models to
calculate the risk along with return related to the investment in the stock. Even though, it uses the
some assumptions motivation behind CAPM method and simplicity of utilisation creates this one
of acknowledged along with practical manner to assist investor in the decision taking (Song,
2018).
Document Page
REPORT 6
In this way, annual expected return of JBHIFI is 1.42% based on CAPM. In actuality, the
organisation provides quite large actual return. The capital asset pricing model does not cover the
whole risk of the assets. The standard deviation (risk) is best evaluator of whole risk. A wider
range of annualized per month stock return of JBHIFI states how larger the standard deviation of
the return of company is (Raza, 2018). It is stated by higher standard deviation that why actual
return can be considerably dissimilar from the expected return. In this way, the standard
deviation of return evaluates level of distribution of return nearby means. Therefore, higher
standard deviation will lead greater distribution of return nearby means (Wegener, 2018).
Moreover, the portfolio beta is evaluation of completely systematic risk of portfolio of an
investment. This is equal to weighted average of beta of all the separate stock in
the portfolio. The portfolio beta is equal to amount of product of separate investment weight as
well as beta. The portfolio beta is negative. It is – 0.13. On the other hand, the portfolio expected
return is 0.32%. It can say that the standard deviation is considered as evaluation of whole
portfolio’s risk involving diversifiable risk as well as non-diversifiable risk. It is found that
involving more than one asset in the portfolio has decreased the diversifiable risks. Henceforth, it
has dropped the standard deviation or risk. In opposition, the beta coefficient is regarded as
degree of systematic risk that may not be diversified. In this way, it does not include diversifiable
risk. Considering additional assets to the portfolio does not decrease the portfolio beta (Reuters,
2018).
tabler-icon-diamond-filled.svg

Paraphrase This Document

Need a fresh take? Get an instant paraphrase of this document with our AI Paraphraser
Document Page
REPORT 7
References
Almeida, G.L., Petralia, G., Ferro, M., Ribas, C.A.P.M., Detti, S., Jereczek-Fossa, B.A.,
Tagliabue, E., Matei, D.V., Coman, I. and De Cobelli, O. (2016) Role of multi-parametric
magnetic resonance image and PIRADS score in patients with prostate cancer eligible for active
surveillance according PRIAS criteria. Urologia internationalis, 96(4), pp.459-469.
Campbell, J.Y., Giglio, S., Polk, C. and Turley, R., (2018) An intertemporal CAPM with
stochastic volatility. Journal of Financial Economics, 128(2), pp.207-233.
Fernandez, P. (2019) WACC and CAPM according to Utilities Regulators: Confusions, Errors
and Inconsistencies. Errors and Inconsistencies (February 1, 2019).
Negrea, B. and Toma, M. (2017) Dynamic CAPM under ambiguity—An experimental
approach. Journal of Behavioral and Experimental Finance, 16, pp.22-32.
Raza, H., (2018) Is D-CAPM Superior to CAPM? The Case of Pakistan Stock Exchange. NUML
International Journal of Business & Management, 13(1), pp.96-106.
Reuters (2018) JB Hi-Fi Limited. Available at: https://www.reuters.com/companies/JBH.AX .
[Access on: 11-01-2020]
Song, C., (2018) Analysis of Stock IPO Price Based on CAPM Model. Insight-Statistics, 1(1).
Wegener, M. (2018) CAPM. The Fama French three factor model cross section and time series
test. USA: Routledge
chevron_up_icon
1 out of 8
circle_padding
hide_on_mobile
zoom_out_icon
[object Object]