Risk and Return Analysis: ABC Co. and XYZ Co. Investment Portfolio

Verified

Added on  2022/11/23

|4
|703
|296
Homework Assignment
AI Summary
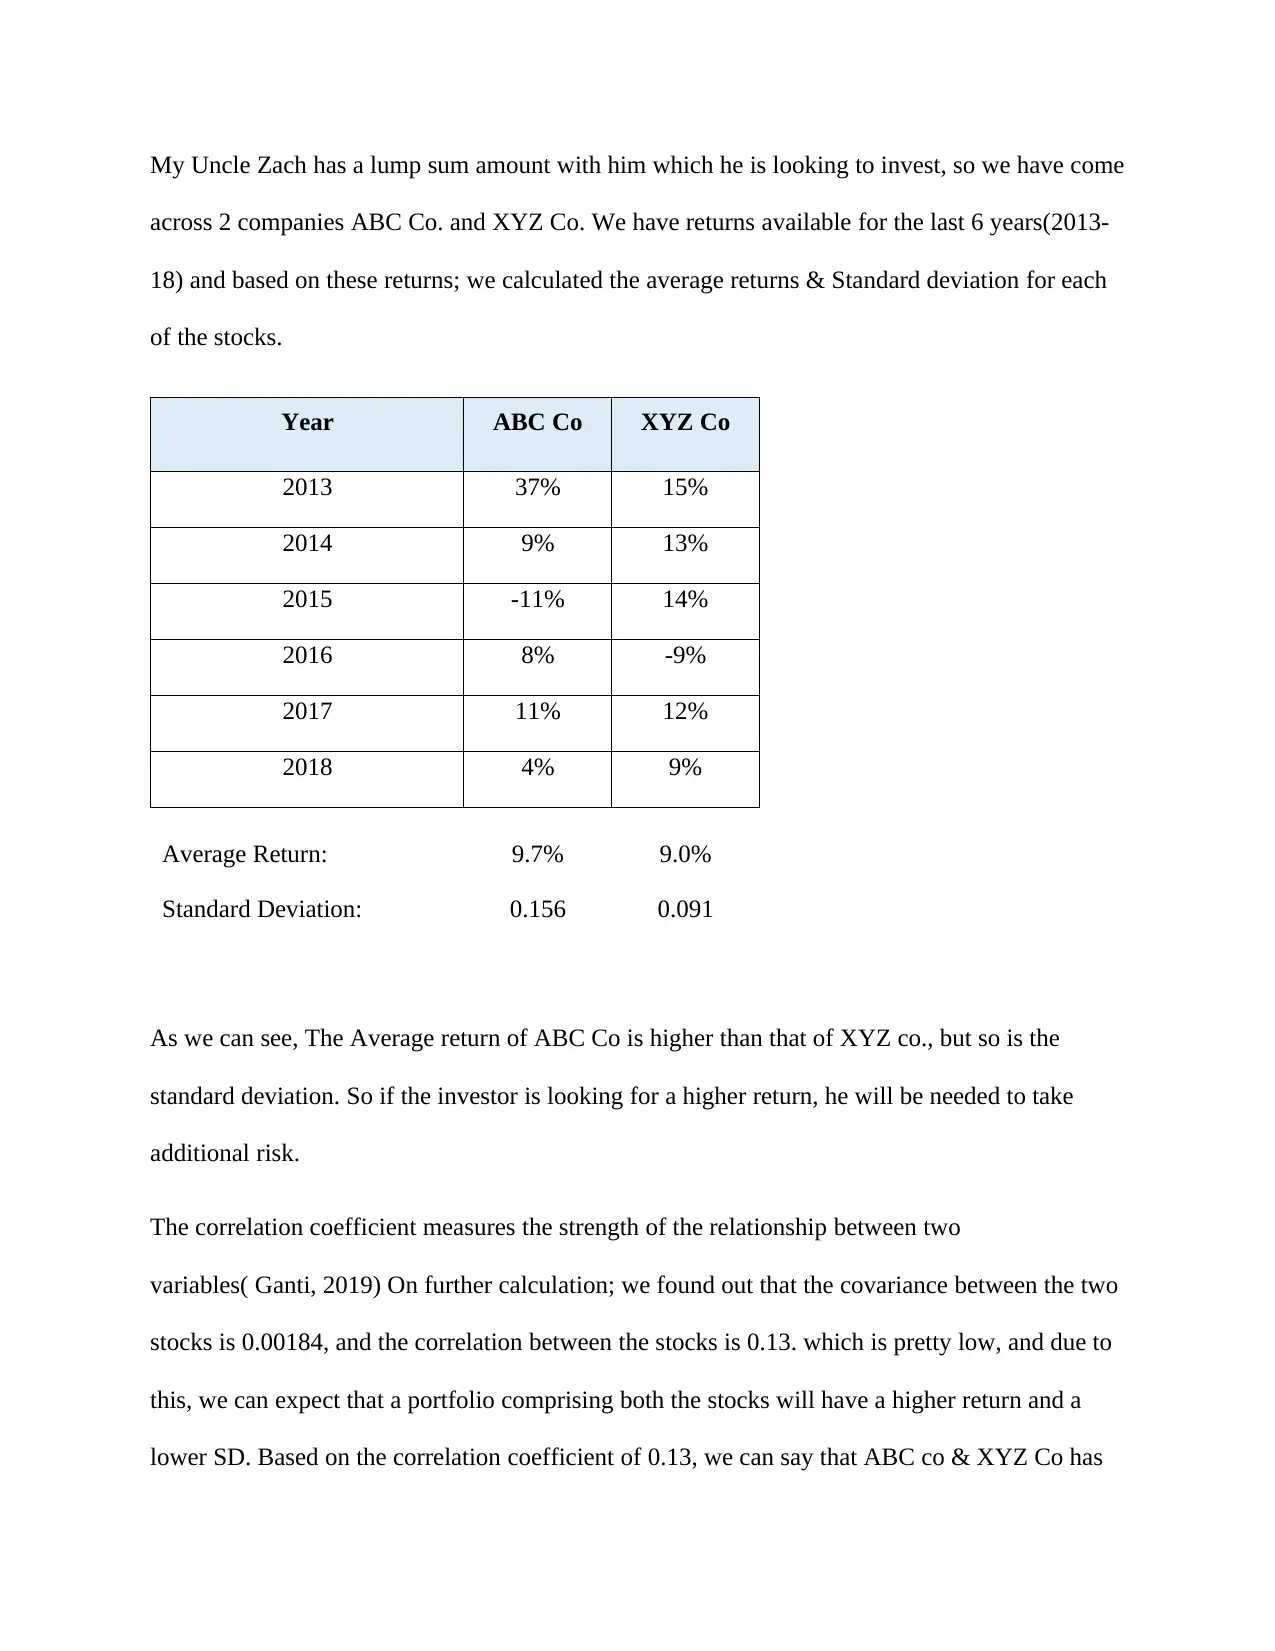
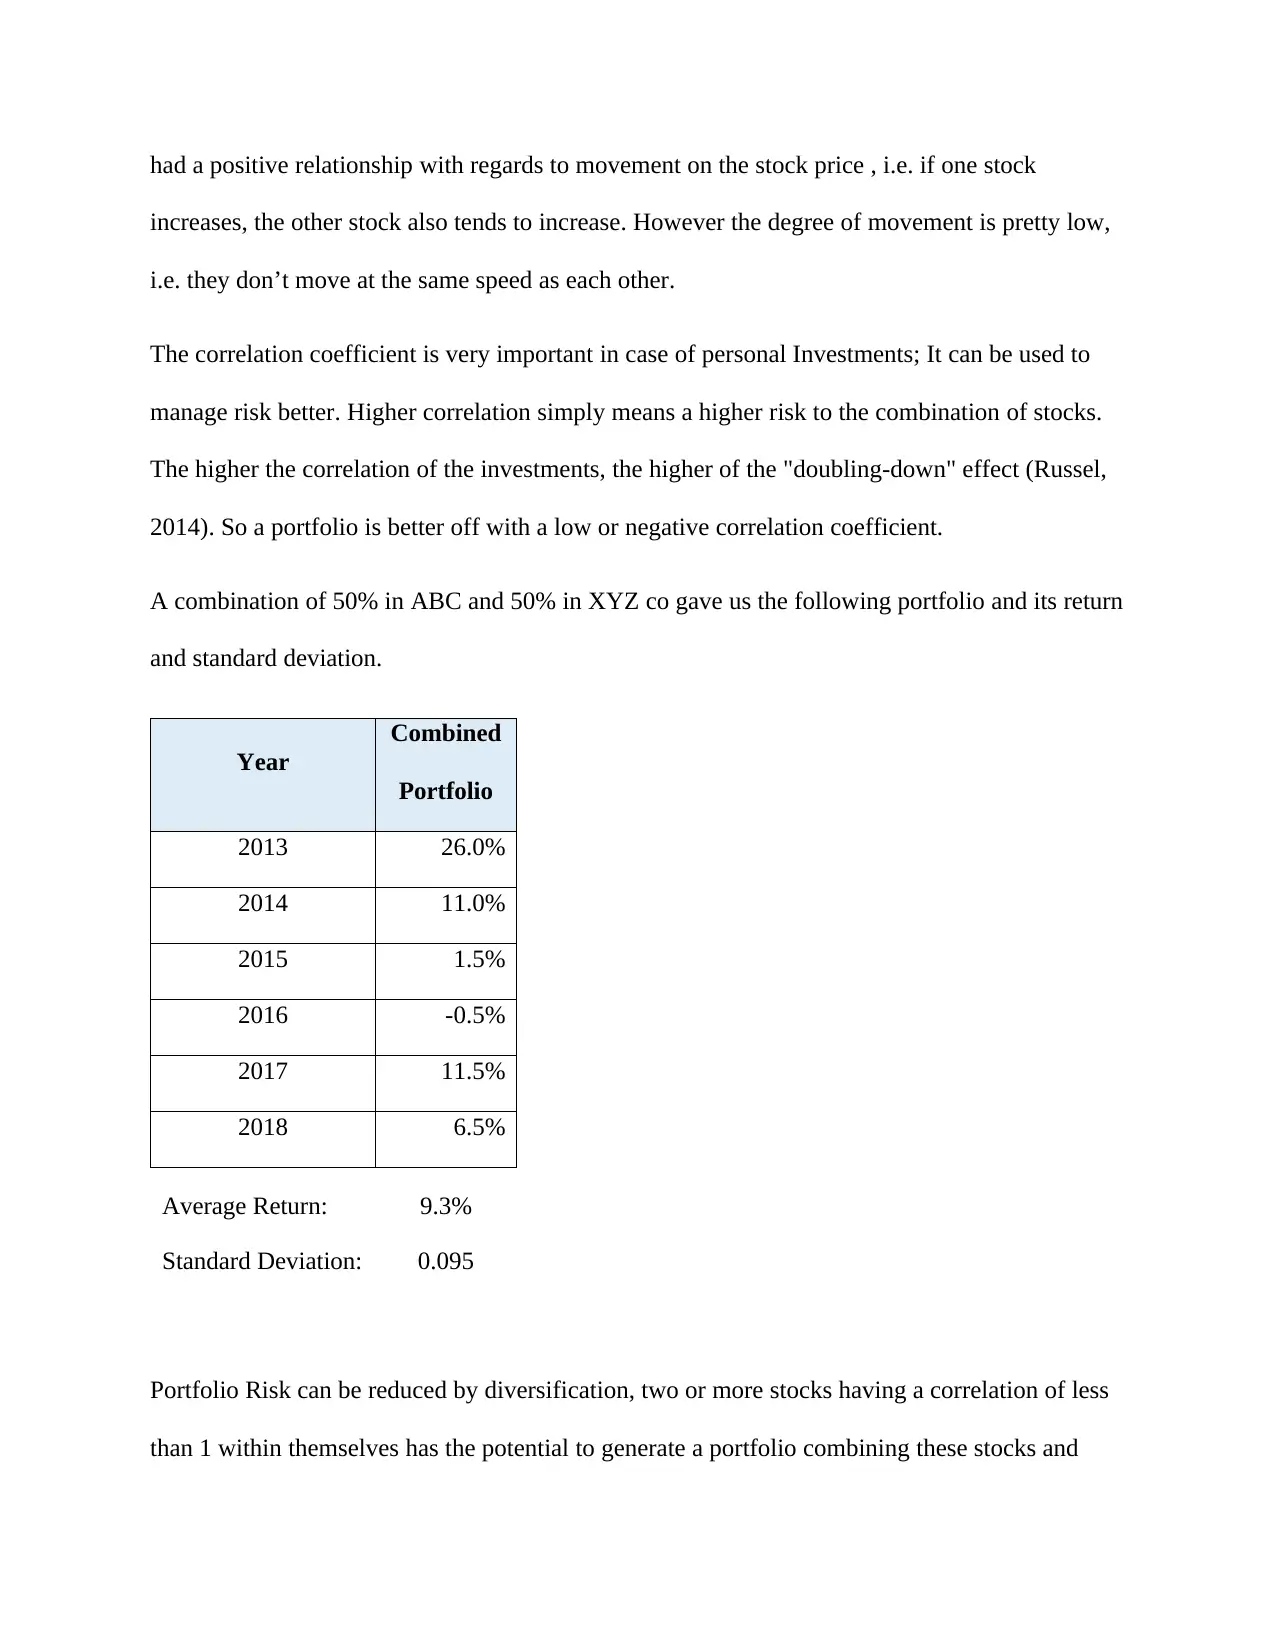
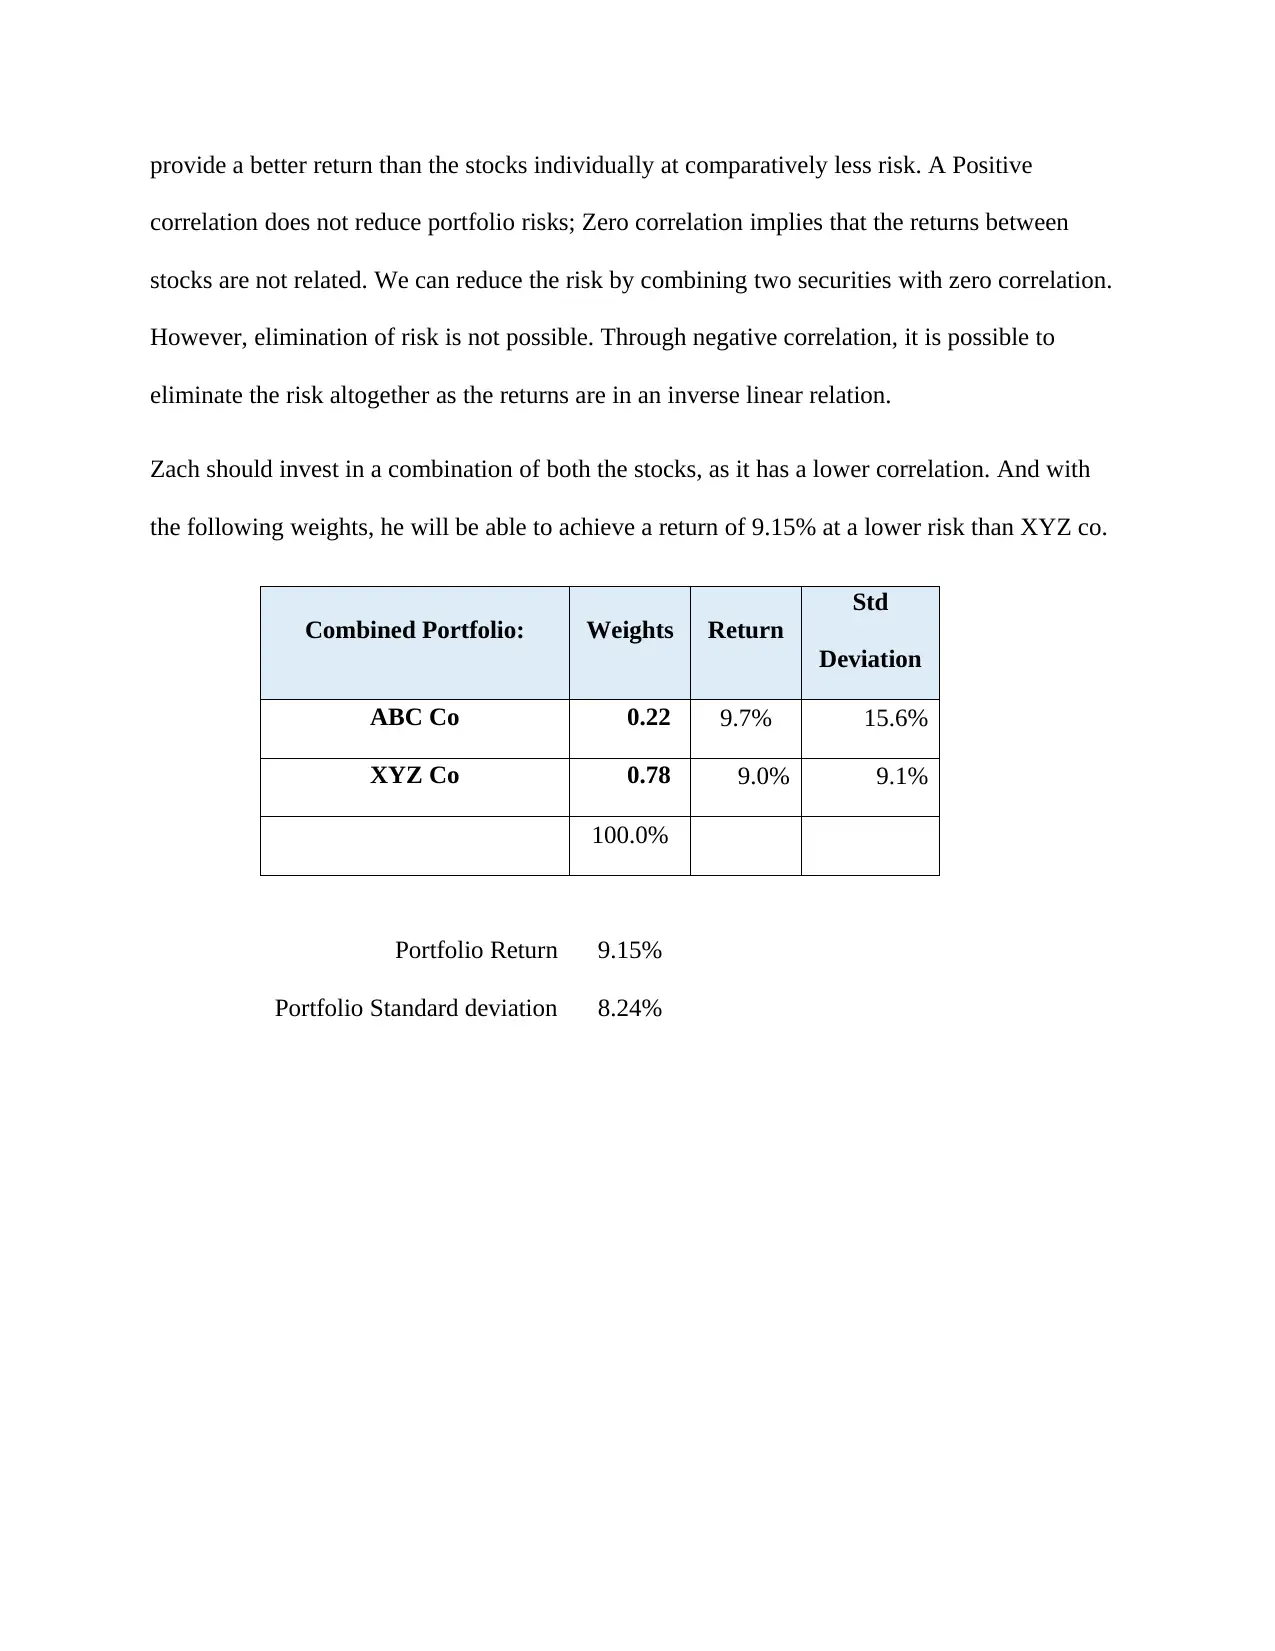
This assignment presents an analysis of two investment options, ABC Co. and XYZ Co., based on their historical returns from 2013 to 2018. The analysis calculates average returns, standard deviations, and the correlation coefficient to assess the risk and potential return of each stock. It explores the benefits of portfolio diversification, demonstrating how combining the two stocks can lead to a higher return with reduced risk compared to investing in either stock individually. The assignment suggests an optimal portfolio allocation, considering the correlation coefficient between the stocks, and discusses the importance of correlation in managing investment risk. The conclusion emphasizes the advantages of a diversified portfolio with a low correlation to achieve better risk-adjusted returns for investors. The document also contains references to several sources on asset allocation, diversification, and risk management.
Document Page
My Uncle Zach has a lump sum amount with him which he is looking to invest, so we have come
across 2 companies ABC Co. and XYZ Co. We have returns available for the last 6 years(2013-
18) and based on these returns; we calculated the average returns & Standard deviation for each
of the stocks.
Year ABC Co XYZ Co
2013 37% 15%
2014 9% 13%
2015 -11% 14%
2016 8% -9%
2017 11% 12%
2018 4% 9%
Average Return: 9.7% 9.0%
Standard Deviation: 0.156 0.091
As we can see, The Average return of ABC Co is higher than that of XYZ co., but so is the
standard deviation. So if the investor is looking for a higher return, he will be needed to take
additional risk.
The correlation coefficient measures the strength of the relationship between two
variables( Ganti, 2019) On further calculation; we found out that the covariance between the two
stocks is 0.00184, and the correlation between the stocks is 0.13. which is pretty low, and due to
this, we can expect that a portfolio comprising both the stocks will have a higher return and a
lower SD. Based on the correlation coefficient of 0.13, we can say that ABC co & XYZ Co has
tabler-icon-diamond-filled.svg

Paraphrase This Document

Need a fresh take? Get an instant paraphrase of this document with our AI Paraphraser
Document Page
had a positive relationship with regards to movement on the stock price , i.e. if one stock
increases, the other stock also tends to increase. However the degree of movement is pretty low,
i.e. they don’t move at the same speed as each other.
The correlation coefficient is very important in case of personal Investments; It can be used to
manage risk better. Higher correlation simply means a higher risk to the combination of stocks.
The higher the correlation of the investments, the higher of the "doubling-down" effect (Russel,
2014). So a portfolio is better off with a low or negative correlation coefficient.
A combination of 50% in ABC and 50% in XYZ co gave us the following portfolio and its return
and standard deviation.
Year
Combined
Portfolio
2013 26.0%
2014 11.0%
2015 1.5%
2016 -0.5%
2017 11.5%
2018 6.5%
Average Return: 9.3%
Standard Deviation: 0.095
Portfolio Risk can be reduced by diversification, two or more stocks having a correlation of less
than 1 within themselves has the potential to generate a portfolio combining these stocks and
Document Page
provide a better return than the stocks individually at comparatively less risk. A Positive
correlation does not reduce portfolio risks; Zero correlation implies that the returns between
stocks are not related. We can reduce the risk by combining two securities with zero correlation.
However, elimination of risk is not possible. Through negative correlation, it is possible to
eliminate the risk altogether as the returns are in an inverse linear relation.
Zach should invest in a combination of both the stocks, as it has a lower correlation. And with
the following weights, he will be able to achieve a return of 9.15% at a lower risk than XYZ co.
Combined Portfolio: Weights Return
Std
Deviation
ABC Co 0.22 9.7% 15.6%
XYZ Co 0.78 9.0% 9.1%
100.0%
Portfolio Return 9.15%
Portfolio Standard deviation 8.24%
Document Page
References:
Asset Allocation and Diversification, Available at:
http://stockcharts.com/school/doku.php?
id=chart_school:overview:asset_allocation_and_diversification(17th May 2019)
Ganti, A.(2019), Correlation Coefficient, Available at:
https://www.investopedia.com/terms/c/correlationcoefficient.asp (17th May 2019)
Portfolio Diversification: The Optimal Way of Risk Reduction, Available at:
https://www.ifcm.capital/portfolio-trading-analysis/portfolio-diversification-risk-
reduction/(17th May 2019)
Russel. R(2014), ABCs Of Investing: Alpha, Beta And Correlation, Available at:
https://www.forbes.com/sites/robrussell/2014/07/15/abcs-of-investing-for-experienced-
investors/#298a702393fc (17th May 2019)
chevron_up_icon
1 out of 4
circle_padding
hide_on_mobile
zoom_out_icon
[object Object]