125.250 Financial Modeling Project: Risk & Return Analysis of NZX 50
VerifiedAdded on 2023/06/04
|11
|2406
|294
Project
AI Summary
This financial modeling project assesses the investment potential of Westpac Bank (WBK) and Australia and New Zealand Bank (ANZ), both listed on the NZX 50. The analysis includes calculating average returns, statistical summaries, and annual returns over a three-year period. T-tests are performed to evaluate the fluctuations in stock prices, and portfolio performance is analyzed to determine optimal investment strategies, including a minimum variance portfolio. The project concludes that while ANZ generally offers a better return with lower risk, a diversified portfolio can further enhance returns and reduce risk. The report recommends investment strategies based on individual risk tolerance, highlighting the benefits of a 50/50 portfolio or a minimum variance approach with a higher allocation to ANZ. Desklib provides access to this and similar solved assignments to aid students in their studies.
Running Head: Financial modelling
1
Project Report: Financial modelling
1
Project Report: Financial modelling
Paraphrase This Document
Need a fresh take? Get an instant paraphrase of this document with our AI Paraphraser
Financial modelling
2
Contents
Introduction:.....................................................................................................................3
Company overview:..........................................................................................................3
Average return:.................................................................................................................4
Statistical summary:..........................................................................................................5
Histogram:........................................................................................................................6
Annual return:...................................................................................................................6
T test:................................................................................................................................6
Portfolio performance:......................................................................................................7
Minim variance portfolio:.................................................................................................7
Conclusion and recommendation:....................................................................................8
Appendix:.........................................................................................................................9
Financial modelling
3
Introduction:
Evaluation on an organization and its financial performance is one of the most
common analysis methods. It measures that whether the company would be a better option in
terms of the investment or not. Though, some of the analyst found that it is not a good basis
to predict the future performance of the business. The stock price of a business could be
fluctuated because of various factors. It must be measured and maintained by the analyst that
whether any abnormal event has taken place in the business and how much it affected the
stock price of the business.
In the case, the study has been done on two New Zealand companies to measure that
whether these companies are at better position in terms of investment in their stock. In order
to reach over a conclusion about their invetsmnt position, the average return, average annual
return, portfolio performance etc. In the report, Westpac bank and Australia and New Zealand
bank has been taken into the concern to measure the overall performance of the companies
and the better stock in terms of investment.
Company overview:
Westpac bank:
Westpac bank is an Australian and New Zealand bank which provides the financial
services at global level. The company is operating its services at worldwide. The company is
in the top 4 banks of the Australian market. According to current report, the company has 14
million customers along with the 40,000 employees who are serving the customers of the
bank at their best. The main product of the company includes finance and insurance,
corporate banking, investment banking, private equity, mortgages, global wealth management
etc. The company is operating its business from last 36 years in the Australian and New
Zealand market. The stock price of the company and the financial performance of the
company are also depicting about a huge room for growth.
Australia and New Zealand bank:
⊘ This is a preview!⊘
Do you want full access?
Subscribe today to unlock all pages.
Trusted by 1+ million students worldwide
Financial modelling
4
Australia and New Zealand bank is an Australian and New Zealand bank which is
commonly known as ANZ. The bank provides the various types of financial services at
global level. The company is offering its services at various countries. The bank if the largest
bank in the New Zealand market. The company is in the top 4 banks of the Australian market.
According to current report, the company has its operations in 34 countries along with the
50,152 employees who are serving the customers of the bank at their best. The main product
of the company includes finance and insurance, corporate banking, investment banking,
private equity, mortgages, global wealth management etc. The company is operating its
business from last 183 years in the Australian and New Zealand market. The financial
position and stock market position of the business is quite impressive.
Average return:
The stock price of both the stock has been collected from last 3 years in order to
measure that how much changes and fluctuations have occurred into the stock price of both
the companies. In order to measure the changes and total improvements in the stock price of
the company, the return of each of the stock has been measured. The stock price of present
day has been compared with the previous day and it has been measured that how much
changes have occurred into the stock price of the company.
In case of Westpac bank, it has been found that the stock price of the company was $
17.6 on the date of 6/10/2015 which has been fluctuated to $ 19.25 on the date of 5th Oct
2018. It explains that the various ups and downs have occurred into the stock price of the
business but overall, the positive changes have taken place into the stock of the company.
Further, the study has been done on ANZ stock.
Through the stock price of ANZ, it has been found that the fluctuations level in the
company is quite higher. The stock price of the company has been fluctuated at daily basis
with a great number. On the date of 6th Oct 2015, the stock price of the company was 23.14
which have been improved to $ 27.49 on 5th Oct 2018. It explains that various ups and downs
have occurred into the stock price of the business but overall, the positive changes have taken
place into the stock of the company.
Paraphrase This Document
Need a fresh take? Get an instant paraphrase of this document with our AI Paraphraser
Financial modelling
5
Statistical summary:
On the basis of the evaluation on overall stock price of last 3 years and the changes into
the stock price of the company, various measurement tools have been applied on the stock
price of companies in order to identify that which company is performing better in the
industry. Firstly, the average return of both the stock has been calculated to measure the
overall changes into the stock price of the company and the expected return from the stock of
the company.
In case of WBK, it has been found that the average return of the company in last 3
years is 0.02%. The overall changes into the stock price of the company were 0.02% on daily
basis. Further, in case of ANZ, it has been measured that the average return of the stock is
0.03% which is higher than the stock of WBK. It explains that the daily average return of
ANZ is better and the company would offer better return the ABK stock.
However, the average return is not the only factors on the basis of which, a stock is
examined. The associated risk level is also important in a business. standard deviations
techniques has been applied on both the companies which measures the volatility in the stock
price and explains that which stock is more riskier in terms of investment. In case of WBK
and ANZ, it has been found that the beta is 0.129 and 0.07 respectively. It explains that the
associated risk of both the stocks is quite minimal. It explains that the volatility in the stocks
are lower and even the fluctuations in the ANZ stocks are lowest in the industry. It explains
that the return level of the stock is higher along with the lesser risk.
Further, the correlation of the stock has been found against the ^NZ 50 stock to
measures that which stock is running independently and on the basis of which stock, the NZ
process are fluctuating more. Through the study we have found that the correlation of WBK
and ANZ are 0.052 and 0.03 which explains that both the stock is deriving the stock price of
NZ at same level.
Financial modelling
6
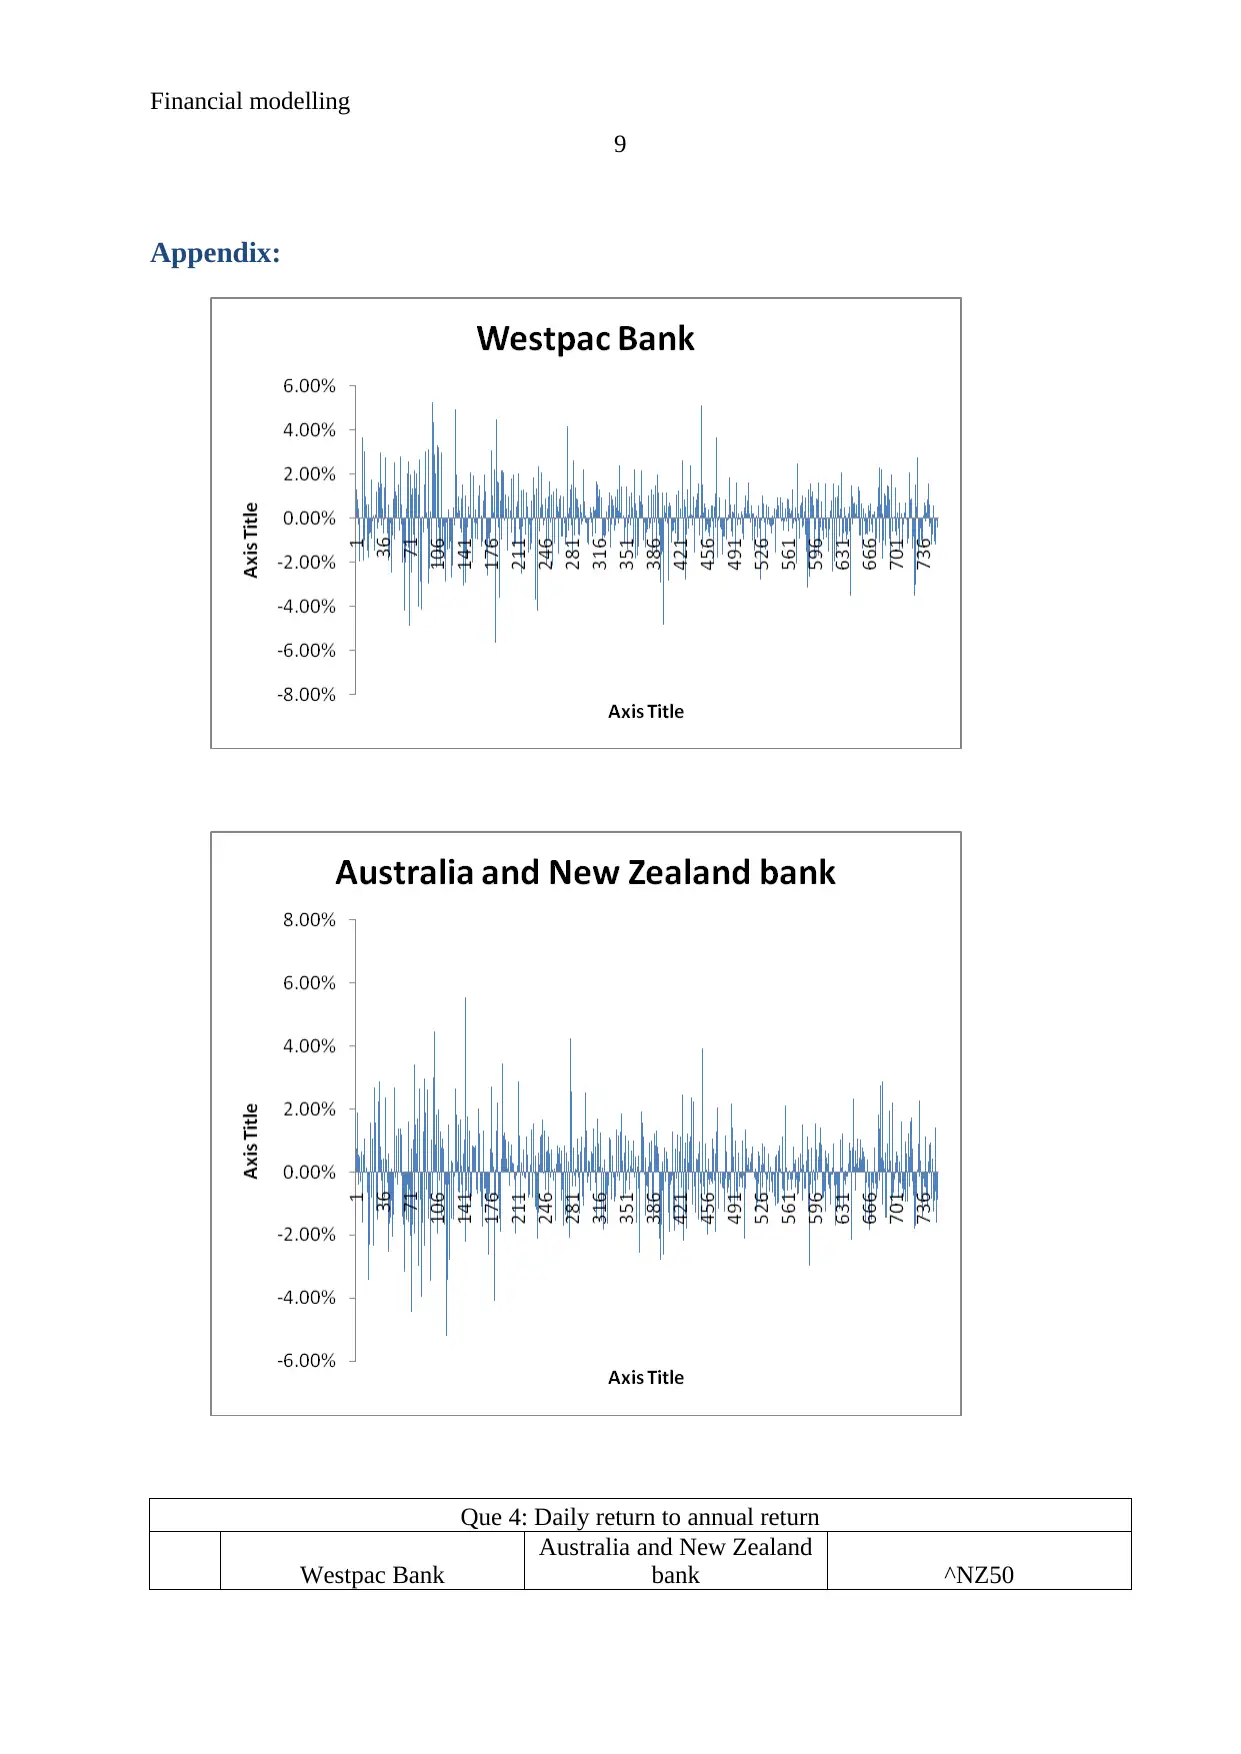
Histogram:
In order to identify and understand the changes into the stock price, the histogram graph
of both the stocks have been represented in the appendix.
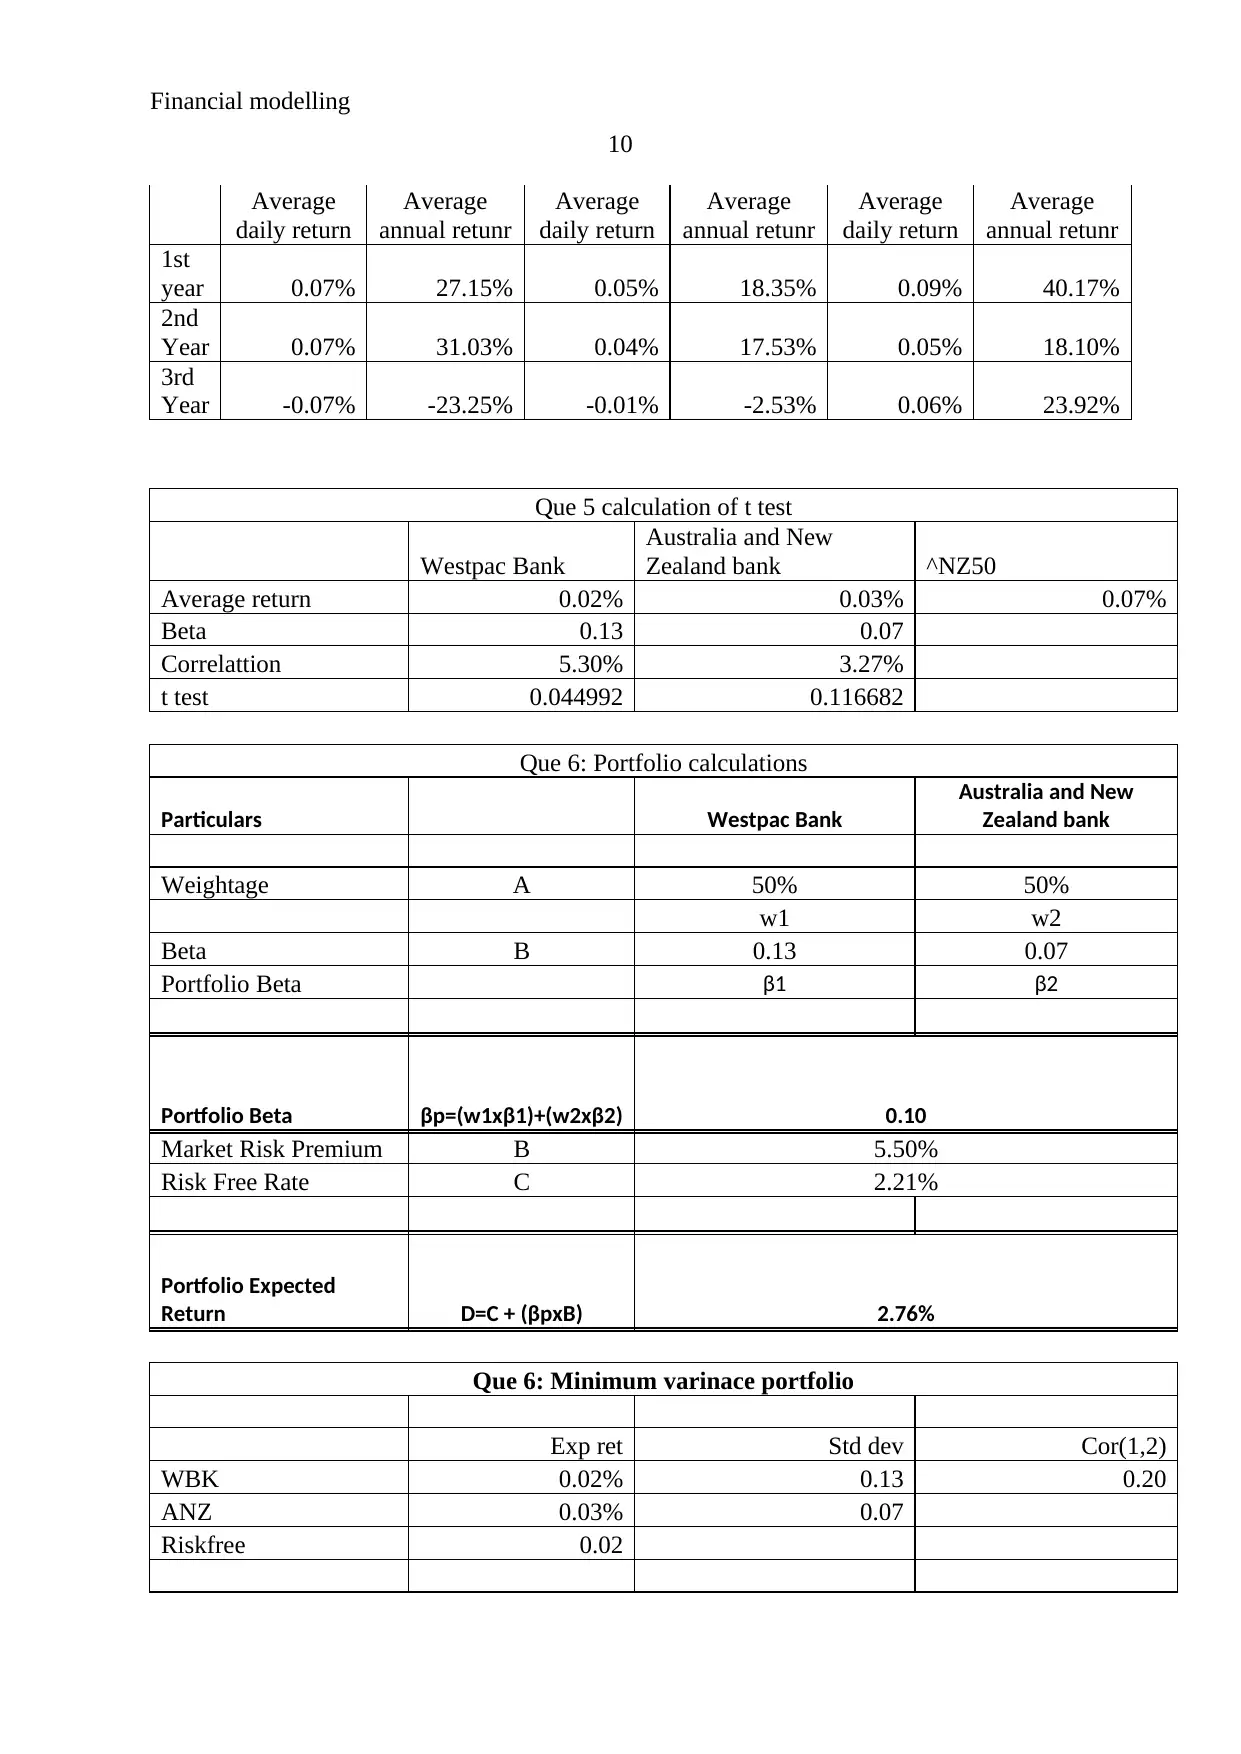
Annual return:
The annual return of both the stocks has been calculated further in order to identify
the changes into the stock price of the company annually. Through the study on Westpac
bank, it has been measured that the annual return of the stock of the company is 27.15%,
31.03% and -23.25% in 1st year, 2nd year and 3rd year respectively. It explains that at initial
level, the stock price of the company has been improved at great extent. The huge positive
changes have taken place in the stock price of the company. But along with the time, the
reduction has been seen in the stock price of the company. It explains that the currently,
negative changes have taken place into the business. Though, it has occurred due to abnormal
situation in the company.
Further, in case of ANZ, it has been measured that the annual return of the stock of
the company is 18.35%, 17.53% and -2.53% in 1st year, 2nd year and 3rd year respectively. It
explains that at initial level, the stock price of the company has been improved at great extent.
The huge positive changes have taken place in the stock price of the company. But in the
third year, few reductions have been seen in the stock price of the company. It explains that
the currently, abnormal situation and the industrial factors have affected the stock price of the
company.
T test:
T test has applied on both the stocks further to measure the changes into their average
level. On the basis of the t test of both the stocks, it has been found that the WBK explains
0.044 level of mean whereas the ANB explains about 0.11 level of the business. It explains
that the chances in the fluctuations of the stock price of the company are 0.044 and 0.11
respectively which explains about better changes in both the stock.
6
Histogram:
In order to identify and understand the changes into the stock price, the histogram graph
of both the stocks have been represented in the appendix.
Annual return:
The annual return of both the stocks has been calculated further in order to identify
the changes into the stock price of the company annually. Through the study on Westpac
bank, it has been measured that the annual return of the stock of the company is 27.15%,
31.03% and -23.25% in 1st year, 2nd year and 3rd year respectively. It explains that at initial
level, the stock price of the company has been improved at great extent. The huge positive
changes have taken place in the stock price of the company. But along with the time, the
reduction has been seen in the stock price of the company. It explains that the currently,
negative changes have taken place into the business. Though, it has occurred due to abnormal
situation in the company.
Further, in case of ANZ, it has been measured that the annual return of the stock of
the company is 18.35%, 17.53% and -2.53% in 1st year, 2nd year and 3rd year respectively. It
explains that at initial level, the stock price of the company has been improved at great extent.
The huge positive changes have taken place in the stock price of the company. But in the
third year, few reductions have been seen in the stock price of the company. It explains that
the currently, abnormal situation and the industrial factors have affected the stock price of the
company.
T test:
T test has applied on both the stocks further to measure the changes into their average
level. On the basis of the t test of both the stocks, it has been found that the WBK explains
0.044 level of mean whereas the ANB explains about 0.11 level of the business. It explains
that the chances in the fluctuations of the stock price of the company are 0.044 and 0.11
respectively which explains about better changes in both the stock.
⊘ This is a preview!⊘
Do you want full access?
Subscribe today to unlock all pages.
Trusted by 1+ million students worldwide
Financial modelling
7
Portfolio performance:
After evaluation on both the stock prices, it has been measured that the changes,
return, risk etc kevel of both the stocks are quite similar, few changes are there in the stock
price of the companies. If the investment in both the companies would be done than the
return and the risk level of the investors could be reduced. 50%-50% investment in both the
companies could improve the level of return and reduce the level of associated risk with it.
On the basis of the portfolio calculations, it has been found that the portfolio risk of
the business is 0.10 which is lower than the stock price of WBK. However, the risk level of
the ANZ is lower than that. Further the expected return from the projects has been measure
and it has been found that along with reduced rate of risk, investors would be able to get
2.76% return from the investment into the portfolio which is better choice in terms of higher
return.
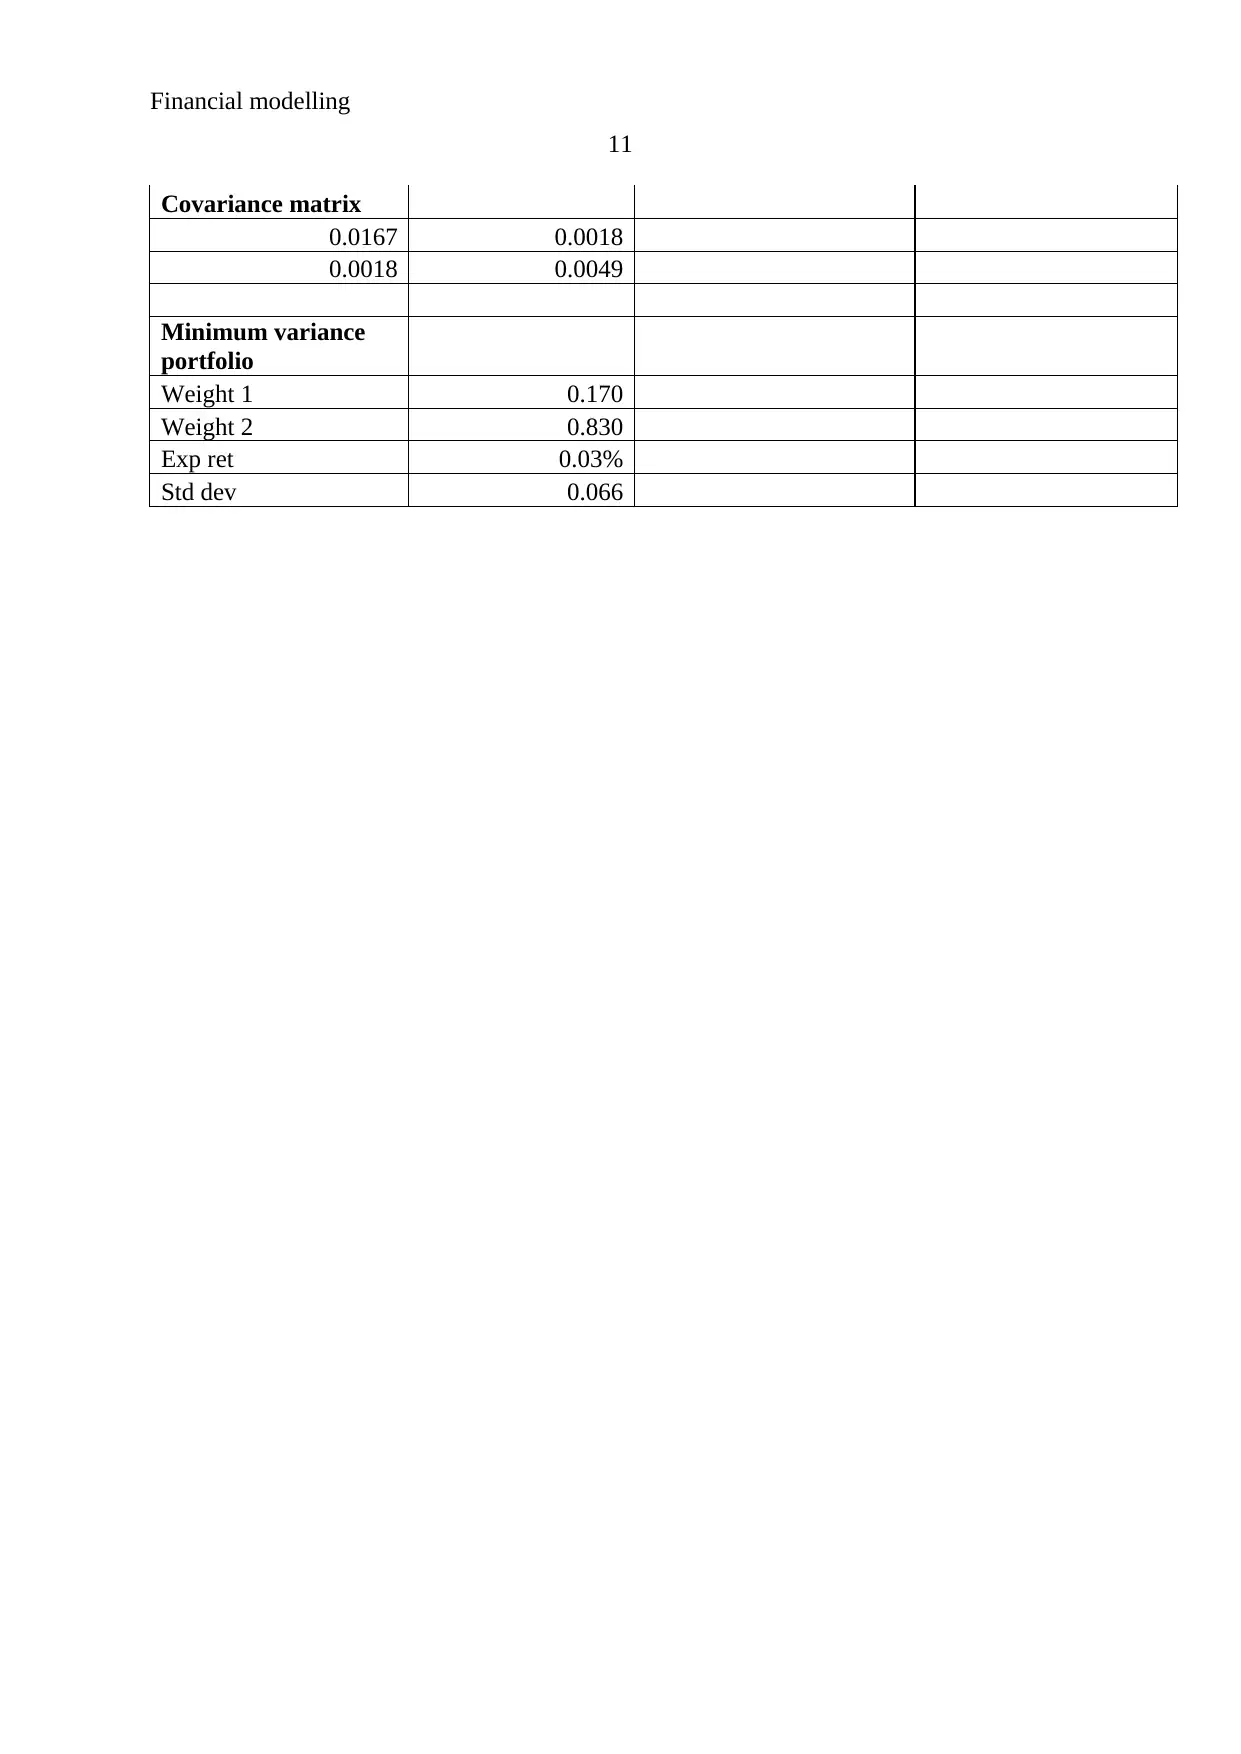
Minim variance portfolio:
Further, if the investors do not want to invest into the stock because of the risk level,
than the minimum variance portfolio tool has been applied. The minimum variance portfolio
explains that the risk level fo the investment would be a lowest. In case of WBK and ANZ, it
has been measured that if the weight of WBK stock would be 17% and the weight of ANZ
bank becomes 83% than the beta of portfolio would be 0.66 which is lowest. It explains that
if an investor do not want to get involved in any kind of risk than it is the better option to
make investment. In addition, in this case the return on the investment would also be lower.
Conclusion and recommendation:
On the basis of the overall study on various factors related to the stock position of
WBK and ANZ, it has been found that the volatility in the stock of ANZ are lower and even
the fluctuations in the ANZ stocks are lowest in the industry. It explains that the return level
of the stock is higher along with the lesser risk. Further, in case of annual return, it has been
found that the performance of ANZ is better. It explains that in case of single investment,
ANZ stock is better option.
7
Portfolio performance:
After evaluation on both the stock prices, it has been measured that the changes,
return, risk etc kevel of both the stocks are quite similar, few changes are there in the stock
price of the companies. If the investment in both the companies would be done than the
return and the risk level of the investors could be reduced. 50%-50% investment in both the
companies could improve the level of return and reduce the level of associated risk with it.
On the basis of the portfolio calculations, it has been found that the portfolio risk of
the business is 0.10 which is lower than the stock price of WBK. However, the risk level of
the ANZ is lower than that. Further the expected return from the projects has been measure
and it has been found that along with reduced rate of risk, investors would be able to get
2.76% return from the investment into the portfolio which is better choice in terms of higher
return.
Minim variance portfolio:
Further, if the investors do not want to invest into the stock because of the risk level,
than the minimum variance portfolio tool has been applied. The minimum variance portfolio
explains that the risk level fo the investment would be a lowest. In case of WBK and ANZ, it
has been measured that if the weight of WBK stock would be 17% and the weight of ANZ
bank becomes 83% than the beta of portfolio would be 0.66 which is lowest. It explains that
if an investor do not want to get involved in any kind of risk than it is the better option to
make investment. In addition, in this case the return on the investment would also be lower.
Conclusion and recommendation:
On the basis of the overall study on various factors related to the stock position of
WBK and ANZ, it has been found that the volatility in the stock of ANZ are lower and even
the fluctuations in the ANZ stocks are lowest in the industry. It explains that the return level
of the stock is higher along with the lesser risk. Further, in case of annual return, it has been
found that the performance of ANZ is better. It explains that in case of single investment,
ANZ stock is better option.
Paraphrase This Document
Need a fresh take? Get an instant paraphrase of this document with our AI Paraphraser

Financial modelling
8
Further, if the portfolio case is taken into the concern, than the 50%-50% investment
must be done by the investors in both the stocks to improve the performance of the return
level. and if the investor do not want to get involved in any kind of risk than it is the better
option to make investment 17% in WBK and 83% in ANZ. In addition, in this case the return
on the investment would also be lower. The investors have to make decision about the
investment on the basis of the risk and return.
Financial modelling
9
Appendix:
Que 4: Daily return to annual return
Westpac Bank
Australia and New Zealand
bank ^NZ50
9
Appendix:
Que 4: Daily return to annual return
Westpac Bank
Australia and New Zealand
bank ^NZ50
⊘ This is a preview!⊘
Do you want full access?
Subscribe today to unlock all pages.
Trusted by 1+ million students worldwide
Financial modelling
10
Average
daily return
Average
annual retunr
Average
daily return
Average
annual retunr
Average
daily return
Average
annual retunr
1st
year 0.07% 27.15% 0.05% 18.35% 0.09% 40.17%
2nd
Year 0.07% 31.03% 0.04% 17.53% 0.05% 18.10%
3rd
Year -0.07% -23.25% -0.01% -2.53% 0.06% 23.92%
Que 5 calculation of t test
Westpac Bank
Australia and New
Zealand bank ^NZ50
Average return 0.02% 0.03% 0.07%
Beta 0.13 0.07
Correlattion 5.30% 3.27%
t test 0.044992 0.116682
Que 6: Portfolio calculations
Particulars Westpac Bank
Australia and New
Zealand bank
Weightage A 50% 50%
w1 w2
Beta B 0.13 0.07
Portfolio Beta β1 β2
Portfolio Beta βp=(w1xβ1)+(w2xβ2) 0.10
Market Risk Premium B 5.50%
Risk Free Rate C 2.21%
Portfolio Expected
Return D=C + (βpxB) 2.76%
Que 6: Minimum varinace portfolio
Exp ret Std dev Cor(1,2)
WBK 0.02% 0.13 0.20
ANZ 0.03% 0.07
Riskfree 0.02
Paraphrase This Document
Need a fresh take? Get an instant paraphrase of this document with our AI Paraphraser
Financial modelling
11
Covariance matrix
0.0167 0.0018
0.0018 0.0049
Minimum variance
portfolio
Weight 1 0.170
Weight 2 0.830
Exp ret 0.03%
Std dev 0.066
11
Covariance matrix
0.0167 0.0018
0.0018 0.0049
Minimum variance
portfolio
Weight 1 0.170
Weight 2 0.830
Exp ret 0.03%
Std dev 0.066
1 out of 11
Related Documents


Your All-in-One AI-Powered Toolkit for Academic Success.
+13062052269
info@desklib.com
Available 24*7 on WhatsApp / Email
![[object Object]](/_next/static/media/star-bottom.7253800d.svg)
Unlock your academic potential
Copyright © 2020–2026 A2Z Services. All Rights Reserved. Developed and managed by ZUCOL.