Corporate Finance Report: Analysis of Risk, Return, and Portfolios

Verified

Added on  2019/10/30

|9
|1912
|327
Report
AI Summary
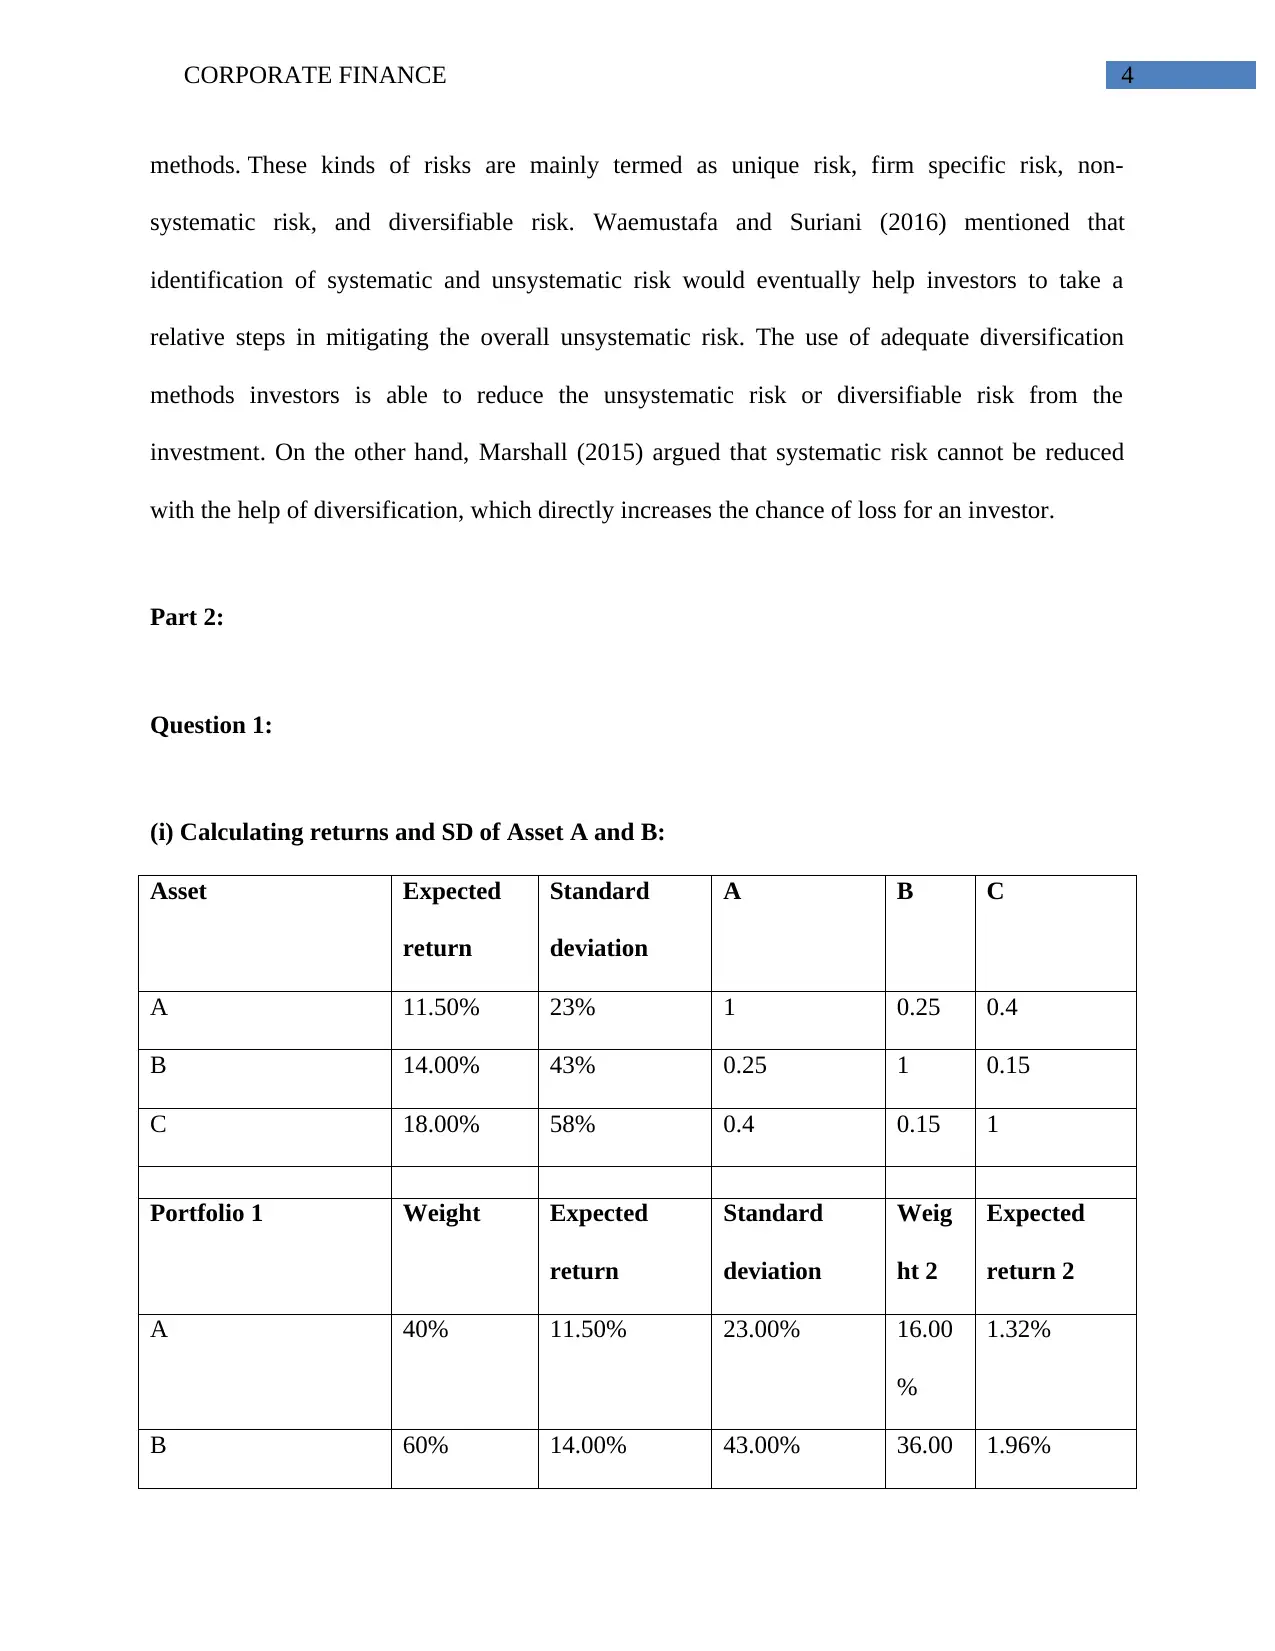
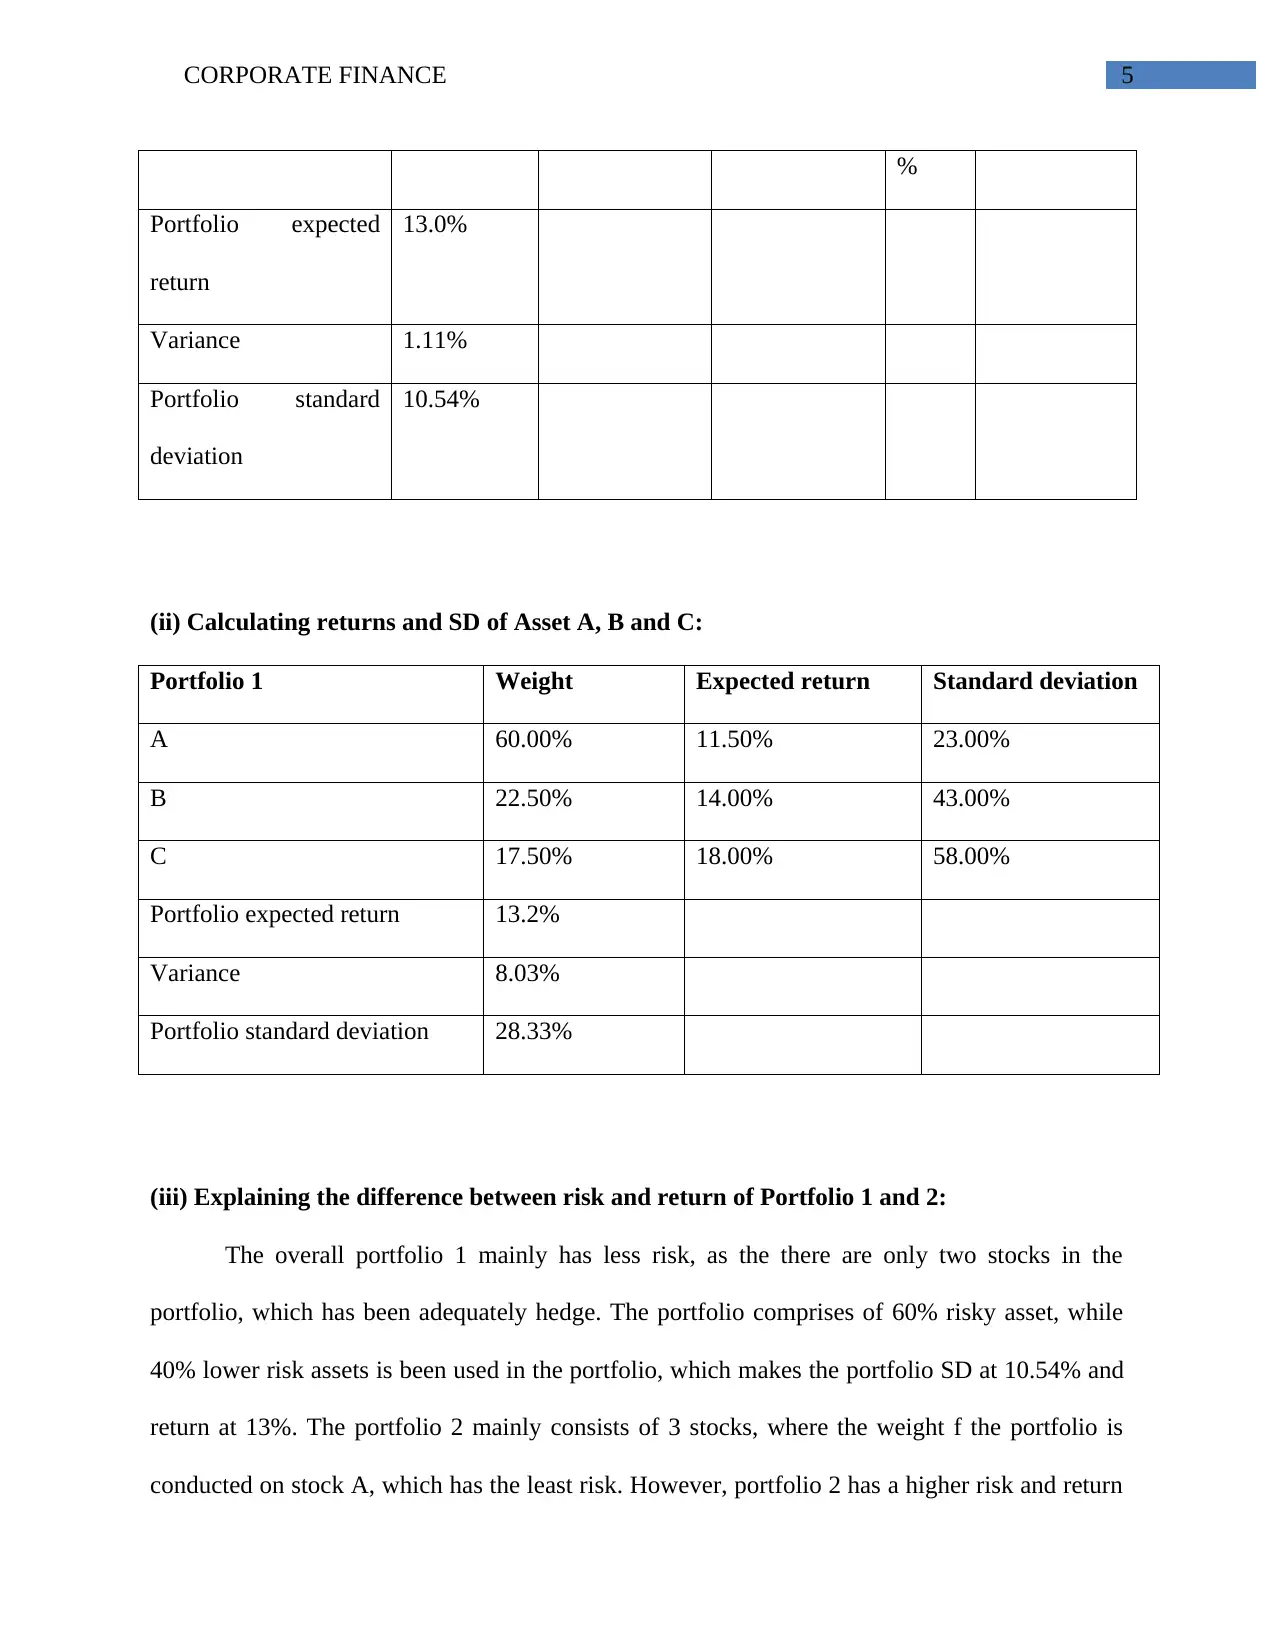
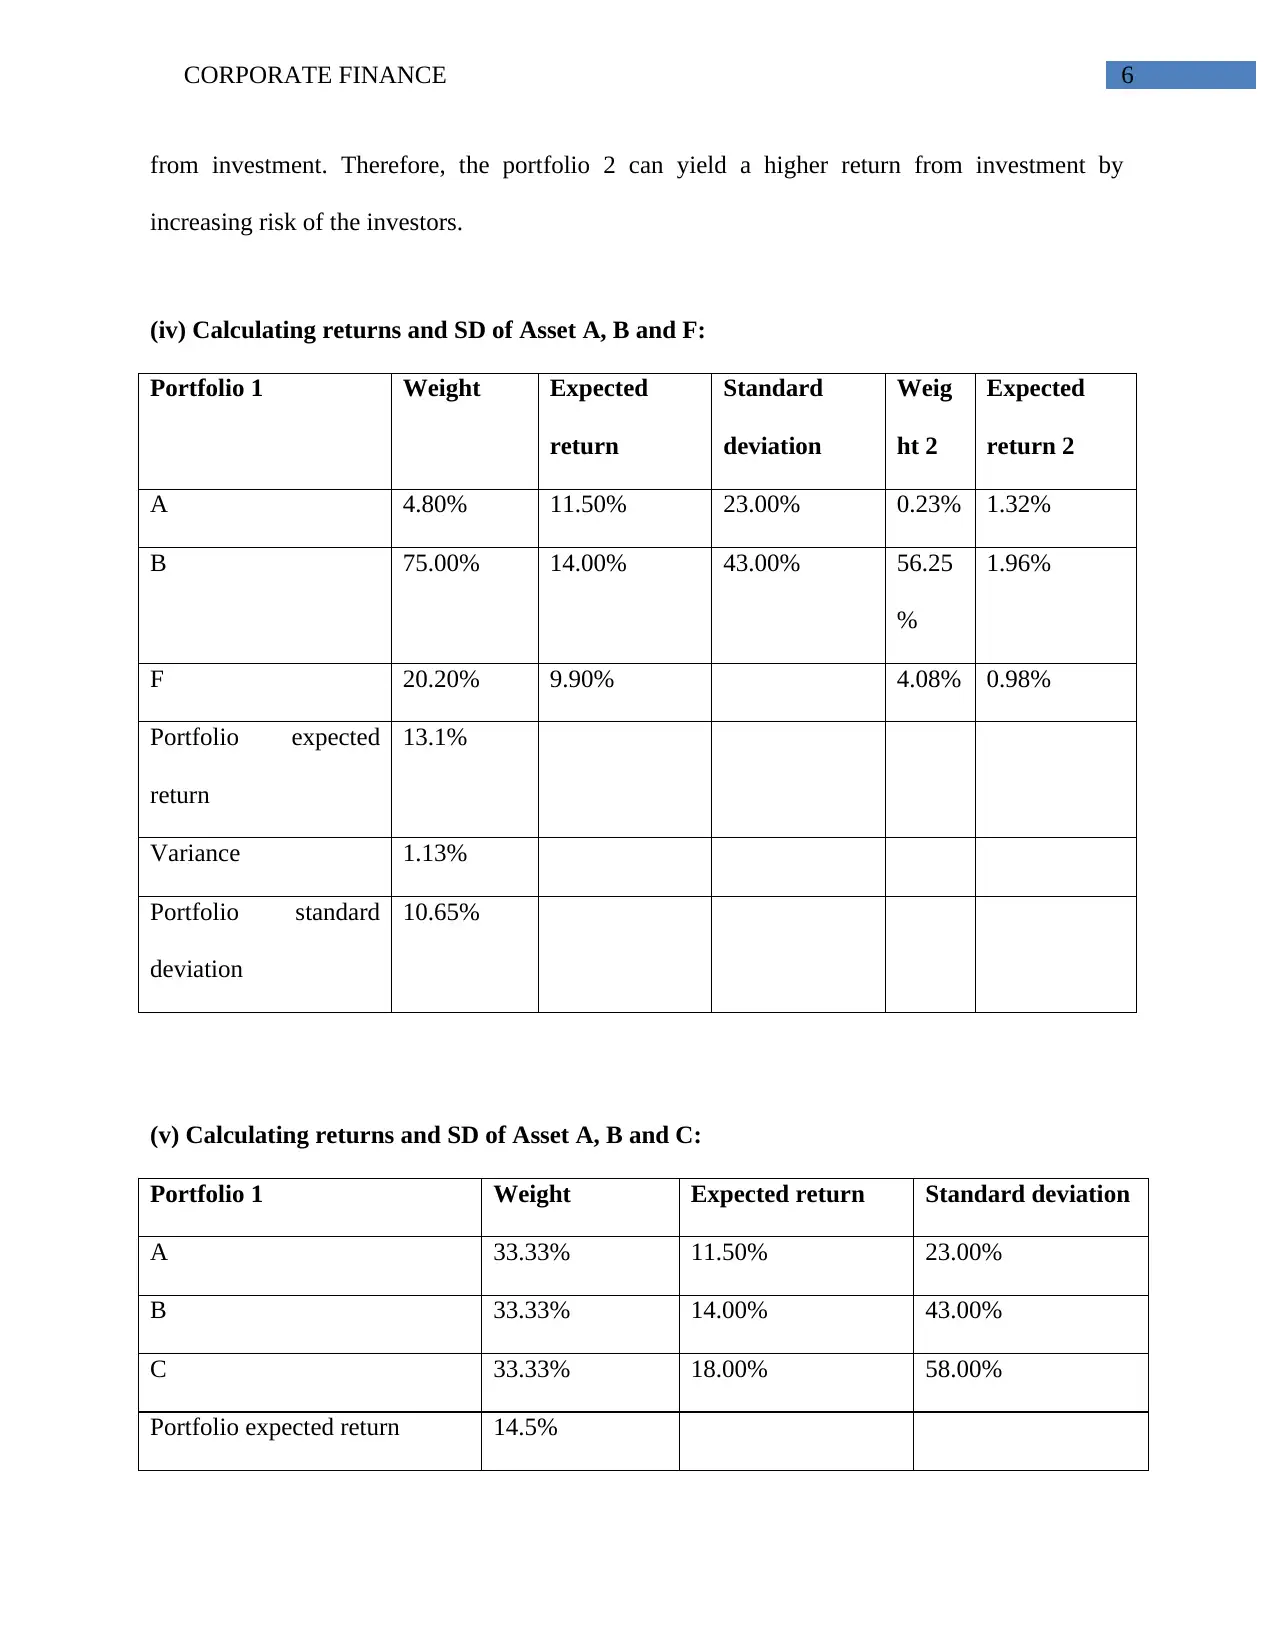
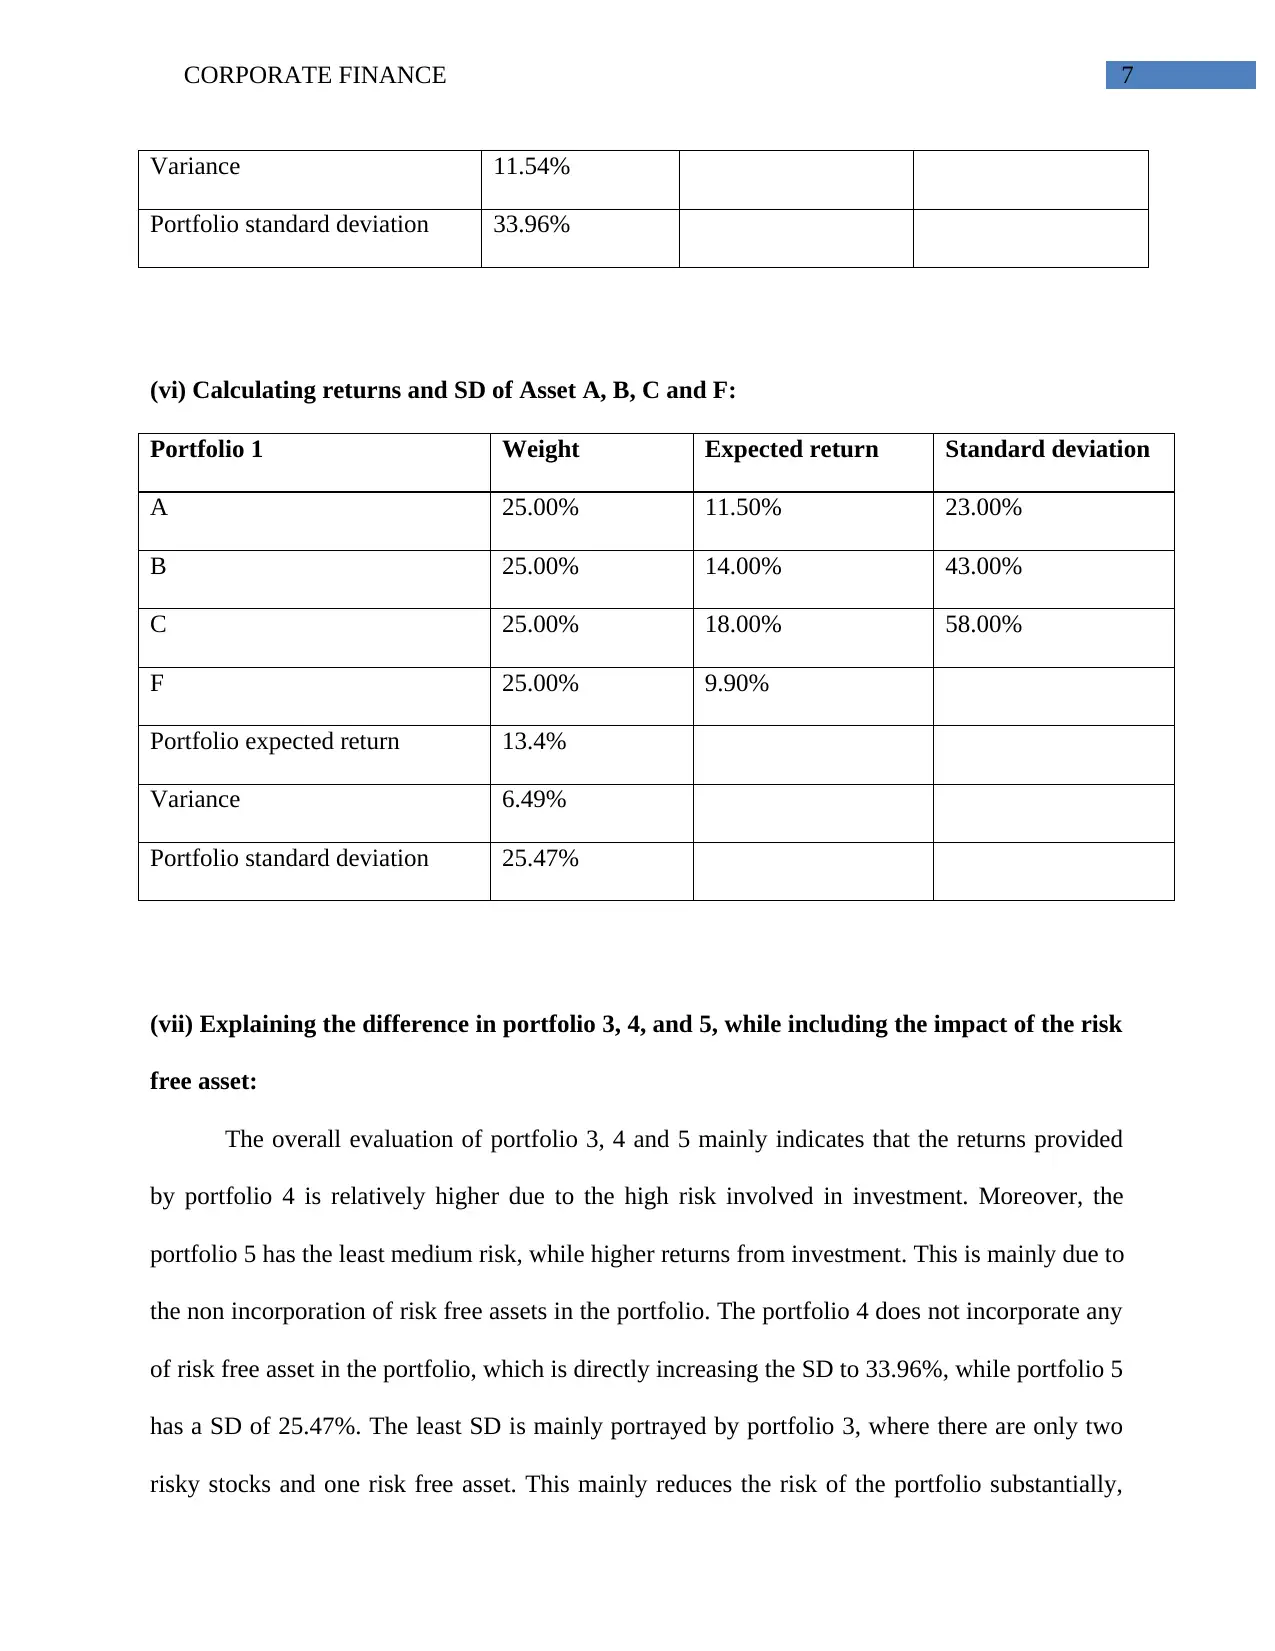
This report delves into key concepts of corporate finance, including risk assessment, return calculations, and portfolio management. The report begins by explaining how standard deviation is used to calculate the risk of shares and how adding more shares impacts portfolio risk and return. It also discusses the role of risk-free assets in portfolio risk calculation and distinguishes between systematic and unsystematic risk. Part 2 of the report provides detailed calculations of returns and standard deviations for different asset combinations and portfolios, analyzing the impact of diversification and the inclusion of a risk-free asset. The analysis includes comparisons between portfolios with varying levels of risk and return, offering insights into investment strategies. The report concludes with a synthesis of the findings, highlighting the trade-offs between risk and return in different portfolio configurations.
Document Page
Running head: CORPORATE FINANCE
Corporate Finance
Name of the Student:
Name of the University:
Author’s Note:
tabler-icon-diamond-filled.svg

Paraphrase This Document

Need a fresh take? Get an instant paraphrase of this document with our AI Paraphraser
Document Page
1CORPORATE FINANCE
Table of Contents
Part 1:...............................................................................................................................................2
Question 1: Explaining how risk of shares can be calculated by the standard deviation................2
Question 2: Explaining how adding more shares to a portfolio can affect the risk return..............2
Question 3: Explaining if one of the two assets is risk free asset then identifying the calculation
of risk from two assets.....................................................................................................................3
Question 4: Explaining the distinction between systematic and unsystematic risk.........................3
Part 2:...............................................................................................................................................4
Question 1:.......................................................................................................................................4
(i) Calculating returns and SD of Asset A and B:...........................................................................4
(ii) Calculating returns and SD of Asset A, B and C:......................................................................5
(iii) Explaining the difference between risk and return of Portfolio 1 and 2:..................................5
(iv) Calculating returns and SD of Asset A, B and F:.....................................................................6
(v) Calculating returns and SD of Asset A, B and C:......................................................................6
(vi) Calculating returns and SD of Asset A, B, C and F:.................................................................7
(vii) Explaining the difference in portfolio 3, 4, and 5, while including the impact of the risk free
asset:................................................................................................................................................7
References:......................................................................................................................................9
Document Page
2CORPORATE FINANCE
Part 1:
Question 1: Explaining how risk of shares can be calculated by the standard deviation
The overall standard deviation is mainly calculated with the help of mathematical
measurement, which directly averages the overall variance of the returns provided by the stock.
Moreover standard deviation is also identified as the Dispersion of the set of data from its mean.
this could eventually help in calculating as a square root of the variance that is derived from the
return. The overall standard deviation mainly helps in identifying the volatility that a stock could
have from the average return projected yearly. There are different types of data that is evaluated
with the help of standard deviation, if the data point is further from the mean there is higher
deviation and volatility in stock. Standard deviation is used in identifying the historical volatility
of a stock, which could directly help in detecting the overall variations and returns that could be
projected from an investment (Adamczyk et al. 2014).
Question 2: Explaining how adding more shares to a portfolio can affect the risk return
From the evaluation of the article Simon Hoyle’s there is no explanation on the risk
factor, if overall investor decides to buy more shares. However, buying of different stocks
mainly helps in diversifying the overall portfolio, which acts as an adequate hedging measure
that could increase return from investment and reduce the negative impact of capital market
volatility. Hence, use of more shares could eventually help in improving the relevant returns that
could be generated from portfolio. Investors mainly use more than one stock in a portfolio by
evaluating the correlation and coefficient condition. This evaluation of the overall correlation
and coefficient condition mainly helps in identifying stocks that have negative correlation with
Document Page
3CORPORATE FINANCE
each other. This could eventually help in reducing the risk from investment. Furthermore, the
evaluation of the standard deviation is also essential, as it helps in portraying the overall risk
from investment. Cho, et al. (2017) mentioned that investors with the help of correlation
coefficient are able to select stocks that could nullify the negative impact from capital market.
Question 3: Explaining if one of the two assets is risk free asset then identifying the
calculation of risk from two assets
The overall standard deviation equation mainly uses two different types of Assets and the
risk factor for determining the overall portfolio risk. Therefore, if one of the assets in the
portfolio is risk free asset, then the standard deviation for one asset will be zero. This will mainly
indicate that the overall standard deviation equation will portray only the risk of one stock and
neglect the risk free return risk. The equation will mainly reduce to zero after the stock weight is
multiplied by standard deviation. Hence, it could be understood that risk of the portfolio will
only come on one assets weight and standard deviation, if the other stock is risk free asset. Aıt-
Bodie (2013) mentioned that investors by using the risk free asset in portfolio are mainly able to
reduce the risk from investment and generate higher returns. On the other hand, Sahalia and
Felix (2015) argued that risk free asset provides a constant return and there is no chance of
progress, where investors cannot hop on the rising return provided from the capital market.
Question 4: Explaining the distinction between systematic and unsystematic risk
The risk that remains after using the diversification is mainly known as market risk,
which directly attributes to the market risk source. These types of risk are also known as
systematic risk or non-diversifiable risk, which cannot be reduced by the investors. There are
different types of risk that can be mitigated by investors with adequate diversification
tabler-icon-diamond-filled.svg

Paraphrase This Document

Need a fresh take? Get an instant paraphrase of this document with our AI Paraphraser
Document Page
4CORPORATE FINANCE
methods. These kinds of risks are mainly termed as unique risk, firm specific risk, non-
systematic risk, and diversifiable risk. Waemustafa and Suriani (2016) mentioned that
identification of systematic and unsystematic risk would eventually help investors to take a
relative steps in mitigating the overall unsystematic risk. The use of adequate diversification
methods investors is able to reduce the unsystematic risk or diversifiable risk from the
investment. On the other hand, Marshall (2015) argued that systematic risk cannot be reduced
with the help of diversification, which directly increases the chance of loss for an investor.
Part 2:
Question 1:
(i) Calculating returns and SD of Asset A and B:
Asset Expected
return
Standard
deviation
A B C
A 11.50% 23% 1 0.25 0.4
B 14.00% 43% 0.25 1 0.15
C 18.00% 58% 0.4 0.15 1
Portfolio 1 Weight Expected
return
Standard
deviation
Weig
ht 2
Expected
return 2
A 40% 11.50% 23.00% 16.00
%
1.32%
B 60% 14.00% 43.00% 36.00 1.96%
Document Page
5CORPORATE FINANCE
%
Portfolio expected
return
13.0%
Variance 1.11%
Portfolio standard
deviation
10.54%
(ii) Calculating returns and SD of Asset A, B and C:
Portfolio 1 Weight Expected return Standard deviation
A 60.00% 11.50% 23.00%
B 22.50% 14.00% 43.00%
C 17.50% 18.00% 58.00%
Portfolio expected return 13.2%
Variance 8.03%
Portfolio standard deviation 28.33%
(iii) Explaining the difference between risk and return of Portfolio 1 and 2:
The overall portfolio 1 mainly has less risk, as the there are only two stocks in the
portfolio, which has been adequately hedge. The portfolio comprises of 60% risky asset, while
40% lower risk assets is been used in the portfolio, which makes the portfolio SD at 10.54% and
return at 13%. The portfolio 2 mainly consists of 3 stocks, where the weight f the portfolio is
conducted on stock A, which has the least risk. However, portfolio 2 has a higher risk and return
Document Page
6CORPORATE FINANCE
from investment. Therefore, the portfolio 2 can yield a higher return from investment by
increasing risk of the investors.
(iv) Calculating returns and SD of Asset A, B and F:
Portfolio 1 Weight Expected
return
Standard
deviation
Weig
ht 2
Expected
return 2
A 4.80% 11.50% 23.00% 0.23% 1.32%
B 75.00% 14.00% 43.00% 56.25
%
1.96%
F 20.20% 9.90% 4.08% 0.98%
Portfolio expected
return
13.1%
Variance 1.13%
Portfolio standard
deviation
10.65%
(v) Calculating returns and SD of Asset A, B and C:
Portfolio 1 Weight Expected return Standard deviation
A 33.33% 11.50% 23.00%
B 33.33% 14.00% 43.00%
C 33.33% 18.00% 58.00%
Portfolio expected return 14.5%
tabler-icon-diamond-filled.svg

Paraphrase This Document

Need a fresh take? Get an instant paraphrase of this document with our AI Paraphraser
Document Page
7CORPORATE FINANCE
Variance 11.54%
Portfolio standard deviation 33.96%
(vi) Calculating returns and SD of Asset A, B, C and F:
Portfolio 1 Weight Expected return Standard deviation
A 25.00% 11.50% 23.00%
B 25.00% 14.00% 43.00%
C 25.00% 18.00% 58.00%
F 25.00% 9.90%
Portfolio expected return 13.4%
Variance 6.49%
Portfolio standard deviation 25.47%
(vii) Explaining the difference in portfolio 3, 4, and 5, while including the impact of the risk
free asset:
The overall evaluation of portfolio 3, 4 and 5 mainly indicates that the returns provided
by portfolio 4 is relatively higher due to the high risk involved in investment. Moreover, the
portfolio 5 has the least medium risk, while higher returns from investment. This is mainly due to
the non incorporation of risk free assets in the portfolio. The portfolio 4 does not incorporate any
of risk free asset in the portfolio, which is directly increasing the SD to 33.96%, while portfolio 5
has a SD of 25.47%. The least SD is mainly portrayed by portfolio 3, where there are only two
risky stocks and one risk free asset. This mainly reduces the risk of the portfolio substantially,
Document Page
8CORPORATE FINANCE
while the relative return also decreases. Therefore, investors according to their risk taking nature
could choose different portfolio to suit their return needs.
chevron_up_icon
1 out of 9
circle_padding
hide_on_mobile
zoom_out_icon
[object Object]