BUS286 Corporate Finance Group Assignment: Risk and Return Analysis
VerifiedAdded on 2022/10/06
|8
|2360
|20
Project
AI Summary
This group assignment for BUS286 Corporate Finance at Murdoch University explores the concepts of risk and return in financial investments. The assignment is divided into two parts. Part 1 focuses on qualitative explanations, discussing risk measurement using standard deviation, correlation's impact on portfolio risk, and the distinction between systematic and unsystematic risks. Part 2 involves quantitative analysis, calculating expected returns and standard deviations for various portfolios with different asset allocations, including risk-free assets. The analysis covers how portfolio diversification affects risk and return, comparing the performance of portfolios with varying asset compositions and assessing the impact of adding a risk-free asset. The assignment concludes by evaluating the risk-return trade-offs of different portfolio strategies and their implications for investor decisions, along with a comprehensive list of references.
Group Assignment
Table of Contents
Group Assignment.......................................................................................................................................1
Part 1...........................................................................................................................................................1
Task 1......................................................................................................................................................1
Task 2......................................................................................................................................................2
Task 3......................................................................................................................................................3
Task 4......................................................................................................................................................3
Part 2...........................................................................................................................................................5
Task 1......................................................................................................................................................5
Task 2......................................................................................................................................................5
Task 3......................................................................................................................................................5
Task 4......................................................................................................................................................5
Task 5......................................................................................................................................................6
Task 6......................................................................................................................................................6
Task 7......................................................................................................................................................6
List of reference.......................................................................................................................................7
Part 1
Task 1
Risk measurement is a very big component of many sectors operating within the financial
industry. Despite its unarguably important role in sectors such as accounting and economics, the
real effect of the fully precise or perhaps defective risk management is most visible when it
comes to the investment sector. Whether one chooses to invest in bonds or shares, the ability to
predict the direction of a trade can be the difference between profit-making and absolute
bankruptcy. Trade investors and market analysts use a variety of metrics in trying to assess the
probable risk and the likelihood of instability of their prospective ventures but in most cases due
the unpredictable nature of the stock market and its portfolios, market share investors have opted
1
Paraphrase This Document
Need a fresh take? Get an instant paraphrase of this document with our AI Paraphraser
to use standard deviation to calculate the probability of loss occurrence and the percentage of
risk using short term data to find long term prediction. This is because standard deviation is a
simple mathematical formula which its first step in calculation requires each item in the list, say
the share amount is subtracted from the overall mean and the respective variance. This leads to
simple values which can be used to determine the variability in the shares since if the standard
deviation values are highly varied it means that investing on the share is risky and if the standard
deviation values are less varied it means that the stock is predictable and investment risk is
lower. According to Brain 2019, in real world finance and stock market, the idea of using
standard deviation is easily applied by generating stock market closing price by adding and
subtracting the standard deviation value from the range. For instance, if a stock has an average
price of 25$ and a standard deviation value of 5$, the easily predicted closing range is between
20$ and 30$ just within 95% certainty percentage. Unlike other known measures of dispersal,
standard deviation is most used since it is measures every asset risk assessment included in the
analysis since it is mean based. It also has the statistical ability to calculate skewness and
correlation effect also.
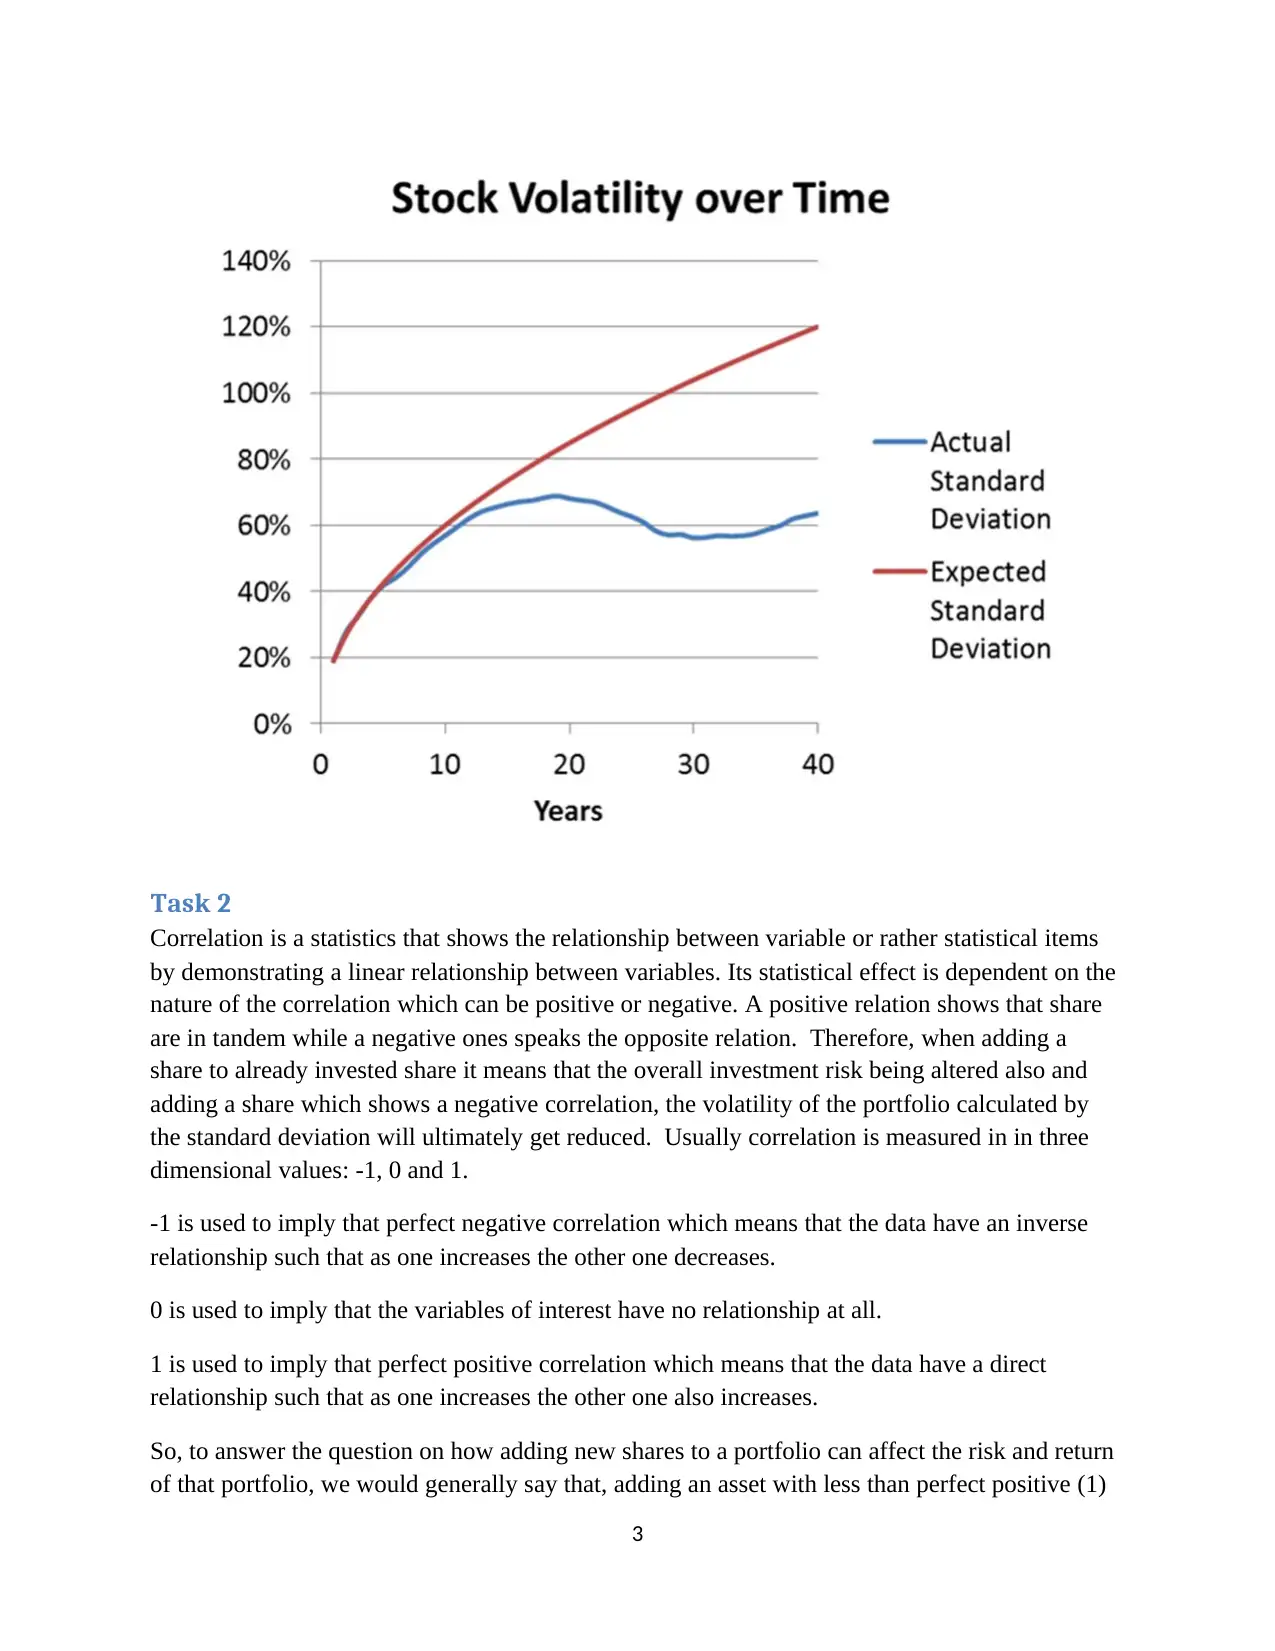
The chart below show how standard deviation is applied in real world stock volatility estimation.
2
risk using short term data to find long term prediction. This is because standard deviation is a
simple mathematical formula which its first step in calculation requires each item in the list, say
the share amount is subtracted from the overall mean and the respective variance. This leads to
simple values which can be used to determine the variability in the shares since if the standard
deviation values are highly varied it means that investing on the share is risky and if the standard
deviation values are less varied it means that the stock is predictable and investment risk is
lower. According to Brain 2019, in real world finance and stock market, the idea of using
standard deviation is easily applied by generating stock market closing price by adding and
subtracting the standard deviation value from the range. For instance, if a stock has an average
price of 25$ and a standard deviation value of 5$, the easily predicted closing range is between
20$ and 30$ just within 95% certainty percentage. Unlike other known measures of dispersal,
standard deviation is most used since it is measures every asset risk assessment included in the
analysis since it is mean based. It also has the statistical ability to calculate skewness and
correlation effect also.
The chart below show how standard deviation is applied in real world stock volatility estimation.
2
Task 2
Correlation is a statistics that shows the relationship between variable or rather statistical items
by demonstrating a linear relationship between variables. Its statistical effect is dependent on the
nature of the correlation which can be positive or negative. A positive relation shows that share
are in tandem while a negative ones speaks the opposite relation. Therefore, when adding a
share to already invested share it means that the overall investment risk being altered also and
adding a share which shows a negative correlation, the volatility of the portfolio calculated by
the standard deviation will ultimately get reduced. Usually correlation is measured in in three
dimensional values: -1, 0 and 1.
-1 is used to imply that perfect negative correlation which means that the data have an inverse
relationship such that as one increases the other one decreases.
0 is used to imply that the variables of interest have no relationship at all.
1 is used to imply that perfect positive correlation which means that the data have a direct
relationship such that as one increases the other one also increases.
So, to answer the question on how adding new shares to a portfolio can affect the risk and return
of that portfolio, we would generally say that, adding an asset with less than perfect positive (1)
3
⊘ This is a preview!⊘
Do you want full access?
Subscribe today to unlock all pages.
Trusted by 1+ million students worldwide
correlation to the portfolio will reduce the overall risk in terms of standard deviation of the said
assortment of trades. This concept is best demonstrated by calculating the standard deviation of a
portfolio with two assets. Just by plugging in the numbers into excel, one would easily notice
that if by chance the correlation turns out to be 1 then the standard deviation of the portfolio will
just be the average of the standard deviations of the two assets.
To sum it up, we would say that, with every decrease in correlation there is also a decrease in the
Standard Deviation of the particular assortment of trades hence the reason why correlation is
often used in portfolios management.
Task 3
P2 = w1212 + w2222 + 2w1w212 12
To find the risk of a given assortment of investments, the square root of the above equation has
to be found. This will be dependent on the w1 and w2 values and also the 1 and 2 values. Let’s
us assume the risk free asset is w2 then for it to have significant changes on the equation its
percentage has to be bigger than of w1. At this stage the total probability of the risk occurrence is
greatly reduced to be zero however, also as a result the expected return value will be lowered
accordingly.
The concept of assets which are free of any possible risk has overtime become a decisive aspect
in the development of one of the main theories in the financial sector known as the Capital
Market Theory. The Capital Markets Theory asserts that there is an alternative to investing only
in risky assets and that alternative is to invest in assets which are free of any possible risk. An
asset is said to be free of any possible risk when it has no Standard Deviation. Simply put, any
asset which is said to be free of risk has a definite known, certain profit due to the fact that it has
nil standard deviation. Hence, the covariance of the risk free asset with any asset associated with
a certain level of risk undoubtedly becomes nil.
If one was to add an asset which is known to have no risk to an assortment of trades known to be
made up of assets that are associated with certain levels of risk that rest on the efficient
borderline, quite a number of effects are bound to be generated but generally speaking, the
anticipatory profit for an assortment of trades that contain both assets with no risk and assets that
are associated with risk is the subjective average of the two returns.
To sum it up, as one can be able to see from the equation, the standard deviation for any
assortment of trades that is made up of both risk-associated assets and non-risk-associated assets
is identical to the linear proportion of the standard deviation of the assortment of investments
made up of assets associated with a certain level of risk.
Task 4
According to Savor, Pavel and Wilson 2016, systematic risks are risks that are associated with
the loss of the entire stock market while Mohamed and Heba 2018, defined unsystematic risks
as residuals risks which are industrial based type of risk which are unplanned and usually occur
randomly causing unwanted business disruption.
4
Paraphrase This Document
Need a fresh take? Get an instant paraphrase of this document with our AI Paraphraser
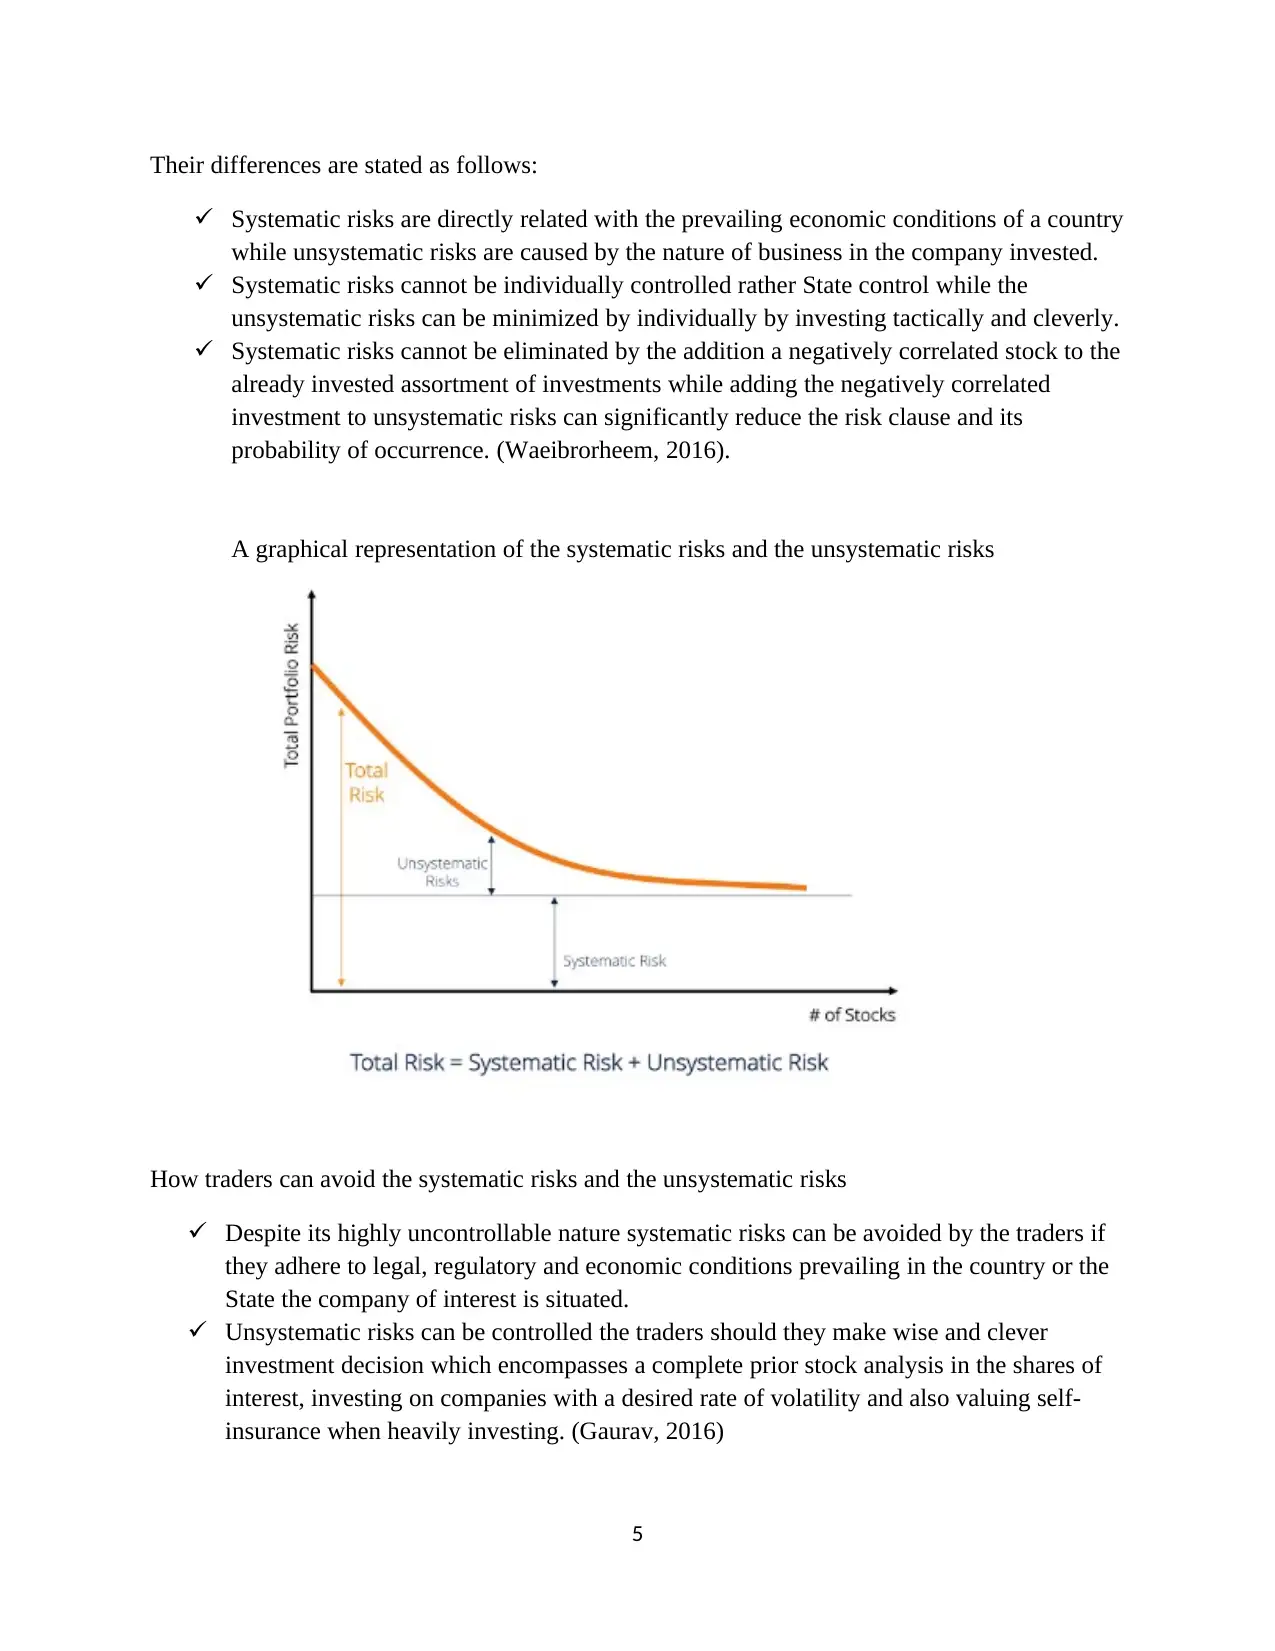
Their differences are stated as follows:
Systematic risks are directly related with the prevailing economic conditions of a country
while unsystematic risks are caused by the nature of business in the company invested.
Systematic risks cannot be individually controlled rather State control while the
unsystematic risks can be minimized by individually by investing tactically and cleverly.
Systematic risks cannot be eliminated by the addition a negatively correlated stock to the
already invested assortment of investments while adding the negatively correlated
investment to unsystematic risks can significantly reduce the risk clause and its
probability of occurrence. (Waeibrorheem, 2016).
A graphical representation of the systematic risks and the unsystematic risks
How traders can avoid the systematic risks and the unsystematic risks
Despite its highly uncontrollable nature systematic risks can be avoided by the traders if
they adhere to legal, regulatory and economic conditions prevailing in the country or the
State the company of interest is situated.
Unsystematic risks can be controlled the traders should they make wise and clever
investment decision which encompasses a complete prior stock analysis in the shares of
interest, investing on companies with a desired rate of volatility and also valuing self-
insurance when heavily investing. (Gaurav, 2016)
5
Part 2
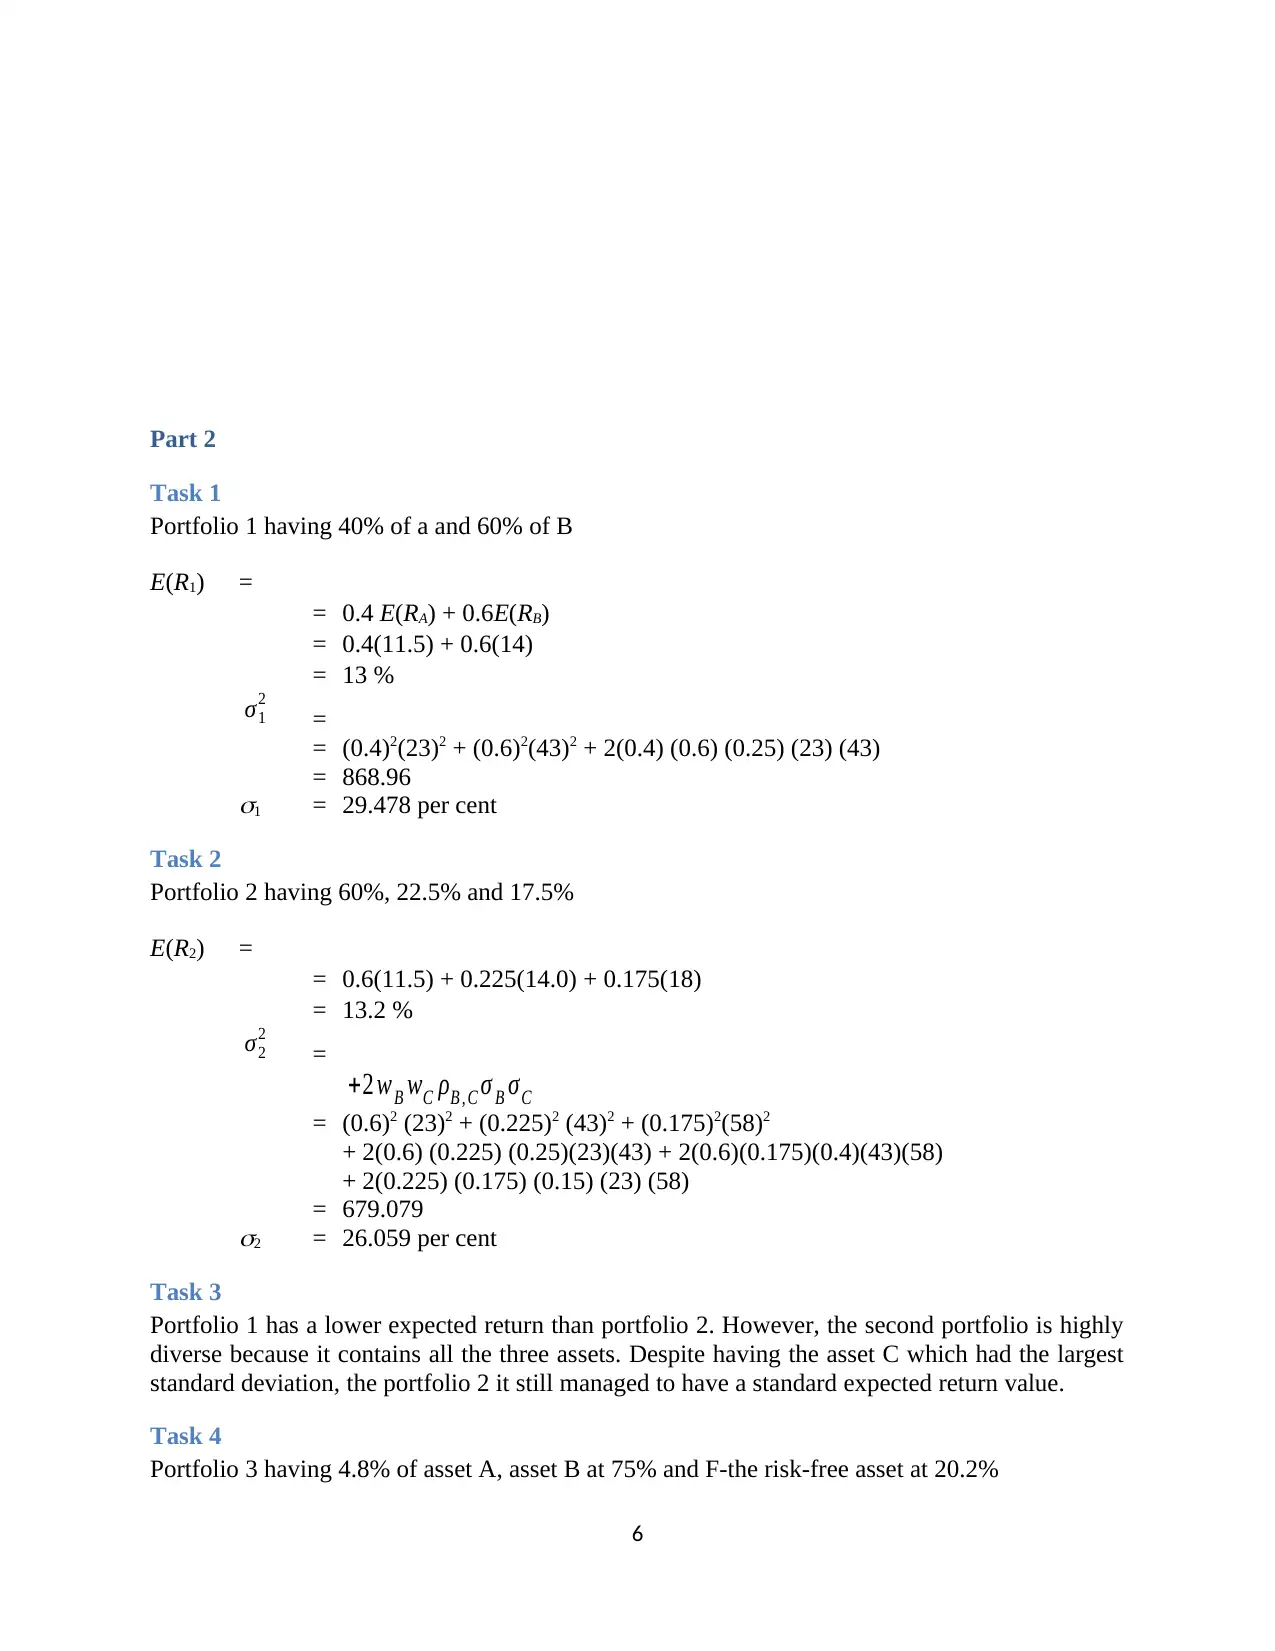
Task 1
Portfolio 1 having 40% of a and 60% of B
E(R1) =
= 0.4 E(RA) + 0.6E(RB)
= 0.4(11.5) + 0.6(14)
= 13 %
σ1
2
=
= (0.4)2(23)2 + (0.6)2(43)2 + 2(0.4) (0.6) (0.25) (23) (43)
= 868.96
1 = 29.478 per cent
Task 2
Portfolio 2 having 60%, 22.5% and 17.5%
E(R2) =
= 0.6(11.5) + 0.225(14.0) + 0.175(18)
= 13.2 %
σ2
2
=
+2 wB wC ρB , C σ B σC
= (0.6)2 (23)2 + (0.225)2 (43)2 + (0.175)2(58)2
+ 2(0.6) (0.225) (0.25)(23)(43) + 2(0.6)(0.175)(0.4)(43)(58)
+ 2(0.225) (0.175) (0.15) (23) (58)
= 679.079
2 = 26.059 per cent
Task 3
Portfolio 1 has a lower expected return than portfolio 2. However, the second portfolio is highly
diverse because it contains all the three assets. Despite having the asset C which had the largest
standard deviation, the portfolio 2 it still managed to have a standard expected return value.
Task 4
Portfolio 3 having 4.8% of asset A, asset B at 75% and F-the risk-free asset at 20.2%
6
⊘ This is a preview!⊘
Do you want full access?
Subscribe today to unlock all pages.
Trusted by 1+ million students worldwide
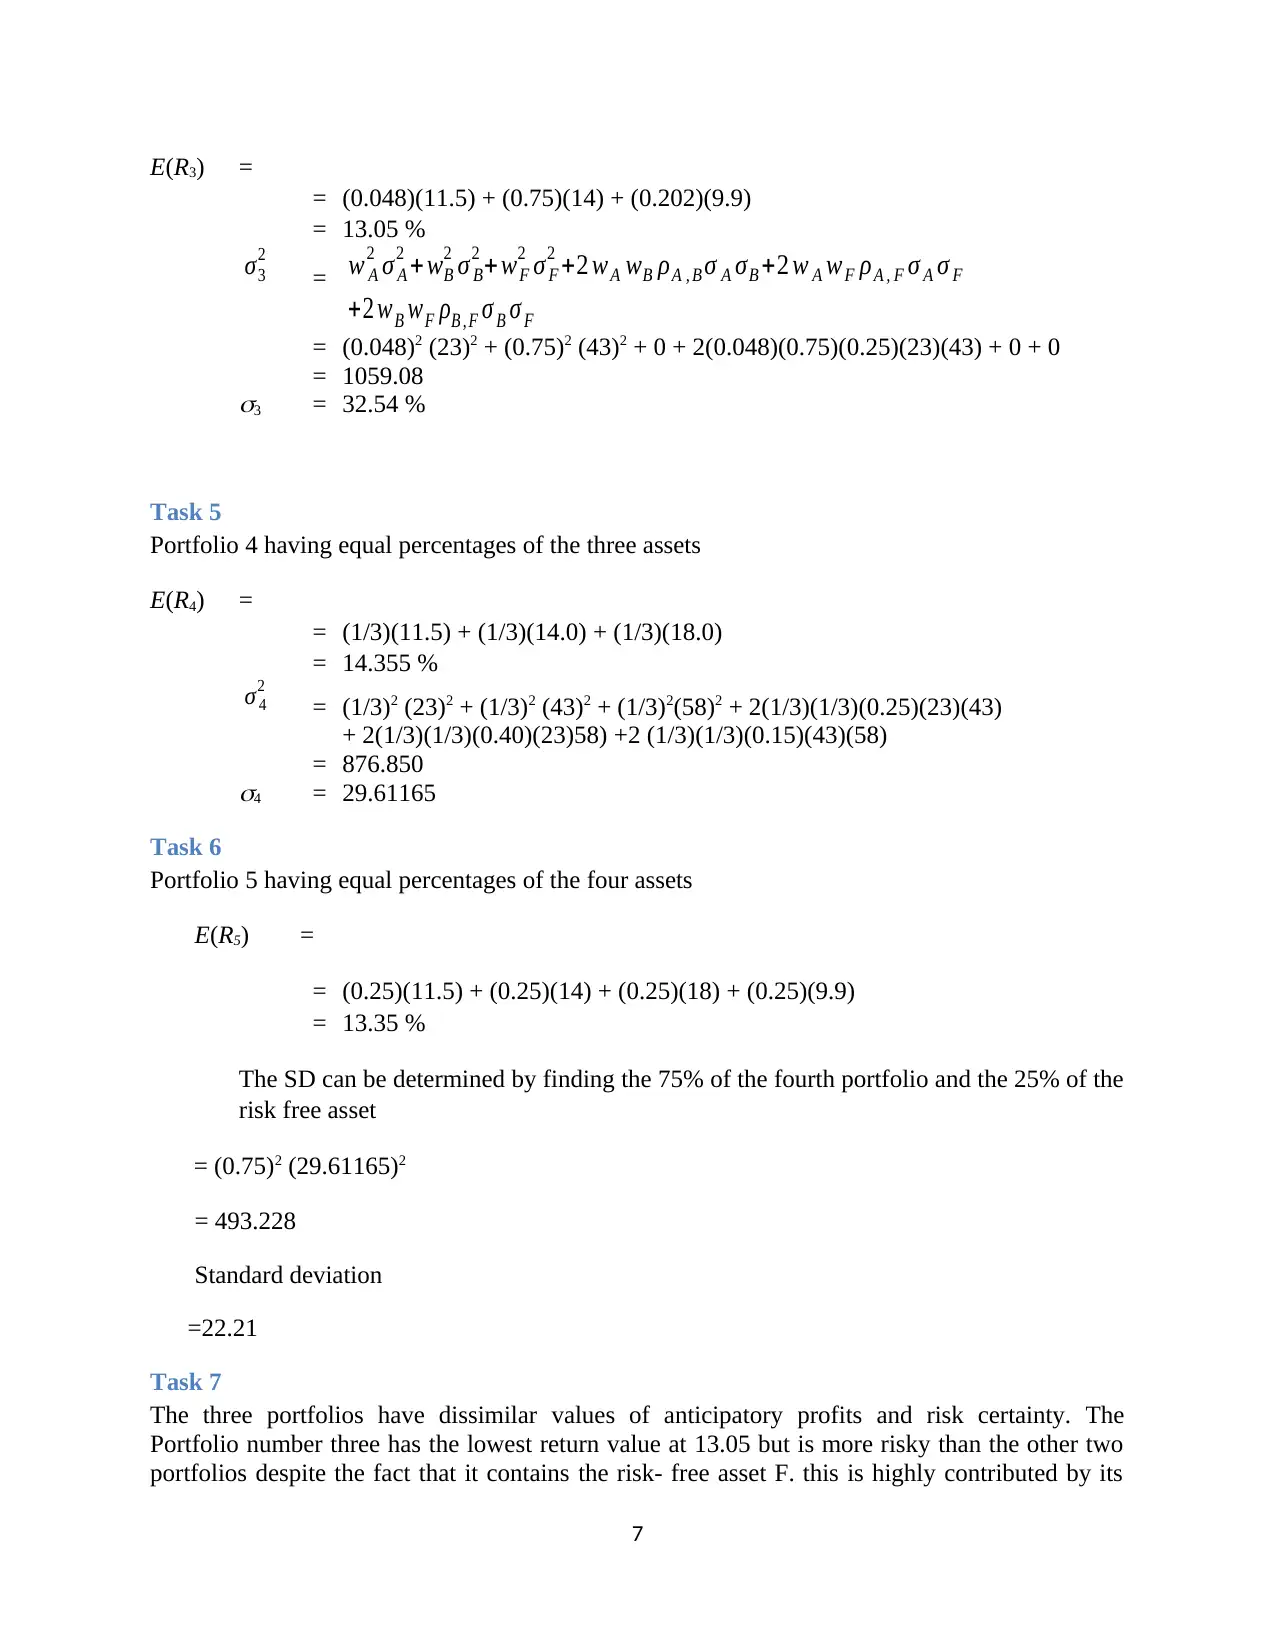
E(R3) =
= (0.048)(11.5) + (0.75)(14) + (0.202)(9.9)
= 13.05 %
σ3
2
= w A
2 σ A
2 + wB
2 σ B
2 + wF
2 σ F
2 +2 wA wB ρA , B σ A σB +2 w A wF ρA , F σ A σ F
+2 wB wF ρB , F σ B σ F
= (0.048)2 (23)2 + (0.75)2 (43)2 + 0 + 2(0.048)(0.75)(0.25)(23)(43) + 0 + 0
= 1059.08
3 = 32.54 %
Task 5
Portfolio 4 having equal percentages of the three assets
E(R4) =
= (1/3)(11.5) + (1/3)(14.0) + (1/3)(18.0)
= 14.355 %
σ 4
2
= (1/3)2 (23)2 + (1/3)2 (43)2 + (1/3)2(58)2 + 2(1/3)(1/3)(0.25)(23)(43)
+ 2(1/3)(1/3)(0.40)(23)58) +2 (1/3)(1/3)(0.15)(43)(58)
= 876.850
4 = 29.61165
Task 6
Portfolio 5 having equal percentages of the four assets
E(R5) =
= (0.25)(11.5) + (0.25)(14) + (0.25)(18) + (0.25)(9.9)
= 13.35 %
The SD can be determined by finding the 75% of the fourth portfolio and the 25% of the
risk free asset
= (0.75)2 (29.61165)2
= 493.228
Standard deviation
=22.21
Task 7
The three portfolios have dissimilar values of anticipatory profits and risk certainty. The
Portfolio number three has the lowest return value at 13.05 but is more risky than the other two
portfolios despite the fact that it contains the risk- free asset F. this is highly contributed by its
7
Paraphrase This Document
Need a fresh take? Get an instant paraphrase of this document with our AI Paraphraser
unequal distribution of assets percentages for instance, asset B is at 75% and asset F is at 20.2%.
Portfolio number 4 consists of the three assets in equal measure i.e. all at 0.33% and that
contribute to its 14.35% of expected return and a moderately lower risk involvement. Portfolio 5
is made up of four assets each at 0.25% this contributes to an average expected return value at
13.35% and the lowest risk values at 22.21. An investment by a potential investor is more likely
to be made on portfolio 4 or portfolio 5 but not portfolio 3 since it is too risky. The decision to
invest on either portfolio 4 or 5 is dependent on the investor’s decision based on risk averse or a
higher expected return.
List of reference
Brain Beers 2019, “What Is Standard Deviation in risk calculation?,” Accessed October 4, 2019.
https://www.investopedia.com/ask/answers/021915/how-standard-deviation-used-
determine-risk.asp
Gaurav Tamuli 2016, ” Risk management,” Accessed October 4, 2019.
https://www.quora.com/How-can-an-unsystematic-risk-be-managed
Mohamed Masry and Heba Menshawy 2018, ” Unsystematic risks,” Accessed October 4, 2019.
https://pdfs.semanticscholar.org/4299/3ddf83d18146c02e16cf14fdc2f75c65a9da.pdf
Savor, Pavel, and Mungo Wilson. "Earnings announcements and systematic risk." The Journal of
Finance 71, no. 1 (2016): 83-138.
Waeibrorheem Waemustafa 2016, ” The systematic risks and the unsystematic risks.” Accessed
October 4, 2019. https://dergipark.org.tr/en/pub/ijefi/issue/32045/354646
8
1 out of 8
Related Documents


Your All-in-One AI-Powered Toolkit for Academic Success.
+13062052269
info@desklib.com
Available 24*7 on WhatsApp / Email
![[object Object]](/_next/static/media/star-bottom.7253800d.svg)
Unlock your academic potential
Copyright © 2020–2026 A2Z Services. All Rights Reserved. Developed and managed by ZUCOL.