Econometrics Homework: Regression Analysis of Call Centre Data RMIT

Verified

Added on  2023/06/04

|9
|2101
|132
Homework Assignment
AI Summary
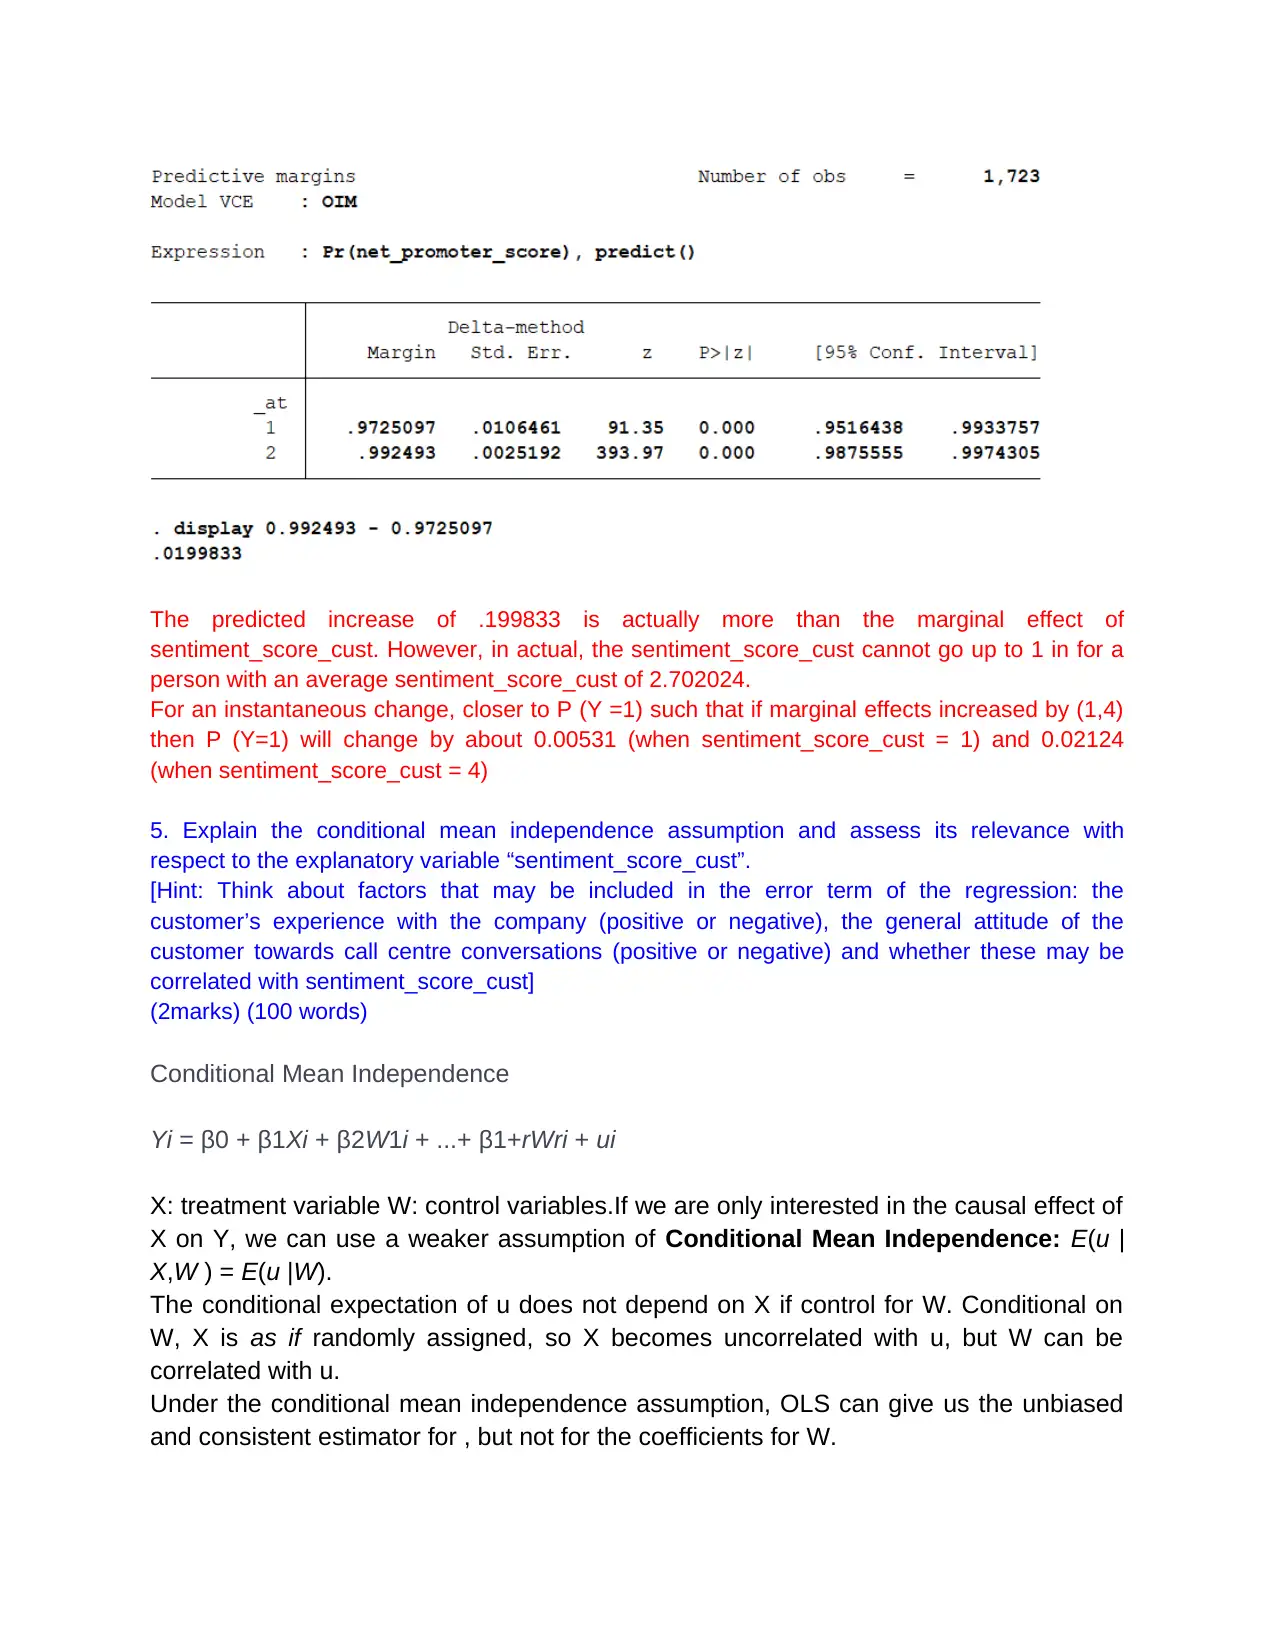
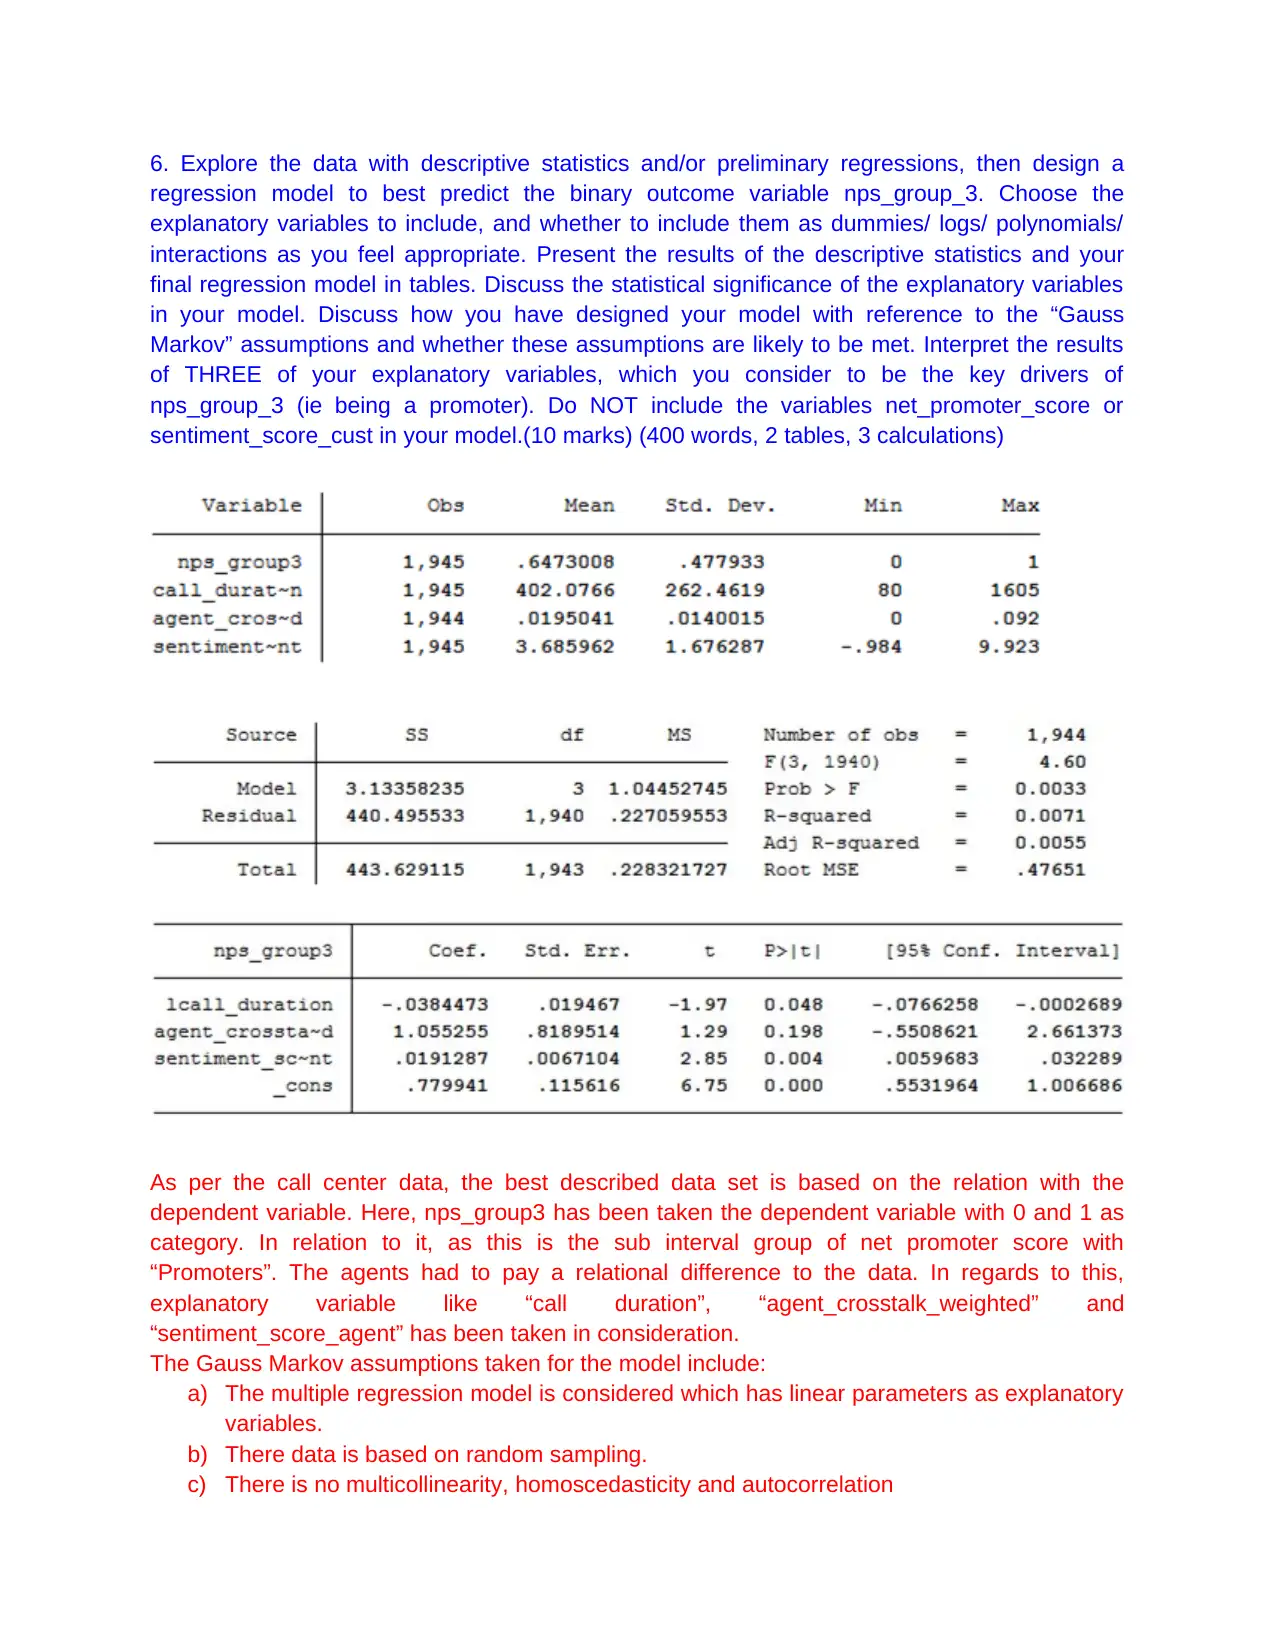
This assignment focuses on analyzing call centre data using regression analysis in Stata to determine the key drivers of the Net Promoter Score (NPS). It involves calculating descriptive statistics, estimating multiple linear regressions, incorporating dummy variables for state and package effects, and including a quadratic specification for sentiment score. The analysis assesses the conditional mean independence assumption and designs a regression model to predict a binary outcome variable related to NPS group. The findings are summarized in an executive summary, highlighting the importance of variables like agent crosstalk, call duration, and agent sentiment in influencing the net promoter score, while also discussing limitations and potential improvements to the model. This assignment also checks Gauss Markov assumptions to see the validity of regression model. Desklib provides students access to a wide range of solved assignments and study tools.
Document Page
1. Calculate descriptive statistics using the ‘summarize’ command for the variables
net_promoter_score, total_silence, total_silence_weighted, agent_to_cust_index and
agent_crosstalk_weighted and present the results in a table. Comment on what we learn about
these variables from the descriptives. Graph a scatter plot of net_promoter_score against
agent_crosstalk_weighted and describe the relationship between these two variables.
(3 marks) (100 words, 1 table, 1 graph)
The descriptive helps in understanding the nature of the variable, whether being nominal or
scale values. Here, net rpomoter scale can be considered as nominal as it has values from 0 to
10 and mean being 8.56 depicts that mostly the responses are concentrated towards 8. Rest all
variables total_silence, total_silence_weighted, agent_crosstalk_weighted and
agent_to_cust_index are numerical in nature. The variable agent_crosstalk_weighted and total
silence weighted consists of low standard deviation indicates that the data points tend to be
close to the mean while a high standard deviation like total silence_weighted indicates that the
data points are spread out over a wider range of values.
tabler-icon-diamond-filled.svg

Paraphrase This Document

Need a fresh take? Get an instant paraphrase of this document with our AI Paraphraser
Document Page
The relationship between net_Promoter_Score and agent_Crosstalk_weighted is not linear.
When agent_crosstalk_weighted increase, net_Promoter_score also increases. There is no way
of determining from these points as it the pattern never indicate is rising or falling and there is
no correlation between these 2 variables.
2. Estimate a multiple linear regression with net_promoter_score as the dependent variable and
total_silence_weighted, agent_to_cust_index and agent_crosstalk_weighted as the explanatory
(independent) variables. Predict the change in net_promoter_score associated with a 0.1
increase in total_silence_weighted and a 0.01 increase in agent_crosstalk_weighted. Assuming
this is the correct model specification, are we sure that total_silence_weighted has a negative
effect? [Hint: consider the t-statistic and p-value]
(4 marks) (50 words, 1 table, 2 calculations)
Regression equation
net_promoter_scorePredicted = 8.4441 - 0.5819* total_silenced_weighted -0.00894*
agent_to_cust_index + 7.5564* agent_crosstalk_weighted
If all the units were sold for 1 unit
Net_promoter_score = 8.4441 - 0.5819 -0.00894 + 7.5564 = 15.40966 (assumed)
Change in net promoter score = 8.4441 - 0.5819* 0.1 -0.00894* 1 + 7.5564* 0.01
= 8.4441 – 0.05819 – 0.00894 + 0.075564 = 8.4525
Hence, the change would be around 0.54 (8.4525/15.40966) times from the initial change.
As per the results from the table, total_silenced_weighted is -0.16, which is less than the
tabulated t value at 1940df = +/-1.96. However, this result is not significant because at 95%
level, the p value is 0.876 which is greater than p = 0.05 making it statistically insignificant.
Document Page
3. Add dummy variables to the regression to control for all of the potential effects of State and
Package. Make sure the base category is customers with the “HOSPITAL AND EXTRAS”
package in NSW. Carefully interpret the estimated coefficient on the package1 dummy variable
you have included. Why is this NOT a very important result?
[Hint: Use the variable labels to include and interpret the correct variables, consider the
descriptive statistics of the dummy variables to interpret their importance]
(3 marks) (50 words, 1 table)
The estimated coefficient of package1 dummy is 0.68566 which depicts that if there is 1 unit
change in package 1, net promoter sales will increase by 68.56%. However, this result is not
significant because at 95% level, the p value is 0.053 which is greater than p = 0.05 making it
statistically insignificant. Based on analysis with standard errors for dummy variables, the
dummies do not overlap within +/- 1.96 standard errors of one another, such that 95% confident
the differences are not due to sampling error. In this example, the dummy exceed the
confidence level making it insignificant.
4. Include a quadratic specification of the variable “sentiment_score_cust” in the model along
with the existing explanatory variables. Calculate and interpret the marginal effect of a 1 point
change in “sentiment_score_cust” when sentiment_score_cust = 1 and when
sentiment_score_cust=4.
(3 marks) (50 words, 1 table, 2 calculations)
Document Page
tabler-icon-diamond-filled.svg

Paraphrase This Document

Need a fresh take? Get an instant paraphrase of this document with our AI Paraphraser
Document Page
The predicted increase of .199833 is actually more than the marginal effect of
sentiment_score_cust. However, in actual, the sentiment_score_cust cannot go up to 1 in for a
person with an average sentiment_score_cust of 2.702024.
For an instantaneous change, closer to P (Y =1) such that if marginal effects increased by (1,4)
then P (Y=1) will change by about 0.00531 (when sentiment_score_cust = 1) and 0.02124
(when sentiment_score_cust = 4)
5. Explain the conditional mean independence assumption and assess its relevance with
respect to the explanatory variable “sentiment_score_cust”.
[Hint: Think about factors that may be included in the error term of the regression: the
customer’s experience with the company (positive or negative), the general attitude of the
customer towards call centre conversations (positive or negative) and whether these may be
correlated with sentiment_score_cust]
(2marks) (100 words)
Conditional Mean Independence
Yi = β0 + β1Xi + β2W1i + ...+ β1+rWri + ui
X: treatment variable W: control variables.If we are only interested in the causal effect of
X on Y, we can use a weaker assumption of Conditional Mean Independence: E(u |
X,W ) = E(u |W).
The conditional expectation of u does not depend on X if control for W. Conditional on
W, X is as if randomly assigned, so X becomes uncorrelated with u, but W can be
correlated with u.
Under the conditional mean independence assumption, OLS can give us the unbiased
and consistent estimator for , but not for the coefficients for W.
Document Page
The assumption of conditional mean independence does not depend on predictor and
treatment variable such that explanatory variable can have errors because model when
tested with regression shows the model to be insignificant but without the constant term
in the model, the model is significant. The “sentiment_score_cust” cannot divided based
on age but that influence the results are because of the bias in the OLS estimator that
occurs as a result of an omitted factor such that error terms and explanatory variable
are correlated. The possible factors can be customer’s experience in the company is
negative than positive, the time taken for call center conversations is more than the
desired till the deal is cracked. Also, agent crosstalk based on the top of the customer
with me highly positively related with customer’s sentiments.
Document Page
6. Explore the data with descriptive statistics and/or preliminary regressions, then design a
regression model to best predict the binary outcome variable nps_group_3. Choose the
explanatory variables to include, and whether to include them as dummies/ logs/ polynomials/
interactions as you feel appropriate. Present the results of the descriptive statistics and your
final regression model in tables. Discuss the statistical significance of the explanatory variables
in your model. Discuss how you have designed your model with reference to the “Gauss
Markov” assumptions and whether these assumptions are likely to be met. Interpret the results
of THREE of your explanatory variables, which you consider to be the key drivers of
nps_group_3 (ie being a promoter). Do NOT include the variables net_promoter_score or
sentiment_score_cust in your model.(10 marks) (400 words, 2 tables, 3 calculations)
As per the call center data, the best described data set is based on the relation with the
dependent variable. Here, nps_group3 has been taken the dependent variable with 0 and 1 as
category. In relation to it, as this is the sub interval group of net promoter score with
“Promoters”. The agents had to pay a relational difference to the data. In regards to this,
explanatory variable like “call duration”, “agent_crosstalk_weighted” and
“sentiment_score_agent” has been taken in consideration.
The Gauss Markov assumptions taken for the model include:
a) The multiple regression model is considered which has linear parameters as explanatory
variables.
b) There data is based on random sampling.
c) There is no multicollinearity, homoscedasticity and autocorrelation
tabler-icon-diamond-filled.svg

Paraphrase This Document

Need a fresh take? Get an instant paraphrase of this document with our AI Paraphraser
Document Page
d) The error term is normally distributed.
e) C) The expected value of the error term is zero, Mathematically, E (εX)=0 such as
E(ε)=0. [conditional mean = 0]
On the whole, these explanatory variables descriptive statistics had been considered where the
call duration variable standard deviation is 262.46 which is considerably high and there are
outliers in the model. Also, the sentiment_score_agent has standard deviation of 1.67 depicting
less deviation and inclined towards the mean score of 3.685.
The overall significance of the model is statistically significant as F is greater than the tabulated
F value at df (3, 1940) = 2.60, using p value as 0.003 which is less than 0.05 at 95%
significance level. However, the model has errors as adjusted R square is less than 80%, not
considering the model as best fit. This violates the assumption of error term not being normally
distributed.
While analyzing the explanatory variable individually, call duration has p value as 0.048 which is
slightly less than 0.05, making this explanatory variable statistically significant. This highlights
that if there is 1 unit change in call duration, then nps_group3 of promoters can fall by 3.84%
showing a negative relationship.
On the other hand, agent_crosstalk_weighted has p value as 0.198 which is higher than 0.05,
making this explanatory variable statistically insignificant. This highlights that if there is 1 unit
change in agent_crosstalk_weighted, then nps_group3 of promoters can increase by 105.52%
showing a positive relationship which would change when 95 times the study is repeated out of
100 times.
Further, sentiment_score_agent shows significant relationship with p = 0.004. This can be
explained by if there is 1 unit change in sentiment_score_agent, then nps_group3 of promoters
can increase by 1.91% showing a positive relationship at 95% confidence level.
7. Write an executive summary of the findings in questions 2 to 6 on what variables are likely
and are not likely to be important drivers of net promoter score.
(5 marks, 250 words)
The call center data studied shows various responses on the independent variables that have
led to selecting important drivers of net promoter score. Based on the analysis done, the
“agent_crosstalk_weighted” can be assumed to a be an important variable because it increases
with net promoter score. However, the relationship is not linear makes the analysis to be done
on non-probabilistic tools.
Secondly, total_silence_weighted is suppose to have a negative relationship with net promoter
score but does not have statistical significance. Nevertheless, “package1” as dummy variable is
not statistically significant with the model.
Also, the variable “sentimental_score_cust” varies on prediction but has a problem of conditional
mean difference which violates the Gauss Markov assumptions.
Hence, the last model taken with three drivers shows a potential model of multiple regression
where call_duration is one variable and sentiment_score_agent which makes the model overall
significance using F value and independently statistically significant using p value.
Document Page
The model with 3 explanatory variables taken highlight the importance of agent relationship with
customers and the way it can yield in increasing net promoter score if only examined with
“promoters” excluding detractors and passive.
To highlight, the model needs further retribution of variables like net_consultant_rating, tensures
and first_call_resolution factors in analyzing the complete model with the assumptions set. With
further scope, a relevant and significant model can be developed.
chevron_up_icon
1 out of 9
circle_padding
hide_on_mobile
zoom_out_icon
[object Object]