Implementation of RNAO Best Practice Guideline: A Study Report
VerifiedAdded on 2022/08/12
|36
|7467
|29
Report
AI Summary
This report presents a study on the implementation of the Registered Nurses’ Association of Ontario (RNAO) Best Practice Guideline: Delirium, Dementia, and Depression in Older Adults. The research, conducted in a non-teaching hospital in South Ontario, investigates the guideline's effectiveness among nursing staff. The study analyzes demographic data from 60 nurses, employing descriptive statistics, correlation analysis, and inferential tests such as t-tests and ANOVA to examine relationships between variables like age, gender, and attitudes toward change. The report includes contingency tables, pivot tables, and statistical calculations to evaluate the impact of the guideline on nursing practice. The findings suggest a strong positive correlation between patient wishes and adherence to the guideline, while also exploring the influence of age and gender on nurses' opinions. The report provides nursing implications and research questions for further investigation.
A STUDY ON THE IMPLEMEMENTATION OF RNAO BEST PRACTICE GUIDELINE
A STUDY ON THE IMPLEMEMENTATION OF RNAO BEST PRACTICE GUIDELINE
Name of the Student:
Name of the University:
Author Note:
A STUDY ON THE IMPLEMEMENTATION OF RNAO BEST PRACTICE GUIDELINE
Name of the Student:
Name of the University:
Author Note:
Paraphrase This Document
Need a fresh take? Get an instant paraphrase of this document with our AI Paraphraser
1
A STUDY ON THE IMPLEMEMENTATION OF RNAO BEST PRACTICE GUIDELINE
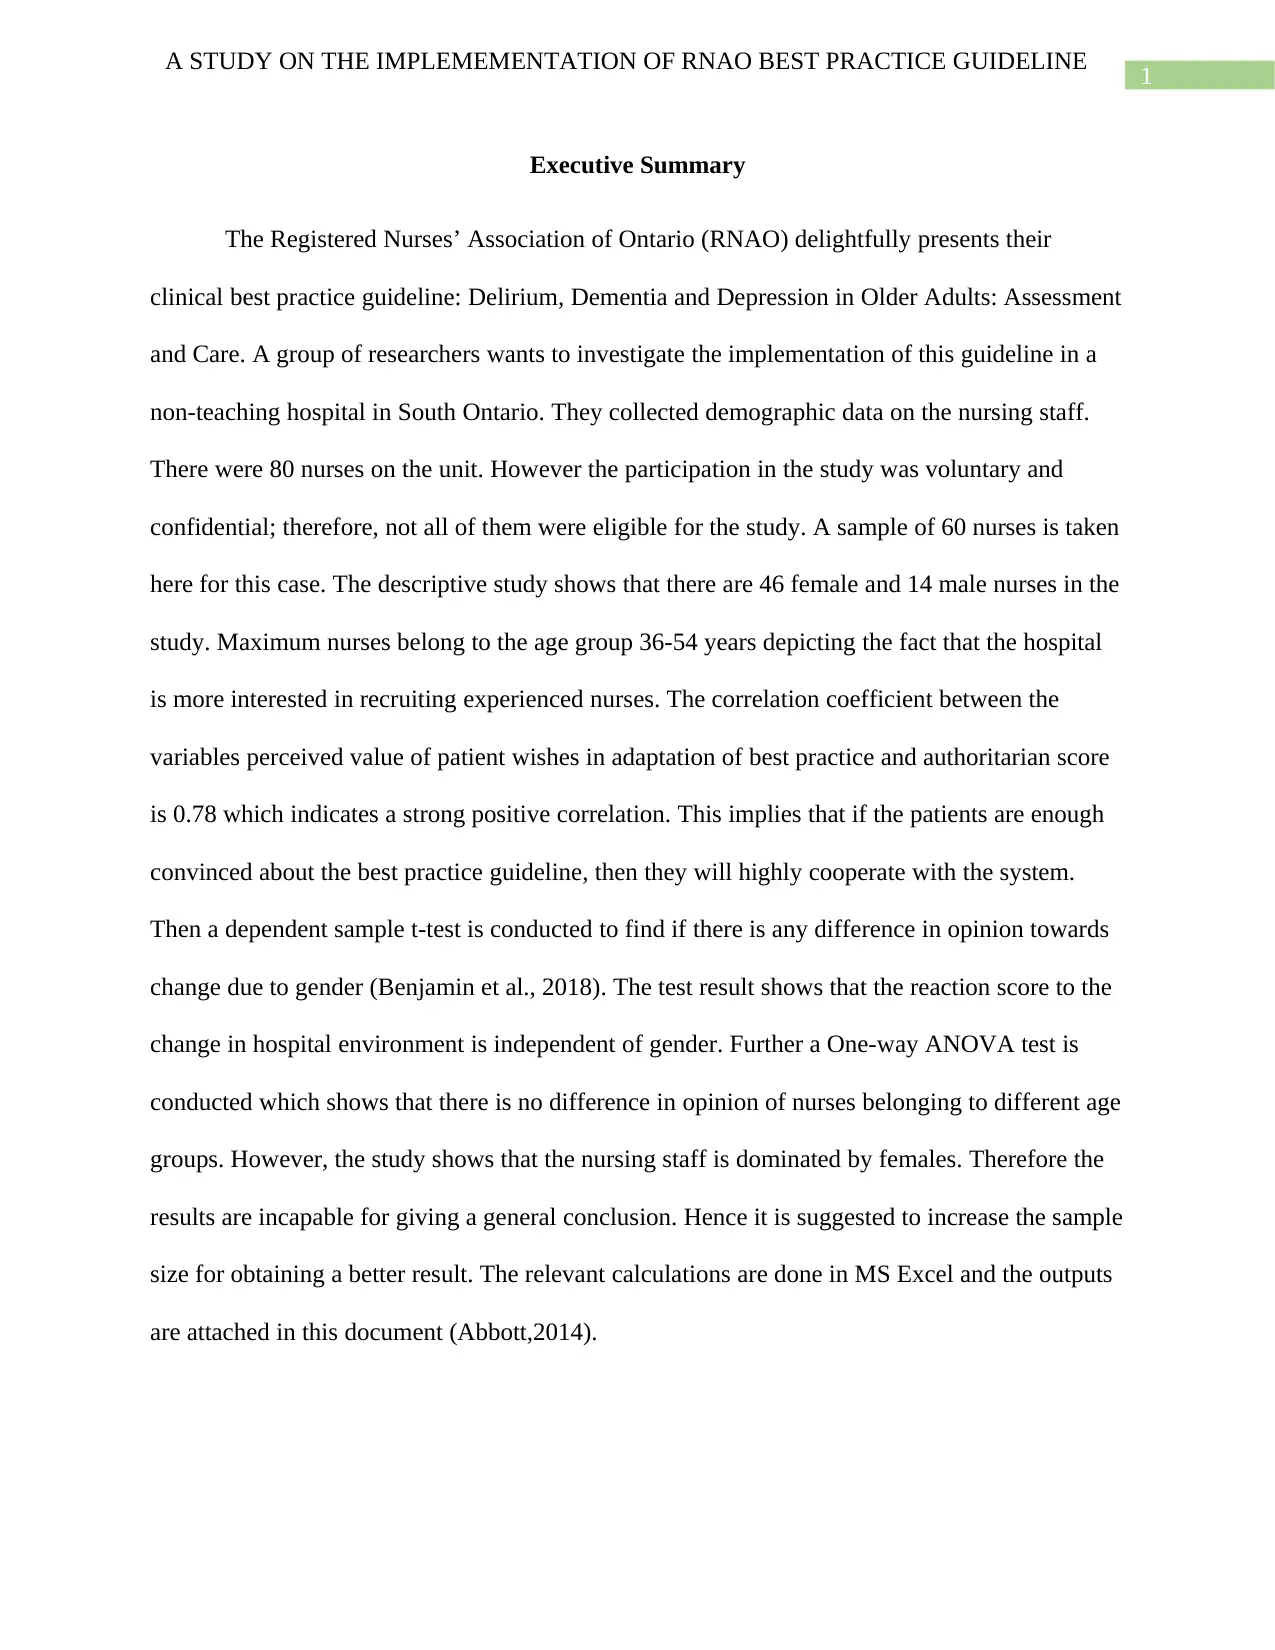
Executive Summary
The Registered Nurses’ Association of Ontario (RNAO) delightfully presents their
clinical best practice guideline: Delirium, Dementia and Depression in Older Adults: Assessment
and Care. A group of researchers wants to investigate the implementation of this guideline in a
non-teaching hospital in South Ontario. They collected demographic data on the nursing staff.
There were 80 nurses on the unit. However the participation in the study was voluntary and
confidential; therefore, not all of them were eligible for the study. A sample of 60 nurses is taken
here for this case. The descriptive study shows that there are 46 female and 14 male nurses in the
study. Maximum nurses belong to the age group 36-54 years depicting the fact that the hospital
is more interested in recruiting experienced nurses. The correlation coefficient between the
variables perceived value of patient wishes in adaptation of best practice and authoritarian score
is 0.78 which indicates a strong positive correlation. This implies that if the patients are enough
convinced about the best practice guideline, then they will highly cooperate with the system.
Then a dependent sample t-test is conducted to find if there is any difference in opinion towards
change due to gender (Benjamin et al., 2018). The test result shows that the reaction score to the
change in hospital environment is independent of gender. Further a One-way ANOVA test is
conducted which shows that there is no difference in opinion of nurses belonging to different age
groups. However, the study shows that the nursing staff is dominated by females. Therefore the
results are incapable for giving a general conclusion. Hence it is suggested to increase the sample
size for obtaining a better result. The relevant calculations are done in MS Excel and the outputs
are attached in this document (Abbott,2014).
A STUDY ON THE IMPLEMEMENTATION OF RNAO BEST PRACTICE GUIDELINE
Executive Summary
The Registered Nurses’ Association of Ontario (RNAO) delightfully presents their
clinical best practice guideline: Delirium, Dementia and Depression in Older Adults: Assessment
and Care. A group of researchers wants to investigate the implementation of this guideline in a
non-teaching hospital in South Ontario. They collected demographic data on the nursing staff.
There were 80 nurses on the unit. However the participation in the study was voluntary and
confidential; therefore, not all of them were eligible for the study. A sample of 60 nurses is taken
here for this case. The descriptive study shows that there are 46 female and 14 male nurses in the
study. Maximum nurses belong to the age group 36-54 years depicting the fact that the hospital
is more interested in recruiting experienced nurses. The correlation coefficient between the
variables perceived value of patient wishes in adaptation of best practice and authoritarian score
is 0.78 which indicates a strong positive correlation. This implies that if the patients are enough
convinced about the best practice guideline, then they will highly cooperate with the system.
Then a dependent sample t-test is conducted to find if there is any difference in opinion towards
change due to gender (Benjamin et al., 2018). The test result shows that the reaction score to the
change in hospital environment is independent of gender. Further a One-way ANOVA test is
conducted which shows that there is no difference in opinion of nurses belonging to different age
groups. However, the study shows that the nursing staff is dominated by females. Therefore the
results are incapable for giving a general conclusion. Hence it is suggested to increase the sample
size for obtaining a better result. The relevant calculations are done in MS Excel and the outputs
are attached in this document (Abbott,2014).
2
A STUDY ON THE IMPLEMEMENTATION OF RNAO BEST PRACTICE GUIDELINE
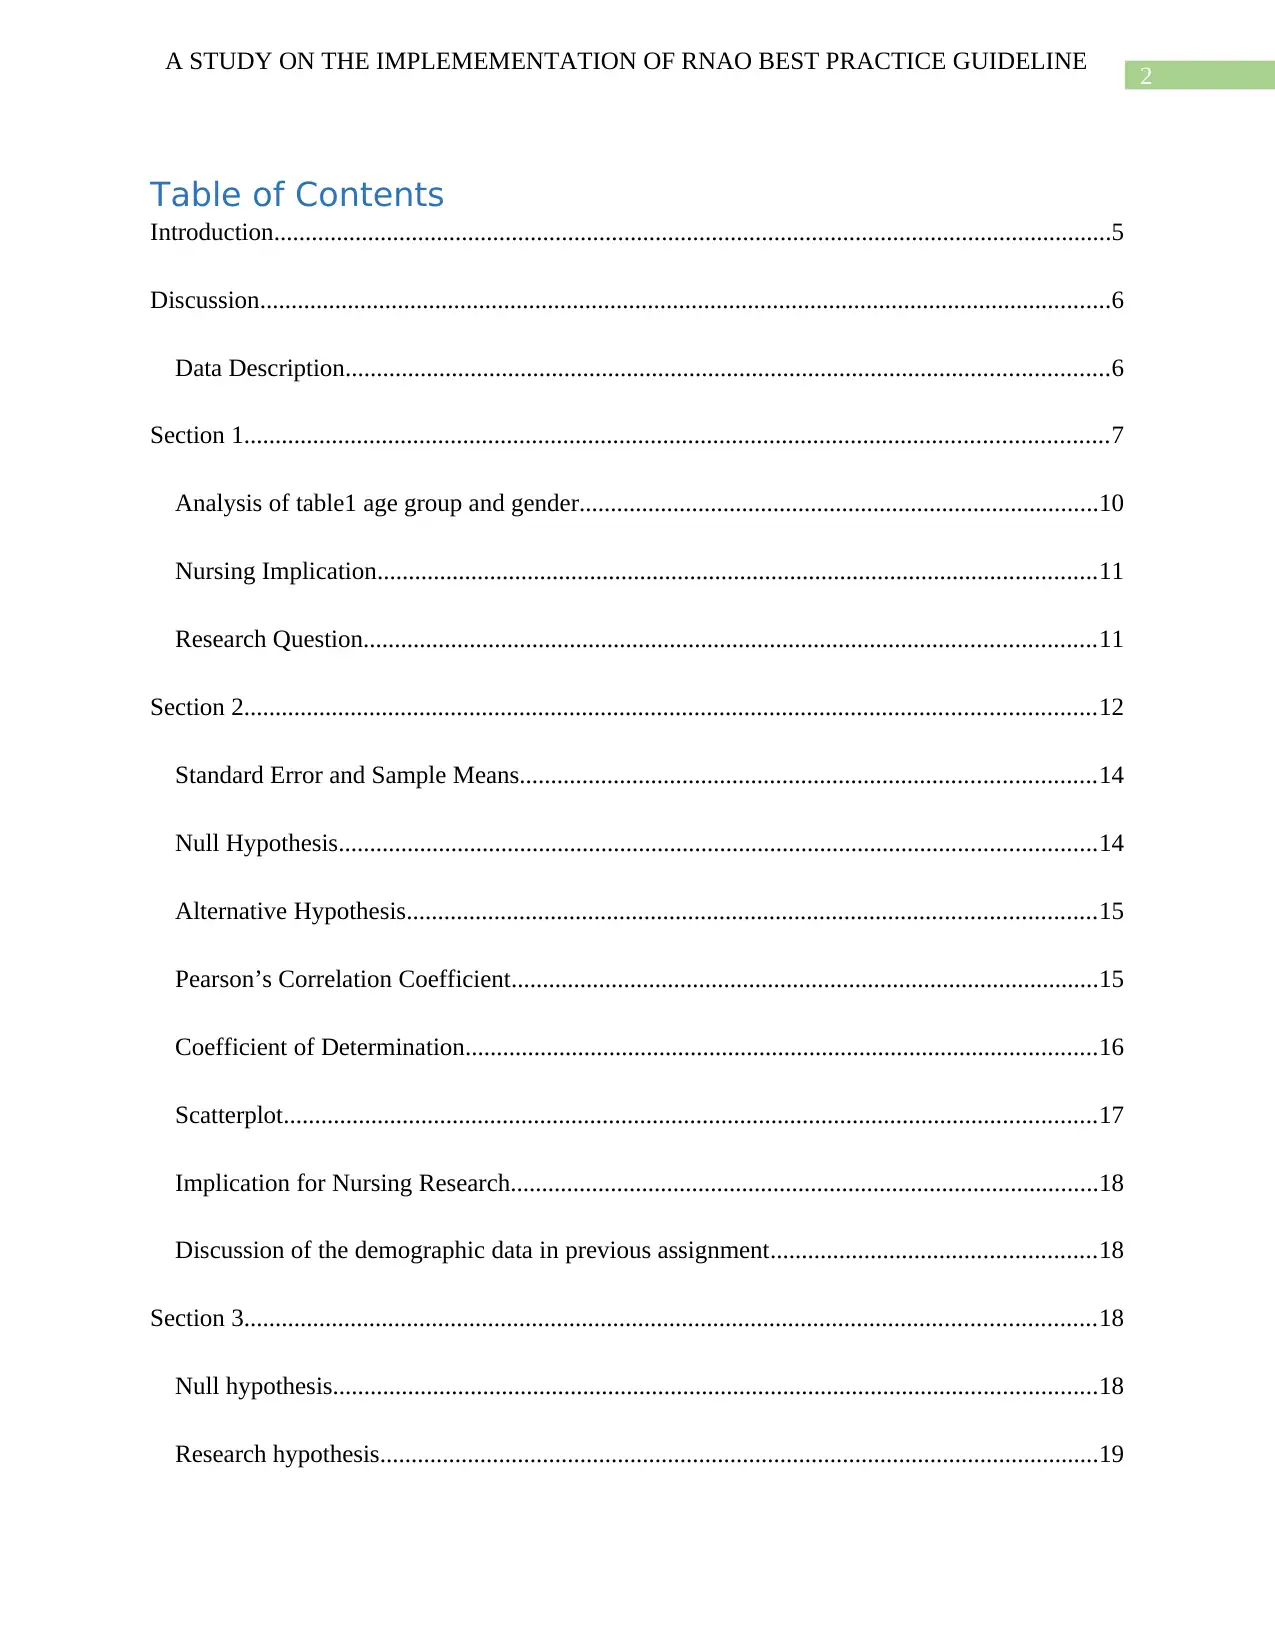
Table of Contents
Introduction......................................................................................................................................5
Discussion........................................................................................................................................6
Data Description..........................................................................................................................6
Section 1..........................................................................................................................................7
Analysis of table1 age group and gender...................................................................................10
Nursing Implication...................................................................................................................11
Research Question.....................................................................................................................11
Section 2........................................................................................................................................12
Standard Error and Sample Means............................................................................................14
Null Hypothesis.........................................................................................................................14
Alternative Hypothesis..............................................................................................................15
Pearson’s Correlation Coefficient..............................................................................................15
Coefficient of Determination.....................................................................................................16
Scatterplot..................................................................................................................................17
Implication for Nursing Research..............................................................................................18
Discussion of the demographic data in previous assignment....................................................18
Section 3........................................................................................................................................18
Null hypothesis..........................................................................................................................18
Research hypothesis...................................................................................................................19
A STUDY ON THE IMPLEMEMENTATION OF RNAO BEST PRACTICE GUIDELINE
Table of Contents
Introduction......................................................................................................................................5
Discussion........................................................................................................................................6
Data Description..........................................................................................................................6
Section 1..........................................................................................................................................7
Analysis of table1 age group and gender...................................................................................10
Nursing Implication...................................................................................................................11
Research Question.....................................................................................................................11
Section 2........................................................................................................................................12
Standard Error and Sample Means............................................................................................14
Null Hypothesis.........................................................................................................................14
Alternative Hypothesis..............................................................................................................15
Pearson’s Correlation Coefficient..............................................................................................15
Coefficient of Determination.....................................................................................................16
Scatterplot..................................................................................................................................17
Implication for Nursing Research..............................................................................................18
Discussion of the demographic data in previous assignment....................................................18
Section 3........................................................................................................................................18
Null hypothesis..........................................................................................................................18
Research hypothesis...................................................................................................................19
⊘ This is a preview!⊘
Do you want full access?
Subscribe today to unlock all pages.
Trusted by 1+ million students worldwide
3
A STUDY ON THE IMPLEMEMENTATION OF RNAO BEST PRACTICE GUIDELINE
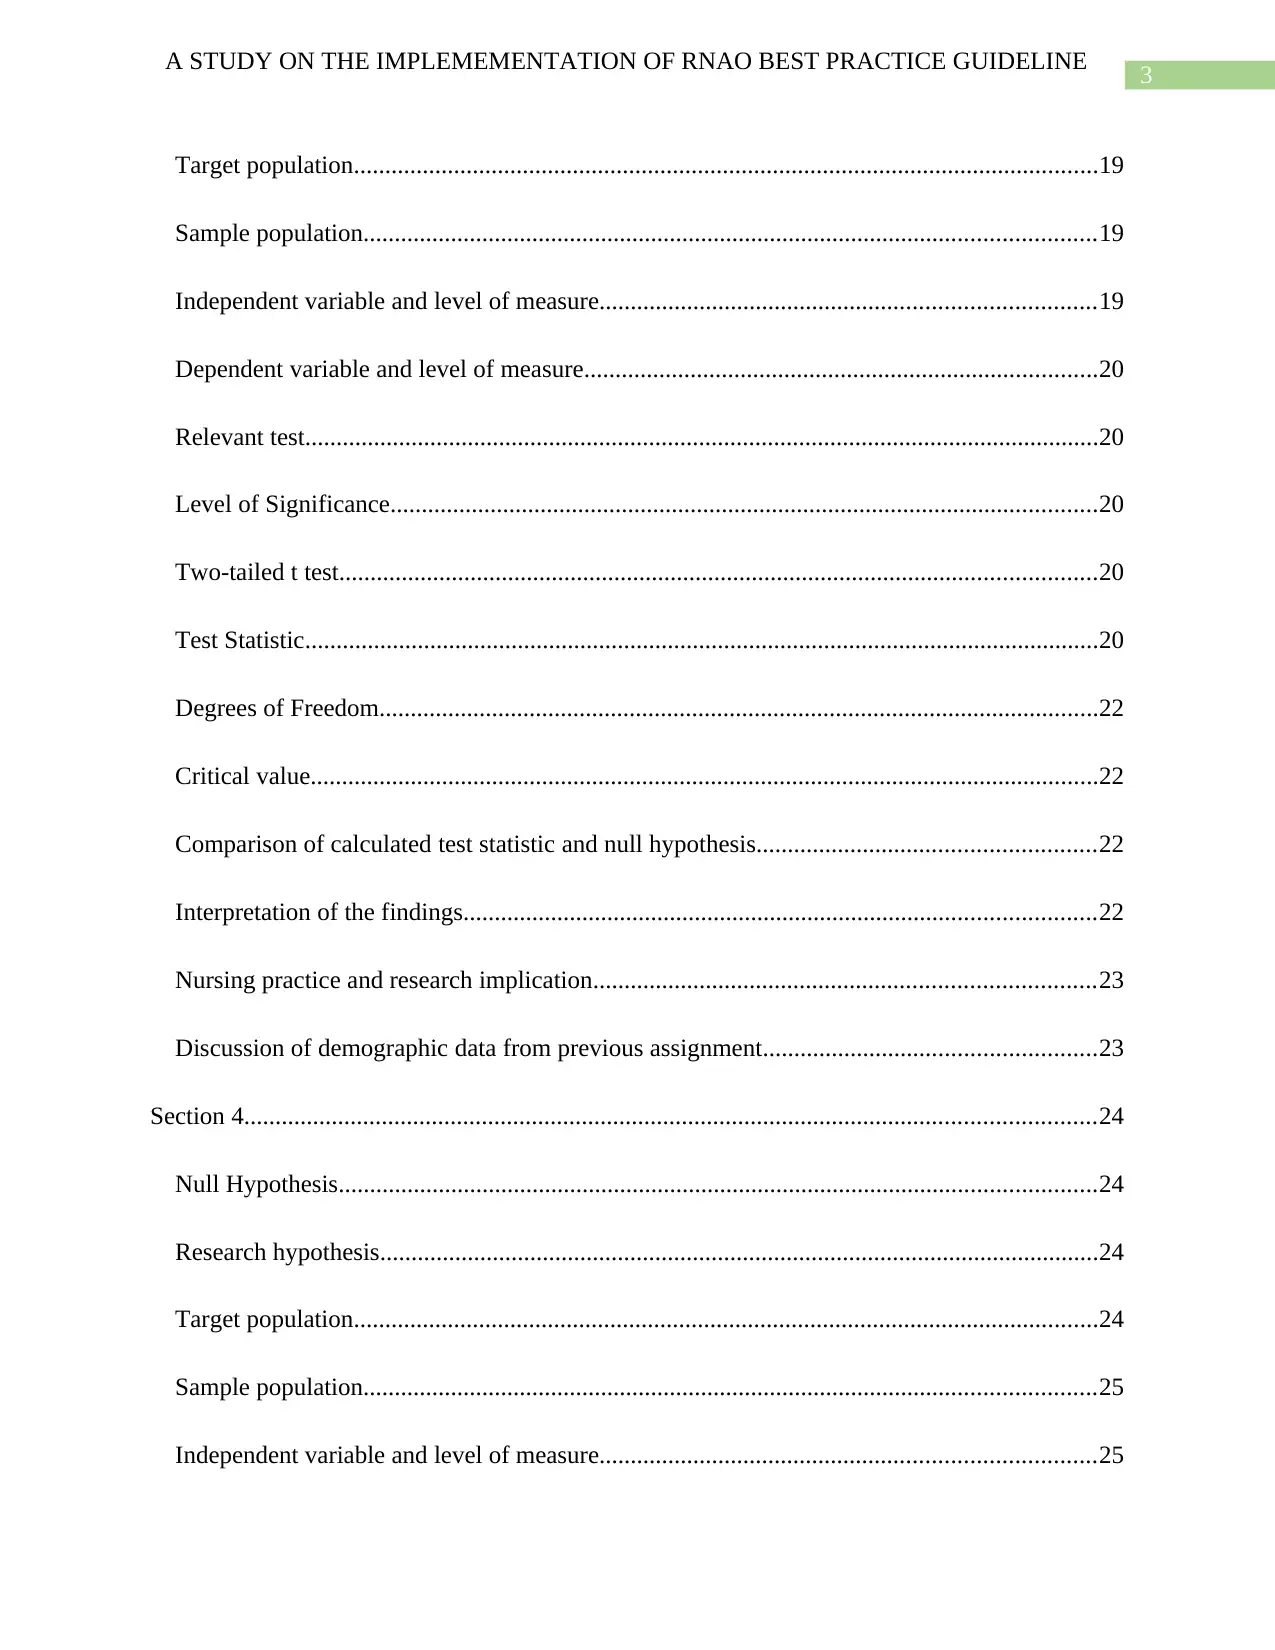
Target population.......................................................................................................................19
Sample population.....................................................................................................................19
Independent variable and level of measure...............................................................................19
Dependent variable and level of measure..................................................................................20
Relevant test...............................................................................................................................20
Level of Significance.................................................................................................................20
Two-tailed t test.........................................................................................................................20
Test Statistic...............................................................................................................................20
Degrees of Freedom...................................................................................................................22
Critical value..............................................................................................................................22
Comparison of calculated test statistic and null hypothesis......................................................22
Interpretation of the findings.....................................................................................................22
Nursing practice and research implication................................................................................23
Discussion of demographic data from previous assignment.....................................................23
Section 4........................................................................................................................................24
Null Hypothesis.........................................................................................................................24
Research hypothesis...................................................................................................................24
Target population.......................................................................................................................24
Sample population.....................................................................................................................25
Independent variable and level of measure...............................................................................25
A STUDY ON THE IMPLEMEMENTATION OF RNAO BEST PRACTICE GUIDELINE
Target population.......................................................................................................................19
Sample population.....................................................................................................................19
Independent variable and level of measure...............................................................................19
Dependent variable and level of measure..................................................................................20
Relevant test...............................................................................................................................20
Level of Significance.................................................................................................................20
Two-tailed t test.........................................................................................................................20
Test Statistic...............................................................................................................................20
Degrees of Freedom...................................................................................................................22
Critical value..............................................................................................................................22
Comparison of calculated test statistic and null hypothesis......................................................22
Interpretation of the findings.....................................................................................................22
Nursing practice and research implication................................................................................23
Discussion of demographic data from previous assignment.....................................................23
Section 4........................................................................................................................................24
Null Hypothesis.........................................................................................................................24
Research hypothesis...................................................................................................................24
Target population.......................................................................................................................24
Sample population.....................................................................................................................25
Independent variable and level of measure...............................................................................25
Paraphrase This Document
Need a fresh take? Get an instant paraphrase of this document with our AI Paraphraser
4
A STUDY ON THE IMPLEMEMENTATION OF RNAO BEST PRACTICE GUIDELINE
Dependent variable and level of measure..................................................................................25
Test to be done...........................................................................................................................25
Level of significance..................................................................................................................25
Test............................................................................................................................................26
Degrees of Freedom...................................................................................................................27
Critical Value.............................................................................................................................27
Comparison of calculated statistic and null hypothesis.............................................................27
Interpretation of findings...........................................................................................................27
Nursing implication...................................................................................................................28
Discussion of demographic data from previous assignment.....................................................28
Conclusion.....................................................................................................................................29
References......................................................................................................................................31
5
A STUDY ON THE IMPLEMEMENTATION OF RNAO BEST PRACTICE GUIDELINE
Introduction
A group of researchers want to find the effectiveness of RNAO best practice guideline in
a South Ontario hospital (Antunes et al.,2018). The dataset consists of demographic records of
60 nurses. At first four pivot tables are constructed (Cosma, 2019). First table shows the
frequency distribution of age group and gender of the nurses. Second table shows the frequencies
of age group and professional designation of the nurses. The frequency distribution of
professional designation based on gender is displayed in the third table. The fourth table shows
the relation between employment category and gender of the nurses. Now a descriptive analysis
is worked out for the variables–perceived value of the patient wishes in adaptation of best
practice recommendation and authoritarian/collaboration score (Johnson, 2014). A correlation
analysis is also performed to find out the relationship between these two variables (Cumming, &
Calin-Jageman, 2016). Section 3 studies the effect of change in hospital environment. Here the
objective is to find whether the response towards the change in hospital environment is
independent of the gender of a nurse. Since the study revolves around the difference in opinion
of two groups, it is reasonable to use the paired t-test or the dependent sample t-test. Before
conducting the test, the null and alternate hypothesis, independent and dependent variables, level
of significance are all clearly stated to avoid any confusion. Then the t-test is performed and
based on the result the decision about the research question is taken. The last section of this
entire study shows the relation between attitude score and age groups. Here the researcher wants
to know if the reaction to the change is dependent on the age of a nurse. Since age is a
continuous variable it is converted into three age groups for ease of calculations. A one way
ANOVA test is conducted to check if there is any significant difference in opinion of a young
and an experienced nurse. The result is then interpreted to find out relevant conclusion.
⊘ This is a preview!⊘
Do you want full access?
Subscribe today to unlock all pages.
Trusted by 1+ million students worldwide
6
A STUDY ON THE IMPLEMEMENTATION OF RNAO BEST PRACTICE GUIDELINE
Discussion
Data Description
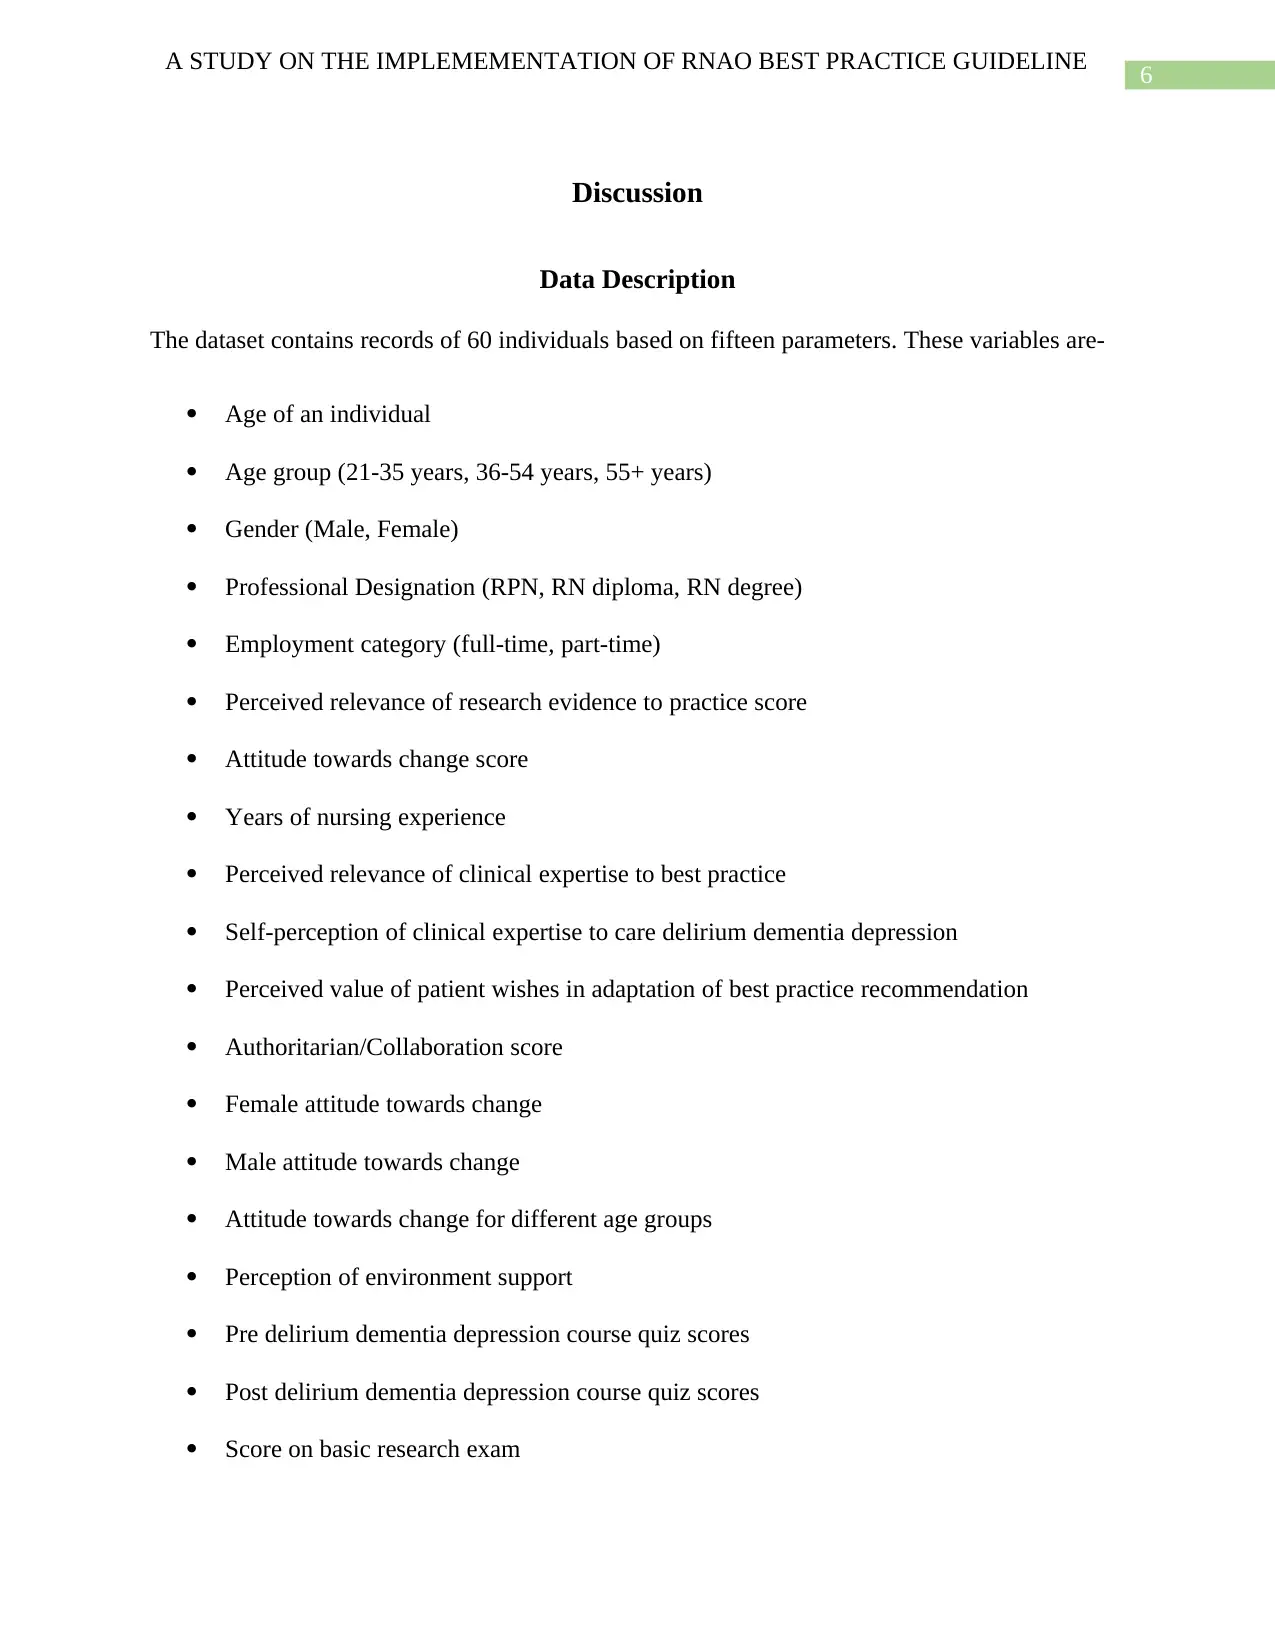
The dataset contains records of 60 individuals based on fifteen parameters. These variables are-
Age of an individual
Age group (21-35 years, 36-54 years, 55+ years)
Gender (Male, Female)
Professional Designation (RPN, RN diploma, RN degree)
Employment category (full-time, part-time)
Perceived relevance of research evidence to practice score
Attitude towards change score
Years of nursing experience
Perceived relevance of clinical expertise to best practice
Self-perception of clinical expertise to care delirium dementia depression
Perceived value of patient wishes in adaptation of best practice recommendation
Authoritarian/Collaboration score
Female attitude towards change
Male attitude towards change
Attitude towards change for different age groups
Perception of environment support
Pre delirium dementia depression course quiz scores
Post delirium dementia depression course quiz scores
Score on basic research exam
A STUDY ON THE IMPLEMEMENTATION OF RNAO BEST PRACTICE GUIDELINE
Discussion
Data Description
The dataset contains records of 60 individuals based on fifteen parameters. These variables are-
Age of an individual
Age group (21-35 years, 36-54 years, 55+ years)
Gender (Male, Female)
Professional Designation (RPN, RN diploma, RN degree)
Employment category (full-time, part-time)
Perceived relevance of research evidence to practice score
Attitude towards change score
Years of nursing experience
Perceived relevance of clinical expertise to best practice
Self-perception of clinical expertise to care delirium dementia depression
Perceived value of patient wishes in adaptation of best practice recommendation
Authoritarian/Collaboration score
Female attitude towards change
Male attitude towards change
Attitude towards change for different age groups
Perception of environment support
Pre delirium dementia depression course quiz scores
Post delirium dementia depression course quiz scores
Score on basic research exam
Paraphrase This Document
Need a fresh take? Get an instant paraphrase of this document with our AI Paraphraser
7
A STUDY ON THE IMPLEMEMENTATION OF RNAO BEST PRACTICE GUIDELINE
Willingness to search for any evidence informed guideline
Section 1
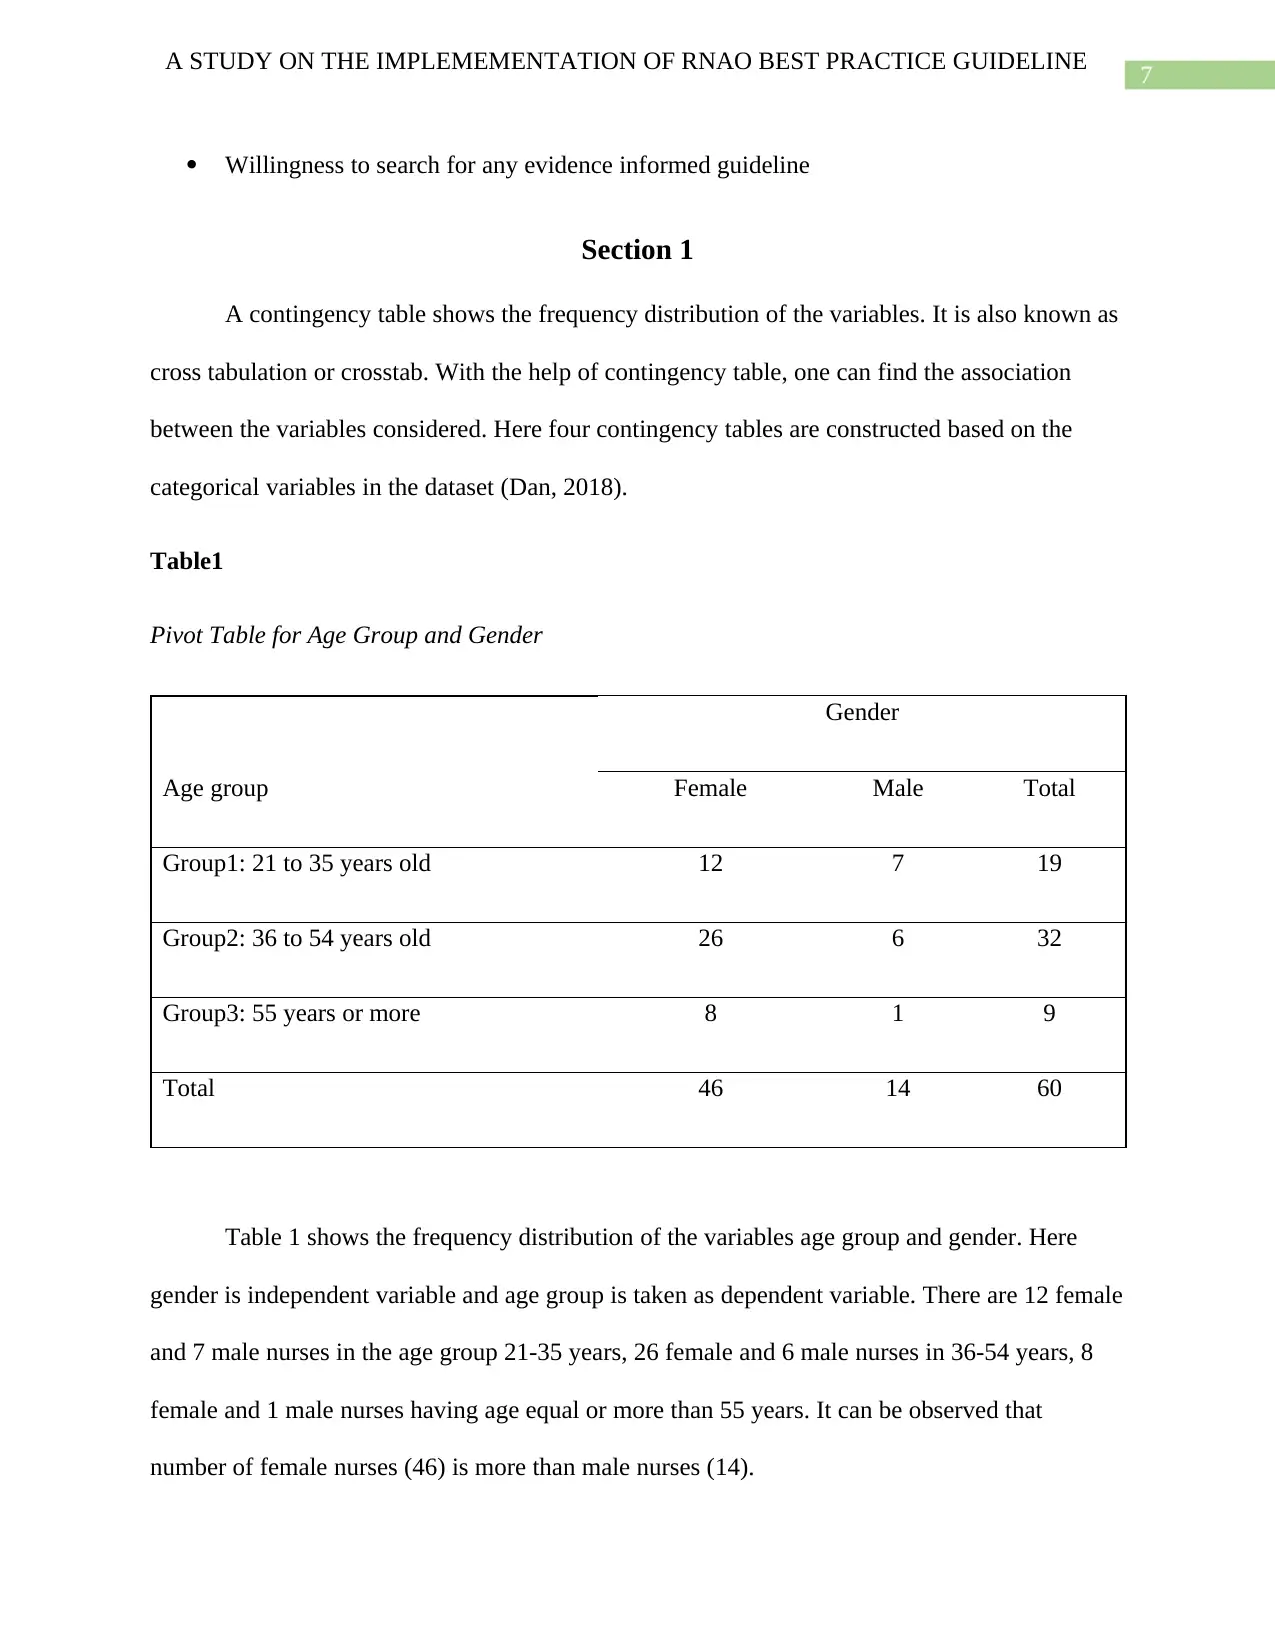
A contingency table shows the frequency distribution of the variables. It is also known as
cross tabulation or crosstab. With the help of contingency table, one can find the association
between the variables considered. Here four contingency tables are constructed based on the
categorical variables in the dataset (Dan, 2018).
Table1
Pivot Table for Age Group and Gender
Age group
Gender
Female Male Total
Group1: 21 to 35 years old 12 7 19
Group2: 36 to 54 years old 26 6 32
Group3: 55 years or more 8 1 9
Total 46 14 60
Table 1 shows the frequency distribution of the variables age group and gender. Here
gender is independent variable and age group is taken as dependent variable. There are 12 female
and 7 male nurses in the age group 21-35 years, 26 female and 6 male nurses in 36-54 years, 8
female and 1 male nurses having age equal or more than 55 years. It can be observed that
number of female nurses (46) is more than male nurses (14).
A STUDY ON THE IMPLEMEMENTATION OF RNAO BEST PRACTICE GUIDELINE
Willingness to search for any evidence informed guideline
Section 1
A contingency table shows the frequency distribution of the variables. It is also known as
cross tabulation or crosstab. With the help of contingency table, one can find the association
between the variables considered. Here four contingency tables are constructed based on the
categorical variables in the dataset (Dan, 2018).
Table1
Pivot Table for Age Group and Gender
Age group
Gender
Female Male Total
Group1: 21 to 35 years old 12 7 19
Group2: 36 to 54 years old 26 6 32
Group3: 55 years or more 8 1 9
Total 46 14 60
Table 1 shows the frequency distribution of the variables age group and gender. Here
gender is independent variable and age group is taken as dependent variable. There are 12 female
and 7 male nurses in the age group 21-35 years, 26 female and 6 male nurses in 36-54 years, 8
female and 1 male nurses having age equal or more than 55 years. It can be observed that
number of female nurses (46) is more than male nurses (14).
8
A STUDY ON THE IMPLEMEMENTATION OF RNAO BEST PRACTICE GUIDELINE
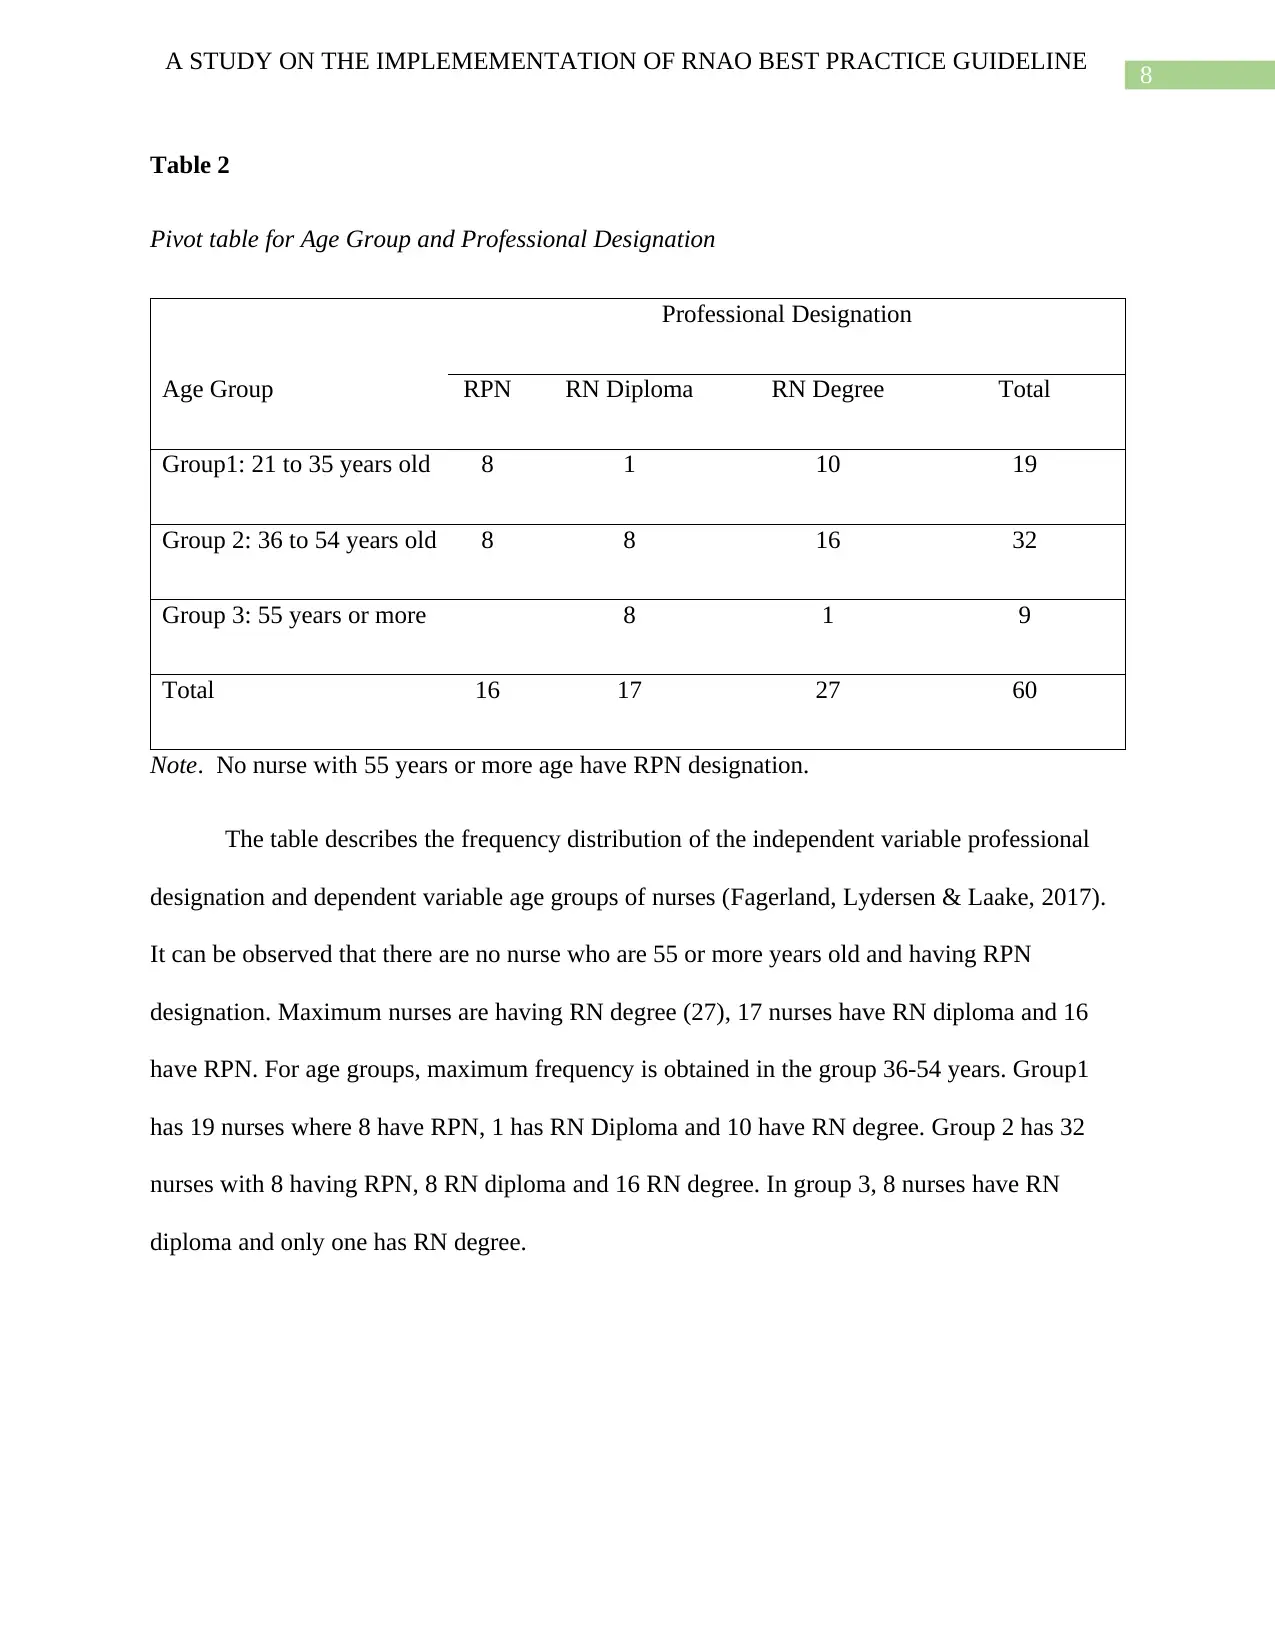
Table 2
Pivot table for Age Group and Professional Designation
Age Group
Professional Designation
RPN RN Diploma RN Degree Total
Group1: 21 to 35 years old 8 1 10 19
Group 2: 36 to 54 years old 8 8 16 32
Group 3: 55 years or more 8 1 9
Total 16 17 27 60
Note. No nurse with 55 years or more age have RPN designation.
The table describes the frequency distribution of the independent variable professional
designation and dependent variable age groups of nurses (Fagerland, Lydersen & Laake, 2017).
It can be observed that there are no nurse who are 55 or more years old and having RPN
designation. Maximum nurses are having RN degree (27), 17 nurses have RN diploma and 16
have RPN. For age groups, maximum frequency is obtained in the group 36-54 years. Group1
has 19 nurses where 8 have RPN, 1 has RN Diploma and 10 have RN degree. Group 2 has 32
nurses with 8 having RPN, 8 RN diploma and 16 RN degree. In group 3, 8 nurses have RN
diploma and only one has RN degree.
A STUDY ON THE IMPLEMEMENTATION OF RNAO BEST PRACTICE GUIDELINE
Table 2
Pivot table for Age Group and Professional Designation
Age Group
Professional Designation
RPN RN Diploma RN Degree Total
Group1: 21 to 35 years old 8 1 10 19
Group 2: 36 to 54 years old 8 8 16 32
Group 3: 55 years or more 8 1 9
Total 16 17 27 60
Note. No nurse with 55 years or more age have RPN designation.
The table describes the frequency distribution of the independent variable professional
designation and dependent variable age groups of nurses (Fagerland, Lydersen & Laake, 2017).
It can be observed that there are no nurse who are 55 or more years old and having RPN
designation. Maximum nurses are having RN degree (27), 17 nurses have RN diploma and 16
have RPN. For age groups, maximum frequency is obtained in the group 36-54 years. Group1
has 19 nurses where 8 have RPN, 1 has RN Diploma and 10 have RN degree. Group 2 has 32
nurses with 8 having RPN, 8 RN diploma and 16 RN degree. In group 3, 8 nurses have RN
diploma and only one has RN degree.
⊘ This is a preview!⊘
Do you want full access?
Subscribe today to unlock all pages.
Trusted by 1+ million students worldwide
9
A STUDY ON THE IMPLEMEMENTATION OF RNAO BEST PRACTICE GUIDELINE
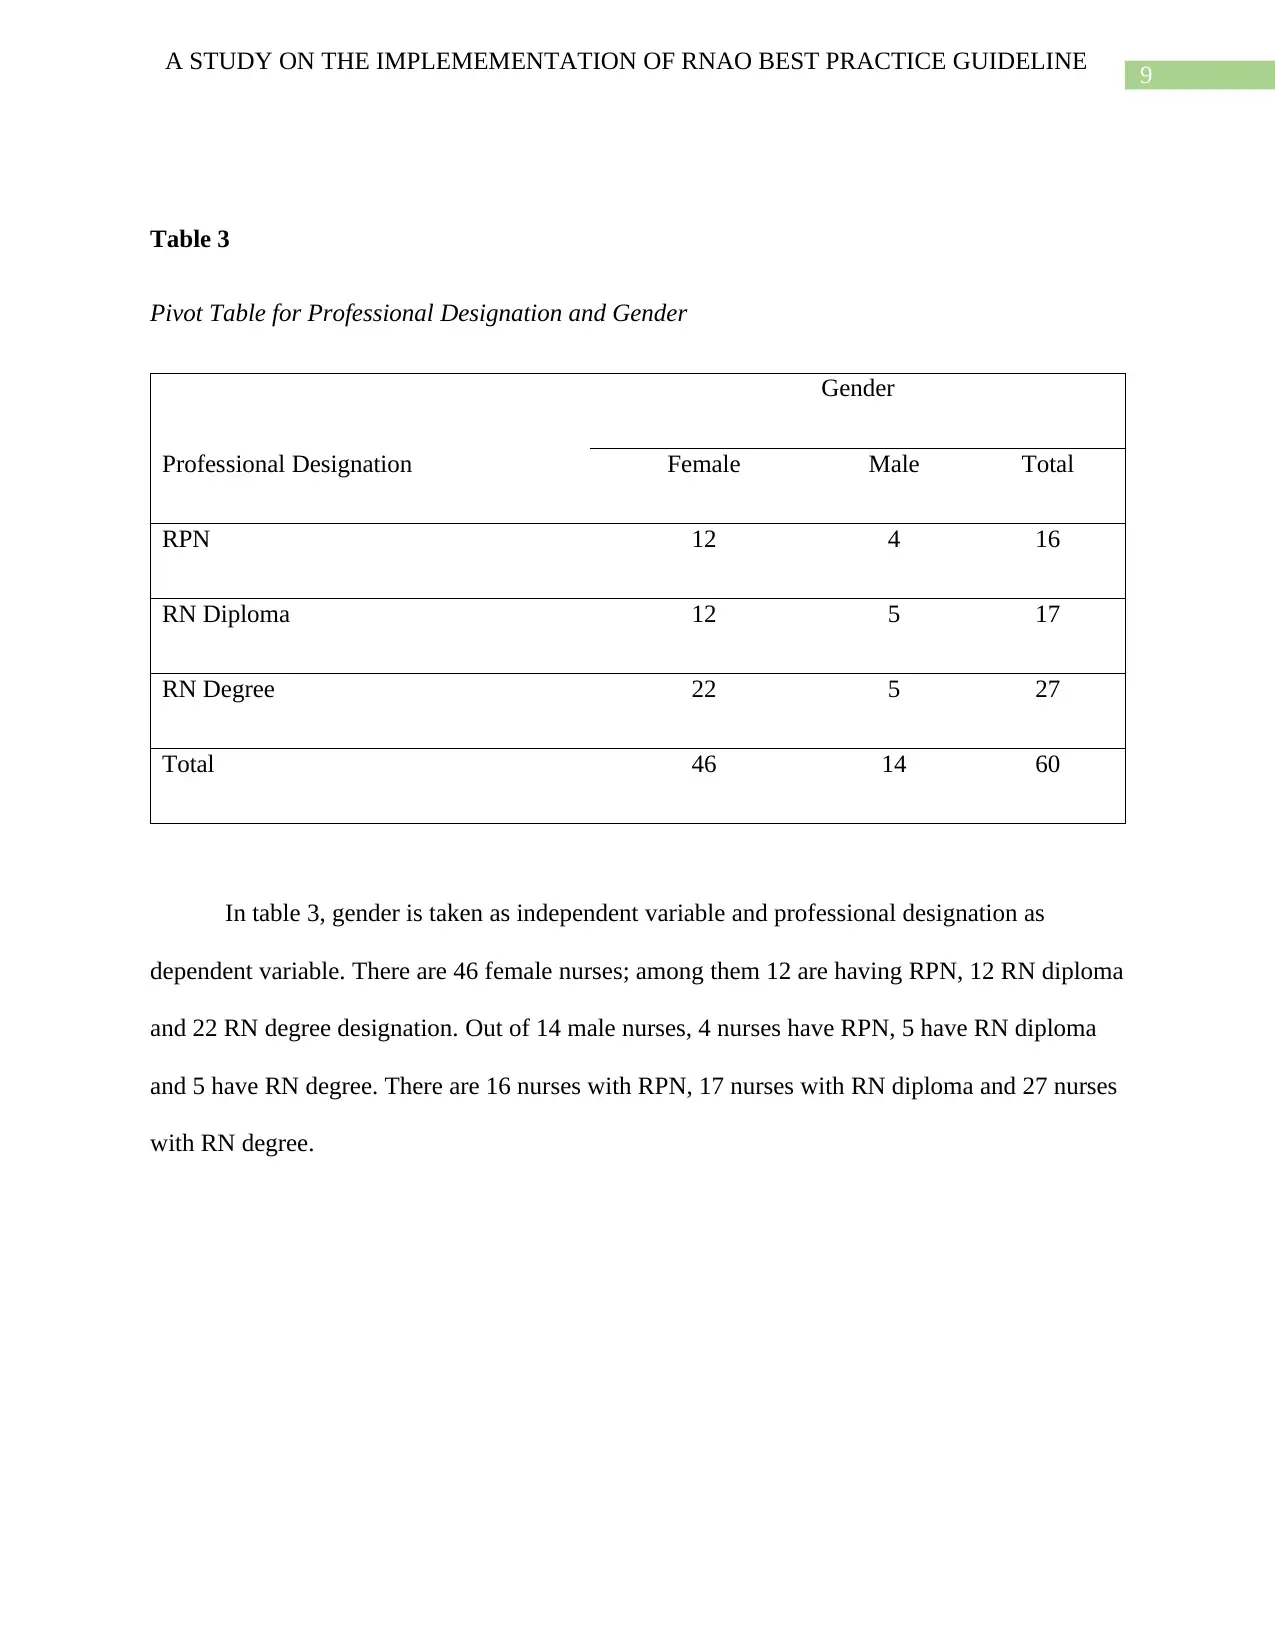
Table 3
Pivot Table for Professional Designation and Gender
Professional Designation
Gender
Female Male Total
RPN 12 4 16
RN Diploma 12 5 17
RN Degree 22 5 27
Total 46 14 60
In table 3, gender is taken as independent variable and professional designation as
dependent variable. There are 46 female nurses; among them 12 are having RPN, 12 RN diploma
and 22 RN degree designation. Out of 14 male nurses, 4 nurses have RPN, 5 have RN diploma
and 5 have RN degree. There are 16 nurses with RPN, 17 nurses with RN diploma and 27 nurses
with RN degree.
A STUDY ON THE IMPLEMEMENTATION OF RNAO BEST PRACTICE GUIDELINE
Table 3
Pivot Table for Professional Designation and Gender
Professional Designation
Gender
Female Male Total
RPN 12 4 16
RN Diploma 12 5 17
RN Degree 22 5 27
Total 46 14 60
In table 3, gender is taken as independent variable and professional designation as
dependent variable. There are 46 female nurses; among them 12 are having RPN, 12 RN diploma
and 22 RN degree designation. Out of 14 male nurses, 4 nurses have RPN, 5 have RN diploma
and 5 have RN degree. There are 16 nurses with RPN, 17 nurses with RN diploma and 27 nurses
with RN degree.
Paraphrase This Document
Need a fresh take? Get an instant paraphrase of this document with our AI Paraphraser
10
A STUDY ON THE IMPLEMEMENTATION OF RNAO BEST PRACTICE GUIDELINE
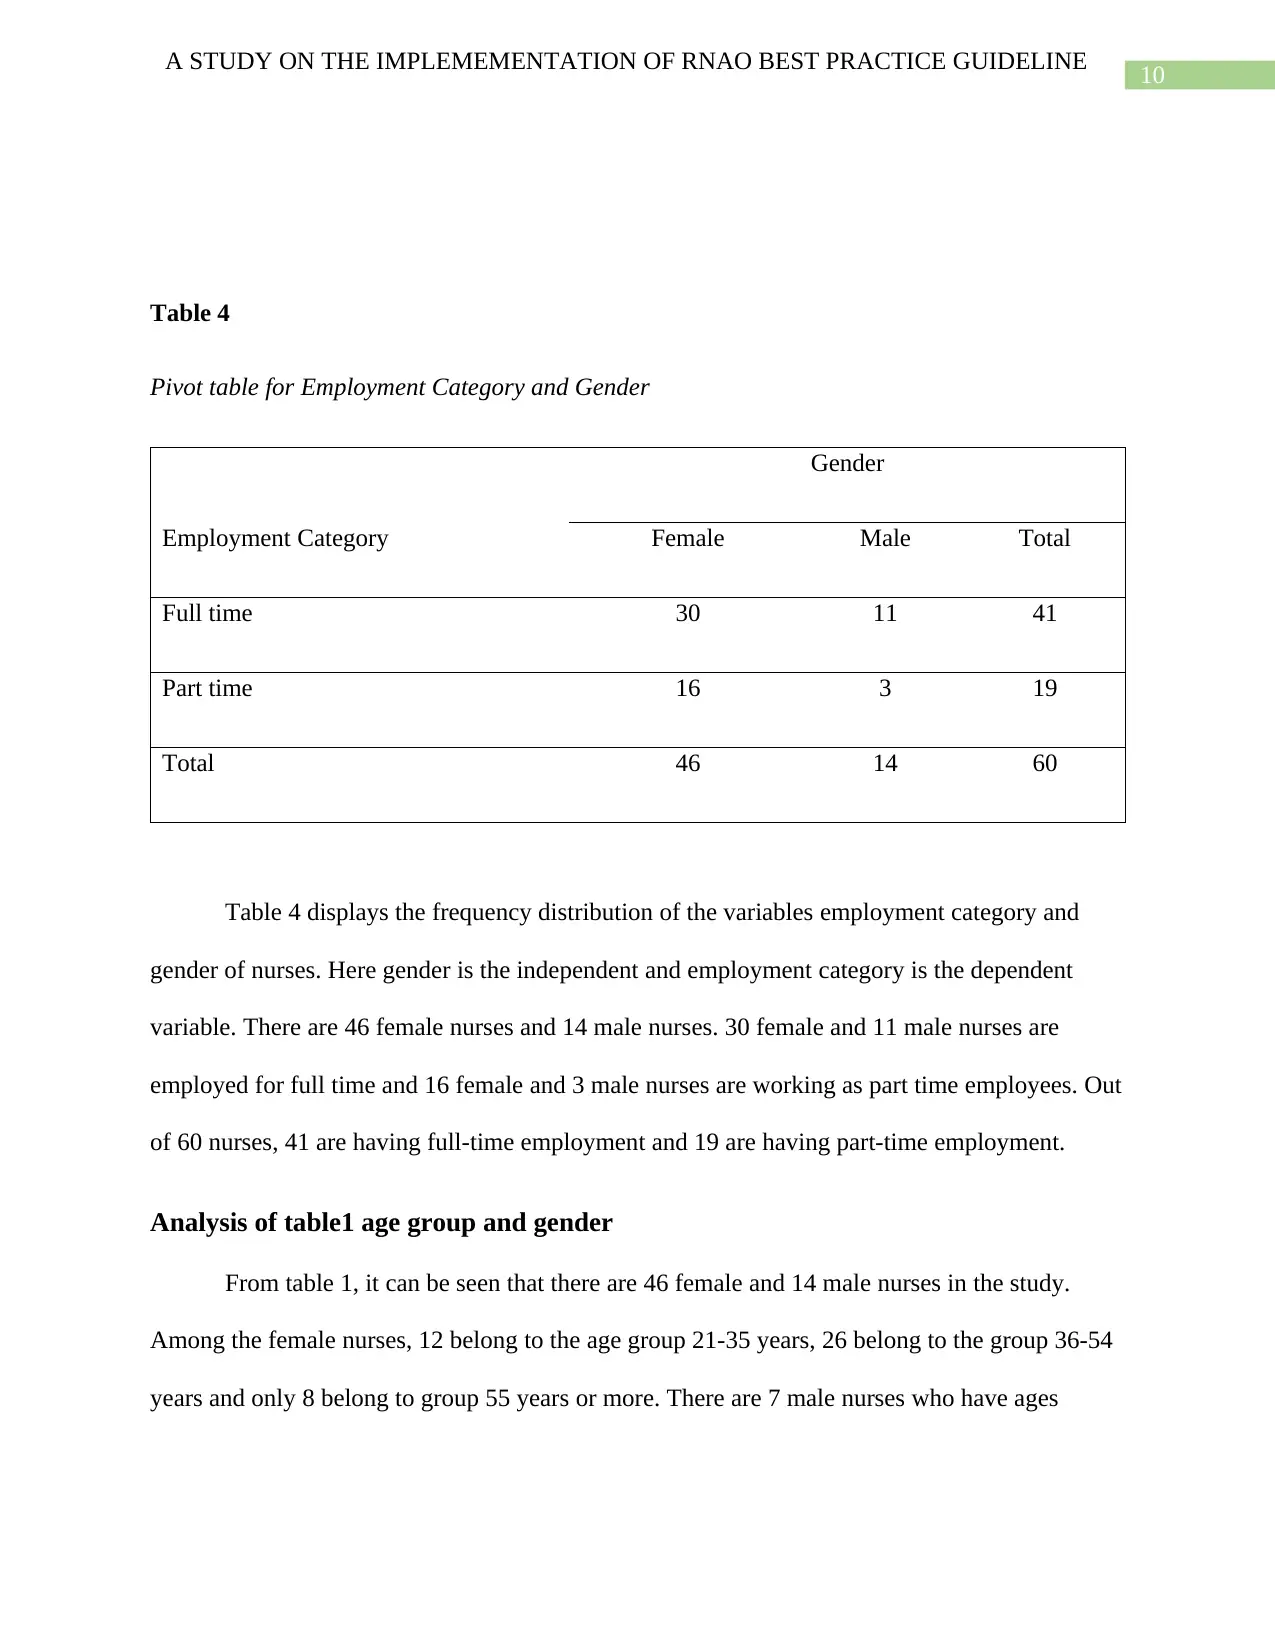
Table 4
Pivot table for Employment Category and Gender
Employment Category
Gender
Female Male Total
Full time 30 11 41
Part time 16 3 19
Total 46 14 60
Table 4 displays the frequency distribution of the variables employment category and
gender of nurses. Here gender is the independent and employment category is the dependent
variable. There are 46 female nurses and 14 male nurses. 30 female and 11 male nurses are
employed for full time and 16 female and 3 male nurses are working as part time employees. Out
of 60 nurses, 41 are having full-time employment and 19 are having part-time employment.
Analysis of table1 age group and gender
From table 1, it can be seen that there are 46 female and 14 male nurses in the study.
Among the female nurses, 12 belong to the age group 21-35 years, 26 belong to the group 36-54
years and only 8 belong to group 55 years or more. There are 7 male nurses who have ages
A STUDY ON THE IMPLEMEMENTATION OF RNAO BEST PRACTICE GUIDELINE
Table 4
Pivot table for Employment Category and Gender
Employment Category
Gender
Female Male Total
Full time 30 11 41
Part time 16 3 19
Total 46 14 60
Table 4 displays the frequency distribution of the variables employment category and
gender of nurses. Here gender is the independent and employment category is the dependent
variable. There are 46 female nurses and 14 male nurses. 30 female and 11 male nurses are
employed for full time and 16 female and 3 male nurses are working as part time employees. Out
of 60 nurses, 41 are having full-time employment and 19 are having part-time employment.
Analysis of table1 age group and gender
From table 1, it can be seen that there are 46 female and 14 male nurses in the study.
Among the female nurses, 12 belong to the age group 21-35 years, 26 belong to the group 36-54
years and only 8 belong to group 55 years or more. There are 7 male nurses who have ages
11
A STUDY ON THE IMPLEMEMENTATION OF RNAO BEST PRACTICE GUIDELINE
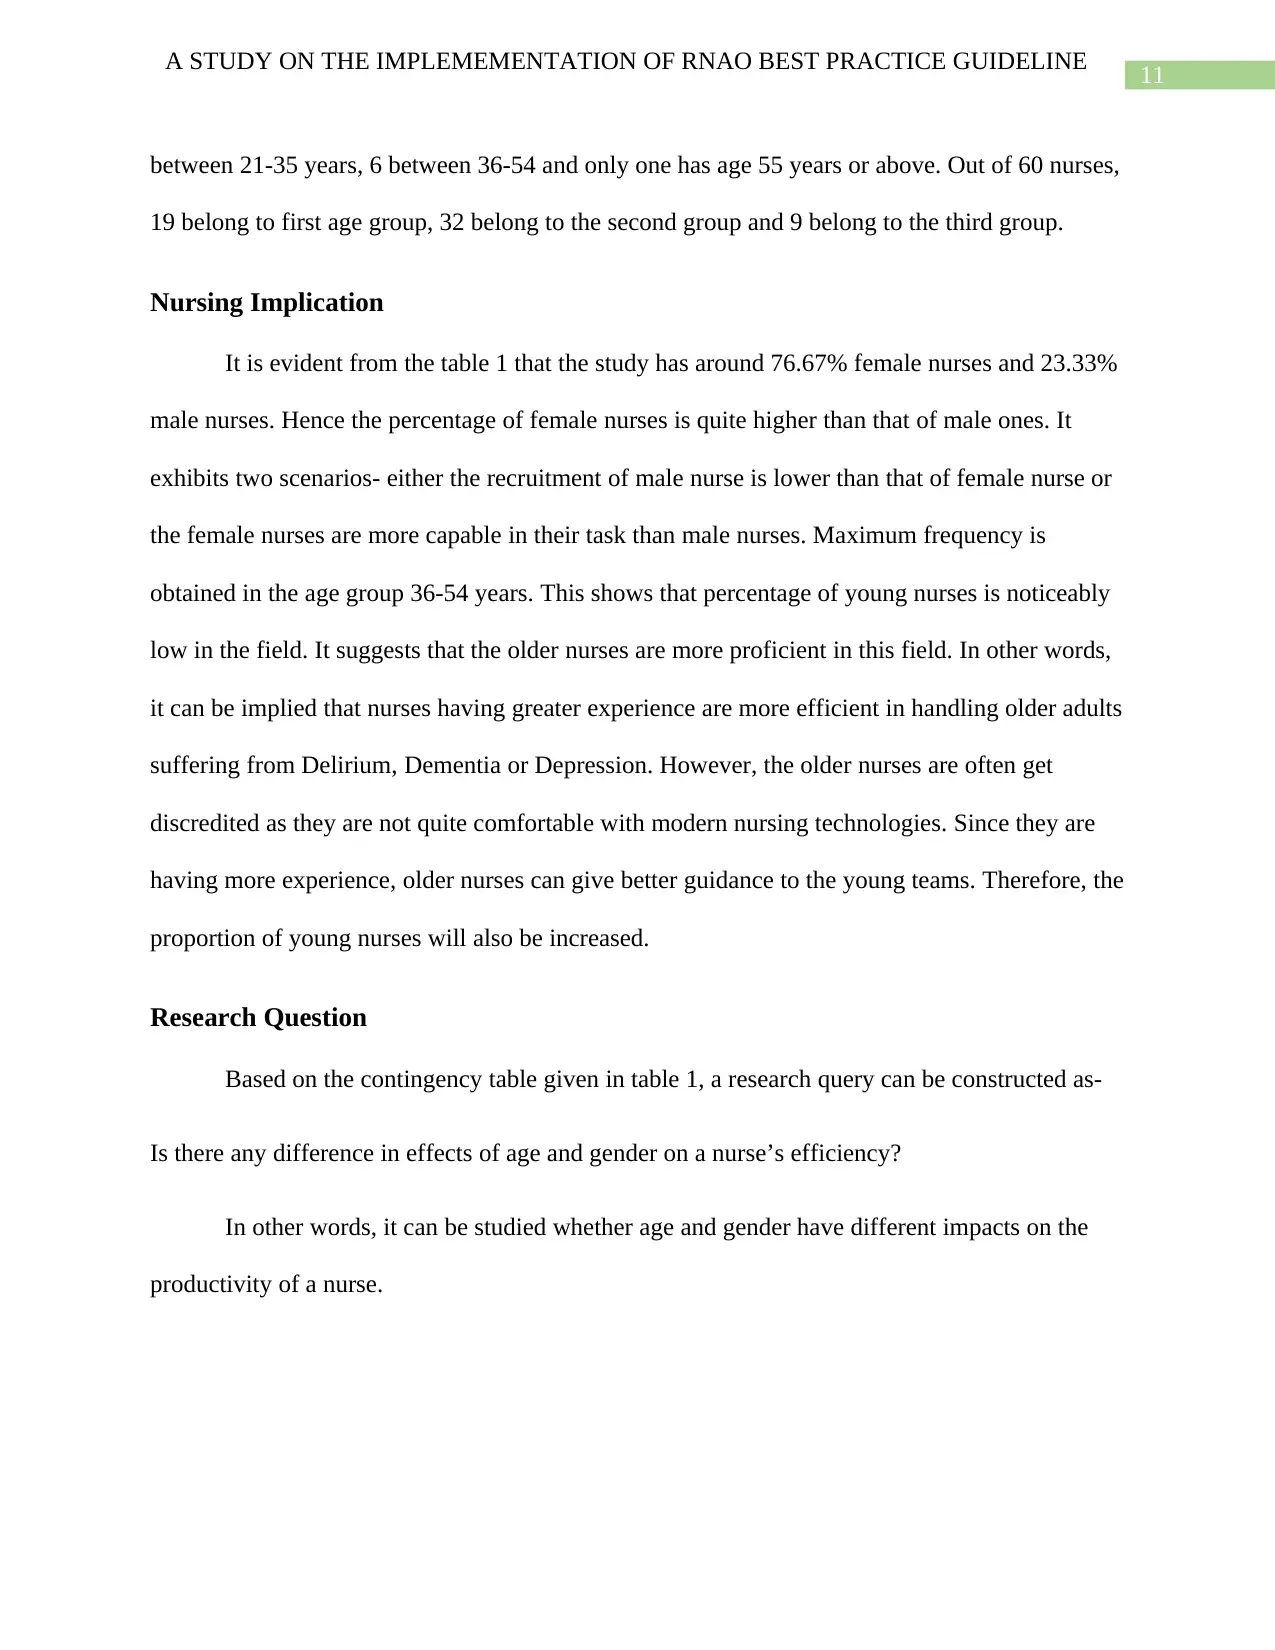
between 21-35 years, 6 between 36-54 and only one has age 55 years or above. Out of 60 nurses,
19 belong to first age group, 32 belong to the second group and 9 belong to the third group.
Nursing Implication
It is evident from the table 1 that the study has around 76.67% female nurses and 23.33%
male nurses. Hence the percentage of female nurses is quite higher than that of male ones. It
exhibits two scenarios- either the recruitment of male nurse is lower than that of female nurse or
the female nurses are more capable in their task than male nurses. Maximum frequency is
obtained in the age group 36-54 years. This shows that percentage of young nurses is noticeably
low in the field. It suggests that the older nurses are more proficient in this field. In other words,
it can be implied that nurses having greater experience are more efficient in handling older adults
suffering from Delirium, Dementia or Depression. However, the older nurses are often get
discredited as they are not quite comfortable with modern nursing technologies. Since they are
having more experience, older nurses can give better guidance to the young teams. Therefore, the
proportion of young nurses will also be increased.
Research Question
Based on the contingency table given in table 1, a research query can be constructed as-
Is there any difference in effects of age and gender on a nurse’s efficiency?
In other words, it can be studied whether age and gender have different impacts on the
productivity of a nurse.
A STUDY ON THE IMPLEMEMENTATION OF RNAO BEST PRACTICE GUIDELINE
between 21-35 years, 6 between 36-54 and only one has age 55 years or above. Out of 60 nurses,
19 belong to first age group, 32 belong to the second group and 9 belong to the third group.
Nursing Implication
It is evident from the table 1 that the study has around 76.67% female nurses and 23.33%
male nurses. Hence the percentage of female nurses is quite higher than that of male ones. It
exhibits two scenarios- either the recruitment of male nurse is lower than that of female nurse or
the female nurses are more capable in their task than male nurses. Maximum frequency is
obtained in the age group 36-54 years. This shows that percentage of young nurses is noticeably
low in the field. It suggests that the older nurses are more proficient in this field. In other words,
it can be implied that nurses having greater experience are more efficient in handling older adults
suffering from Delirium, Dementia or Depression. However, the older nurses are often get
discredited as they are not quite comfortable with modern nursing technologies. Since they are
having more experience, older nurses can give better guidance to the young teams. Therefore, the
proportion of young nurses will also be increased.
Research Question
Based on the contingency table given in table 1, a research query can be constructed as-
Is there any difference in effects of age and gender on a nurse’s efficiency?
In other words, it can be studied whether age and gender have different impacts on the
productivity of a nurse.
⊘ This is a preview!⊘
Do you want full access?
Subscribe today to unlock all pages.
Trusted by 1+ million students worldwide
1 out of 36
Related Documents


Your All-in-One AI-Powered Toolkit for Academic Success.
+13062052269
info@desklib.com
Available 24*7 on WhatsApp / Email
![[object Object]](/_next/static/media/star-bottom.7253800d.svg)
Unlock your academic potential
Copyright © 2020–2026 A2Z Services. All Rights Reserved. Developed and managed by ZUCOL.