Road Accident Death Rate Analysis: Gender and Age Comparison
VerifiedAdded on 2021/05/31
|19
|3652
|76
Report
AI Summary
This research report analyzes road accident death rates in the United States, focusing on data from 2012 and 2014. The study investigates the impact of gender and age on motor vehicle occupant deaths. The methodology involves a survey design, utilizing secondary data from various states. Statistical methods, including descriptive and inferential statistics (t-tests, Pearson correlation, and regression analysis), are employed to examine the data. The findings reveal significant differences in death rates between males and females, with males consistently exhibiting higher rates. Descriptive statistics provide insights into mean, median, mode, standard deviation, and other measures. Furthermore, the report explores the rate of accidents in different states and their common causes. Reliability and validity tests were conducted to ensure data integrity, with a Cronbach's alpha of 0.971 indicating high internal consistency. The study concludes by presenting these statistical analyses and findings, offering valuable information for road safety interventions and enriching the existing literature on road accidents.

Research report 1
Name:
Institution:
Date:
Name:
Institution:
Date:
Paraphrase This Document
Need a fresh take? Get an instant paraphrase of this document with our AI Paraphraser
Research report 2
1.0 Introduction
1.1 Background
Road accident has been identified as one of the major contributor to national deaths in so many
countries. The accidents have been found to be caused by various reasons such as reckless
driving, unroadworthy vehicles, driving while under the influence of alcohol and poor states of
roads to mention but a few (Sidhu & Sodi, 2013). The accidents have not only claimed the life of
the occupants of the vehicles but also those who walk as pedestrians along the roads. Many
interventions have been put by governments through relevant departments to ensure the rate of
road carnage has been brought down significantly (Onokala, 2015) and (Smith, 2009). This has
been in an effort to help the traffic police. In some countries, apart from the traffic police,
departments such as department of transport and transport safety authorities have been instituted
to ensure road safety. Apart from using institutions, guides such as road signs have been used
(Bolade, 2013). These have been erected everywhere along the road so as to guide drivers on the
state of the road and the environment they are driving in. Road safety campaigns have also been
taken to the masses to scale down road accidents (Stansfield & McGreevy, 2008). The other
element that has contributed to the number of accidents on the roads is the use of motorcycles.
This is very common in cities and urban areas where passengers use the motorcycles during peak
hours to avoid being trapped in traffic snarl (Robertson, 2012) and (Ross, 2011). As a result of
greed to make more money, the motorcycle riders take advantage of these situations and speed t
in between the vehicles so as to make numerous trips thus causing accidents.
Research report 3
1.2 Statement of the problem
It is natural to conclude that accidents are not planned and that they occur randomly. On the
same breathe, it can be said that males and females get involved in the accident without any
pattern because it is a random occurrence. People of all ages also get involved in the accidents
without any pattern. This report sought to establish whether there is significant difference in the
number of females and males that die in road accident in the states of America in 2012. The
report also wants to establish whether there is a difference of the same among various age
groups. To be able to accomplish this task, the report sourced data from motor vehicle safety
website while others were collected.
1.3 Justification of the use of sample data
Since this report was dealing in deaths due to road accidents, data regarding the same was
collected. A sample data was used since this was an accurate representation of the entire
population. It had the characteristics that the report was focused on analyzing. These were motor
vehicle occupants’ death rates in the United States. The parameters under investigation in this
report are occupants’ death rate by age and occupants’ death rate by gender. It will not be easy to
categorize the variables in this data as either dependent or independent. This will only be
possible in the context of various tests that will be conducted in the sections to follow.
1.4 Research objectives
i. To establish the rate of accidents in different states of the United States.
ii. To identify the common causes of road accidents.
iii. To find out whether there is a difference in the number of deaths as a result of accidents
by gender.
⊘ This is a preview!⊘
Do you want full access?
Subscribe today to unlock all pages.
Trusted by 1+ million students worldwide
Research report 4
iv. To find out whether there is a difference in the number of deaths as a result of road
accidents by age groups.
1.5 Research questions
i. Is the rate of accidents in the different states the same?
ii. Does the number of deaths as a result of road accident differ by gender?
iii. Does the number of deaths as a result of road accident differ by age?
1.6 Scope of the research
This report focuses on road accidents caused by motor vehicles. Therefore, the population of the
report is occupants of the motor vehicles by gender and age who die as a result of road accidents.
1.7 Significance of the research
As there has been a gap in information about motor vehicle occupant death rate by gender and
age, the results of this study will come in handy in supplying this kind of information to the
relevant authority for necessary interventions. The results of this study will also add up to the
existing literature about road accidents in the states thus enriching the existing knowledge about
road accidents. This research is obviously having its weaknesses and strong points. The
weaknesses will provoke criticism hence further research by interested parties. This will also go
a long way in providing information that has been lacking when it comes to road carnage in the
states. Lastly, this research will be a source of important information to students who are
pursuing education in road safety.
Paraphrase This Document
Need a fresh take? Get an instant paraphrase of this document with our AI Paraphraser
Research report 5
1.8 Limitations
The main limitation of the study was that cases of accidents suffered under-reporting since it
depended on traffic police accuracy. They might have been overstated or understated.
2.0 Methodology
2.1 Research design
This research employed the use of survey to identify and collect accident information from the
relevant authorities in different states. This design was thought appropriate by the research since
there was need to collect data over a relatively large geographical area.
2.2 Target population
The target population was the number of deaths which due to accidents. The other population
which only served to supply the study with peripheral information was the traffic officers from
different states in the U.S. However, the research will heavily rely on secondary data.
2.3 Sample design
Traffic officers from traffic headquarters from 53 states were approached to supply the study
with relevant secondary data. They were also asked questions regarding road accident sin their
states just to be able to shed more insight on the state of rad accidents in their areas of
jurisdictions.
2.4 Data collection
This research study relied on secondary data rather than primary data. The data was sampled
from accident reports from all states and sampled by the research team.
Research report 6
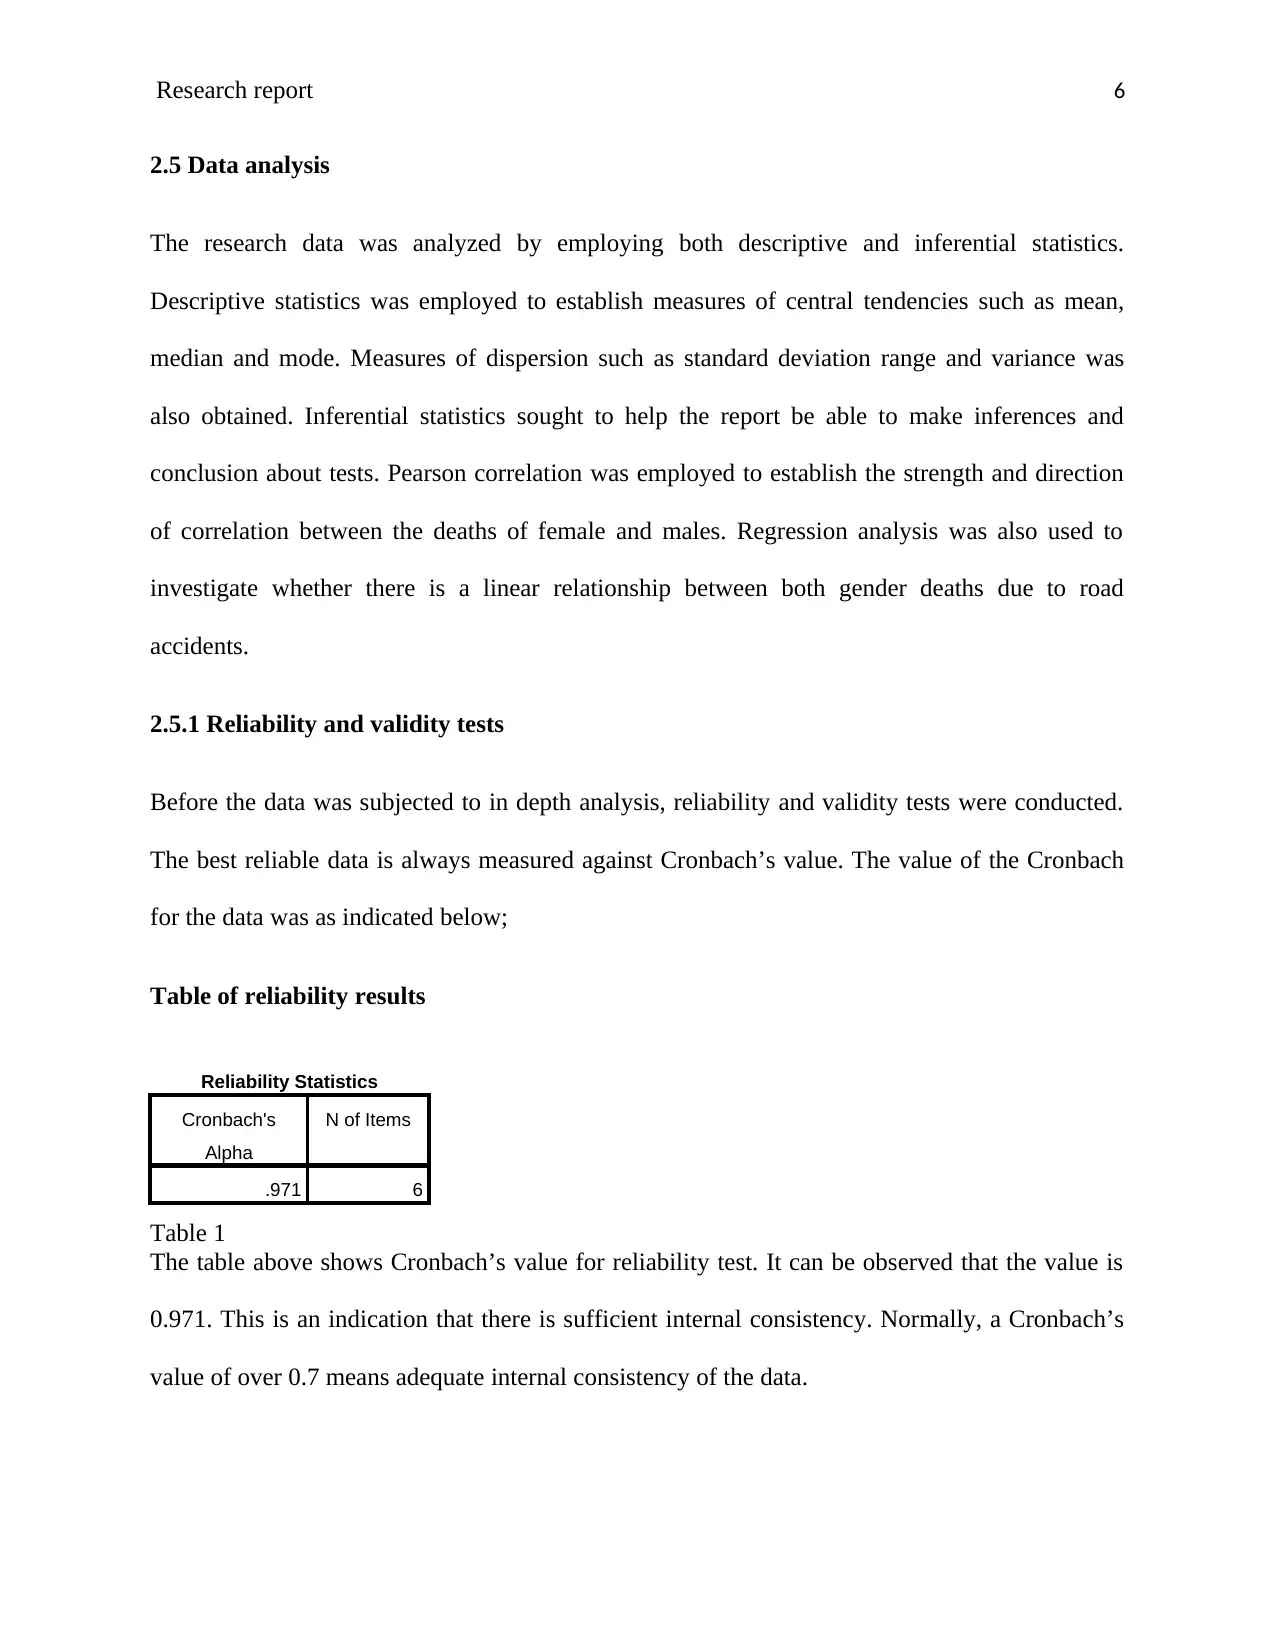
2.5 Data analysis
The research data was analyzed by employing both descriptive and inferential statistics.
Descriptive statistics was employed to establish measures of central tendencies such as mean,
median and mode. Measures of dispersion such as standard deviation range and variance was
also obtained. Inferential statistics sought to help the report be able to make inferences and
conclusion about tests. Pearson correlation was employed to establish the strength and direction
of correlation between the deaths of female and males. Regression analysis was also used to
investigate whether there is a linear relationship between both gender deaths due to road
accidents.
2.5.1 Reliability and validity tests
Before the data was subjected to in depth analysis, reliability and validity tests were conducted.
The best reliable data is always measured against Cronbach’s value. The value of the Cronbach
for the data was as indicated below;
Table of reliability results
Reliability Statistics
Cronbach's
Alpha
N of Items
.971 6
Table 1
The table above shows Cronbach’s value for reliability test. It can be observed that the value is
0.971. This is an indication that there is sufficient internal consistency. Normally, a Cronbach’s
value of over 0.7 means adequate internal consistency of the data.
⊘ This is a preview!⊘
Do you want full access?
Subscribe today to unlock all pages.
Trusted by 1+ million students worldwide
Research report 7
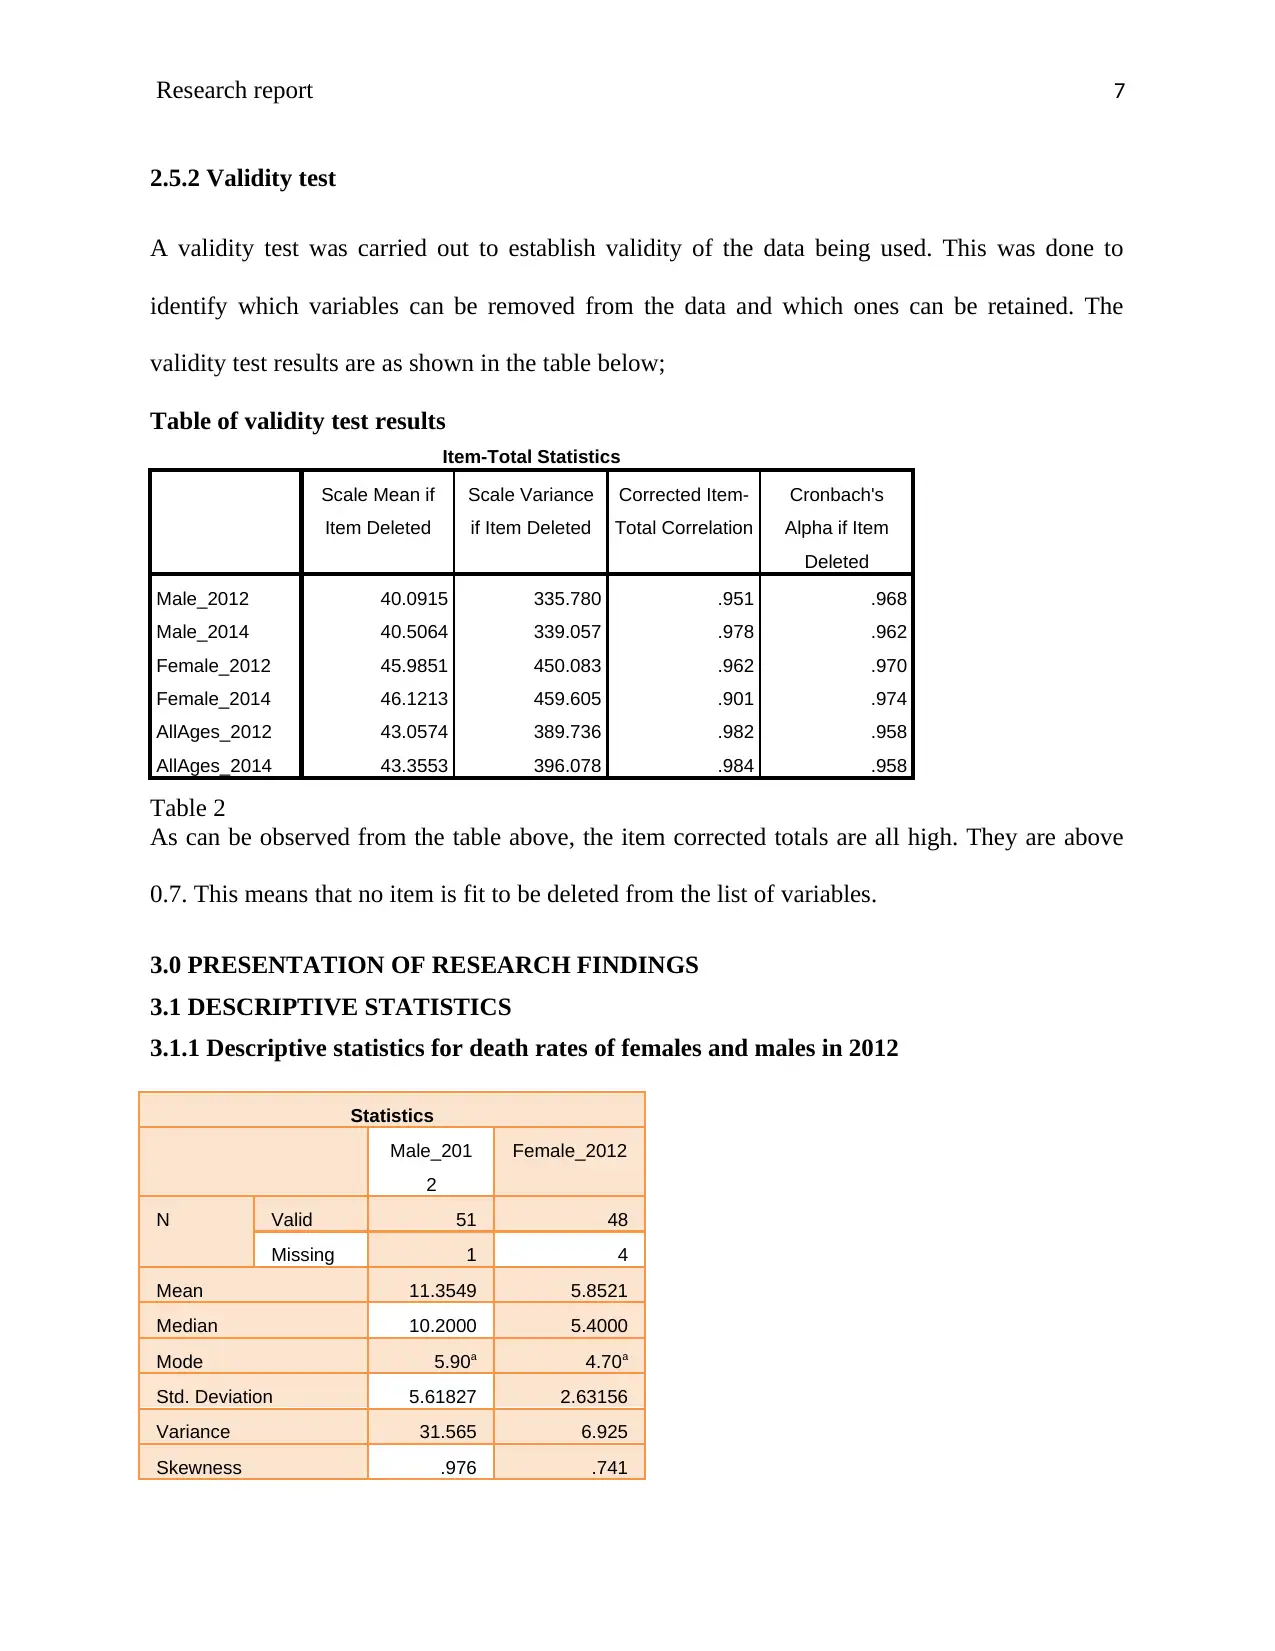
2.5.2 Validity test
A validity test was carried out to establish validity of the data being used. This was done to
identify which variables can be removed from the data and which ones can be retained. The
validity test results are as shown in the table below;
Table of validity test results
Item-Total Statistics
Scale Mean if
Item Deleted
Scale Variance
if Item Deleted
Corrected Item-
Total Correlation
Cronbach's
Alpha if Item
Deleted
Male_2012 40.0915 335.780 .951 .968
Male_2014 40.5064 339.057 .978 .962
Female_2012 45.9851 450.083 .962 .970
Female_2014 46.1213 459.605 .901 .974
AllAges_2012 43.0574 389.736 .982 .958
AllAges_2014 43.3553 396.078 .984 .958
Table 2
As can be observed from the table above, the item corrected totals are all high. They are above
0.7. This means that no item is fit to be deleted from the list of variables.
3.0 PRESENTATION OF RESEARCH FINDINGS
3.1 DESCRIPTIVE STATISTICS
3.1.1 Descriptive statistics for death rates of females and males in 2012
Statistics
Male_201
2
Female_2012
N Valid 51 48
Missing 1 4
Mean 11.3549 5.8521
Median 10.2000 5.4000
Mode 5.90a 4.70a
Std. Deviation 5.61827 2.63156
Variance 31.565 6.925
Skewness .976 .741
Paraphrase This Document
Need a fresh take? Get an instant paraphrase of this document with our AI Paraphraser
Research report 8
Std. Error of Skewness .333 .343
Kurtosis .759 .014
Std. Error of Kurtosis .656 .674
Minimum 4.10 1.70
Maximum 29.30 12.90
a. Multiple modes exist. The smallest value is shown
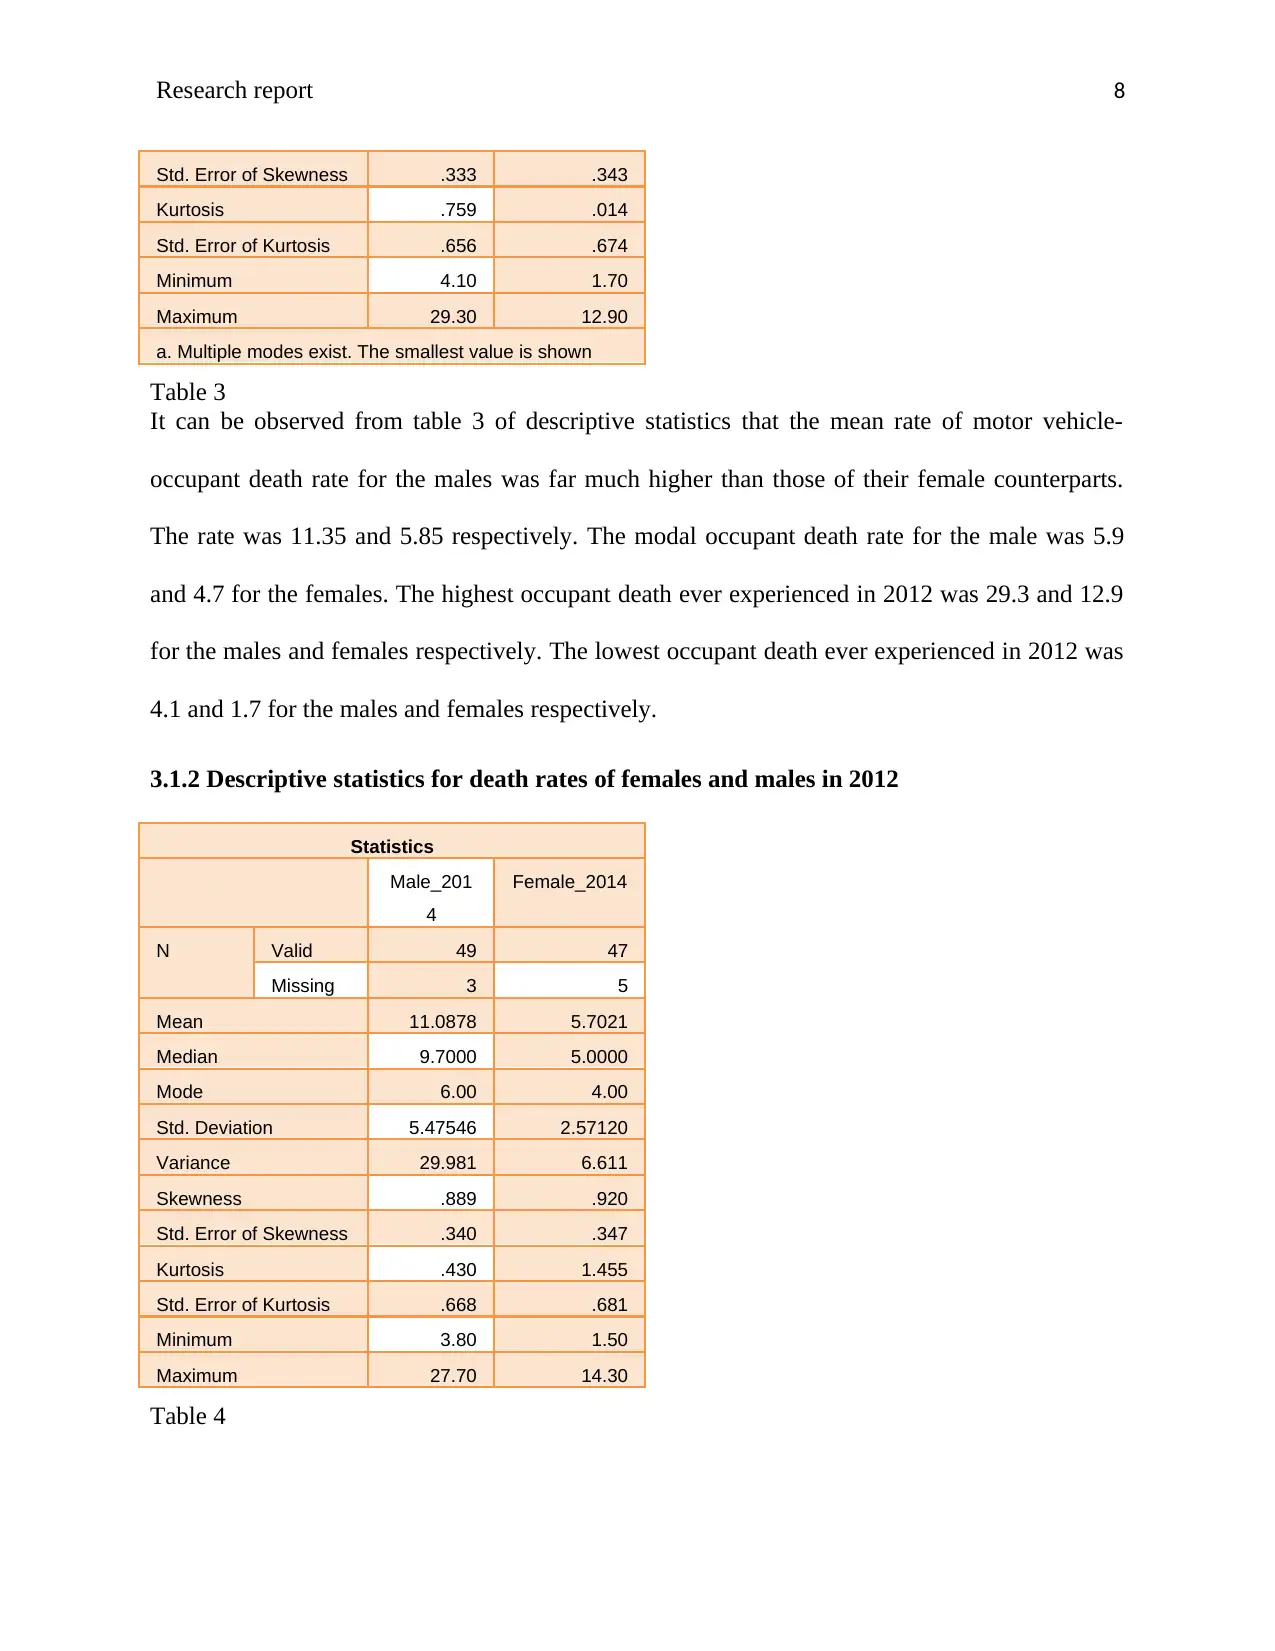
Table 3
It can be observed from table 3 of descriptive statistics that the mean rate of motor vehicle-
occupant death rate for the males was far much higher than those of their female counterparts.
The rate was 11.35 and 5.85 respectively. The modal occupant death rate for the male was 5.9
and 4.7 for the females. The highest occupant death ever experienced in 2012 was 29.3 and 12.9
for the males and females respectively. The lowest occupant death ever experienced in 2012 was
4.1 and 1.7 for the males and females respectively.
3.1.2 Descriptive statistics for death rates of females and males in 2012
Statistics
Male_201
4
Female_2014
N Valid 49 47
Missing 3 5
Mean 11.0878 5.7021
Median 9.7000 5.0000
Mode 6.00 4.00
Std. Deviation 5.47546 2.57120
Variance 29.981 6.611
Skewness .889 .920
Std. Error of Skewness .340 .347
Kurtosis .430 1.455
Std. Error of Kurtosis .668 .681
Minimum 3.80 1.50
Maximum 27.70 14.30
Table 4
Std. Error of Skewness .333 .343
Kurtosis .759 .014
Std. Error of Kurtosis .656 .674
Minimum 4.10 1.70
Maximum 29.30 12.90
a. Multiple modes exist. The smallest value is shown
Table 3
It can be observed from table 3 of descriptive statistics that the mean rate of motor vehicle-
occupant death rate for the males was far much higher than those of their female counterparts.
The rate was 11.35 and 5.85 respectively. The modal occupant death rate for the male was 5.9
and 4.7 for the females. The highest occupant death ever experienced in 2012 was 29.3 and 12.9
for the males and females respectively. The lowest occupant death ever experienced in 2012 was
4.1 and 1.7 for the males and females respectively.
3.1.2 Descriptive statistics for death rates of females and males in 2012
Statistics
Male_201
4
Female_2014
N Valid 49 47
Missing 3 5
Mean 11.0878 5.7021
Median 9.7000 5.0000
Mode 6.00 4.00
Std. Deviation 5.47546 2.57120
Variance 29.981 6.611
Skewness .889 .920
Std. Error of Skewness .340 .347
Kurtosis .430 1.455
Std. Error of Kurtosis .668 .681
Minimum 3.80 1.50
Maximum 27.70 14.30
Table 4
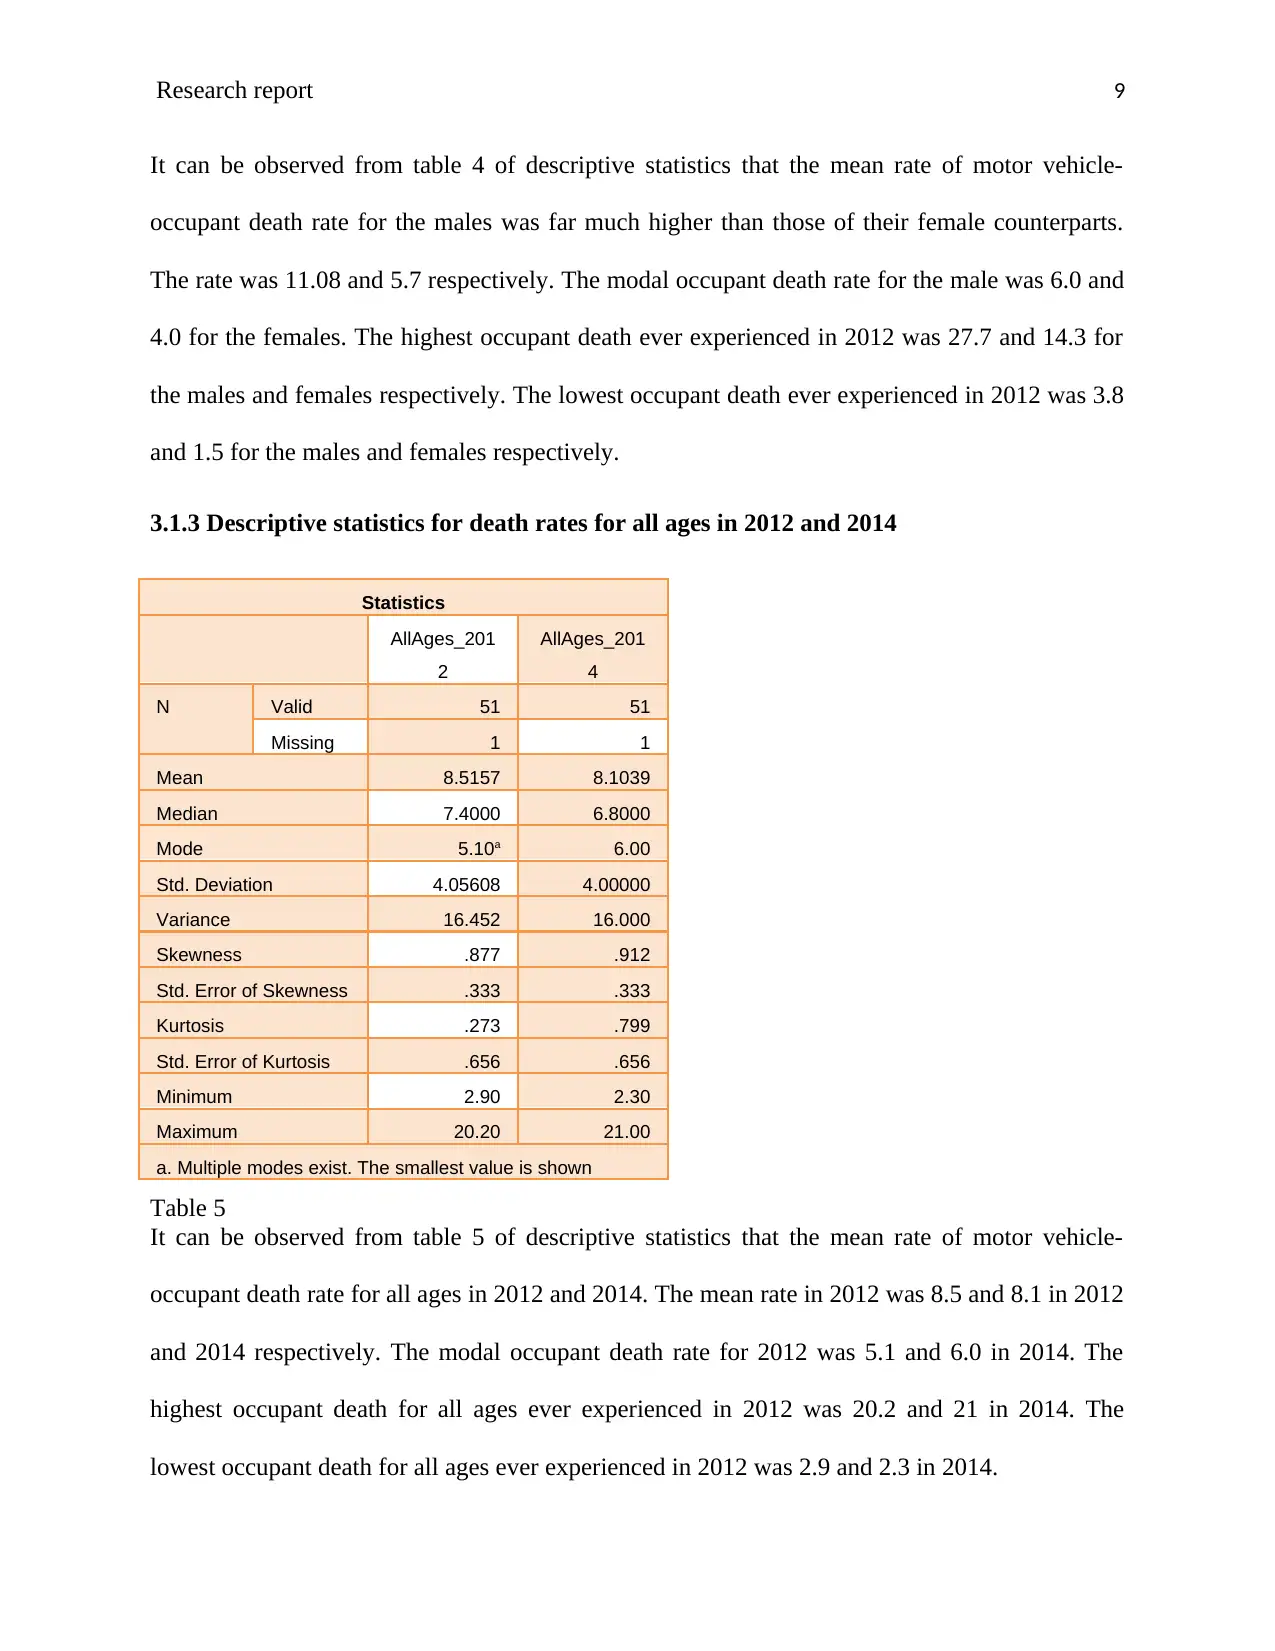
Research report 9
It can be observed from table 4 of descriptive statistics that the mean rate of motor vehicle-
occupant death rate for the males was far much higher than those of their female counterparts.
The rate was 11.08 and 5.7 respectively. The modal occupant death rate for the male was 6.0 and
4.0 for the females. The highest occupant death ever experienced in 2012 was 27.7 and 14.3 for
the males and females respectively. The lowest occupant death ever experienced in 2012 was 3.8
and 1.5 for the males and females respectively.
3.1.3 Descriptive statistics for death rates for all ages in 2012 and 2014
Statistics
AllAges_201
2
AllAges_201
4
N Valid 51 51
Missing 1 1
Mean 8.5157 8.1039
Median 7.4000 6.8000
Mode 5.10a 6.00
Std. Deviation 4.05608 4.00000
Variance 16.452 16.000
Skewness .877 .912
Std. Error of Skewness .333 .333
Kurtosis .273 .799
Std. Error of Kurtosis .656 .656
Minimum 2.90 2.30
Maximum 20.20 21.00
a. Multiple modes exist. The smallest value is shown
Table 5
It can be observed from table 5 of descriptive statistics that the mean rate of motor vehicle-
occupant death rate for all ages in 2012 and 2014. The mean rate in 2012 was 8.5 and 8.1 in 2012
and 2014 respectively. The modal occupant death rate for 2012 was 5.1 and 6.0 in 2014. The
highest occupant death for all ages ever experienced in 2012 was 20.2 and 21 in 2014. The
lowest occupant death for all ages ever experienced in 2012 was 2.9 and 2.3 in 2014.
⊘ This is a preview!⊘
Do you want full access?
Subscribe today to unlock all pages.
Trusted by 1+ million students worldwide
Research report
10
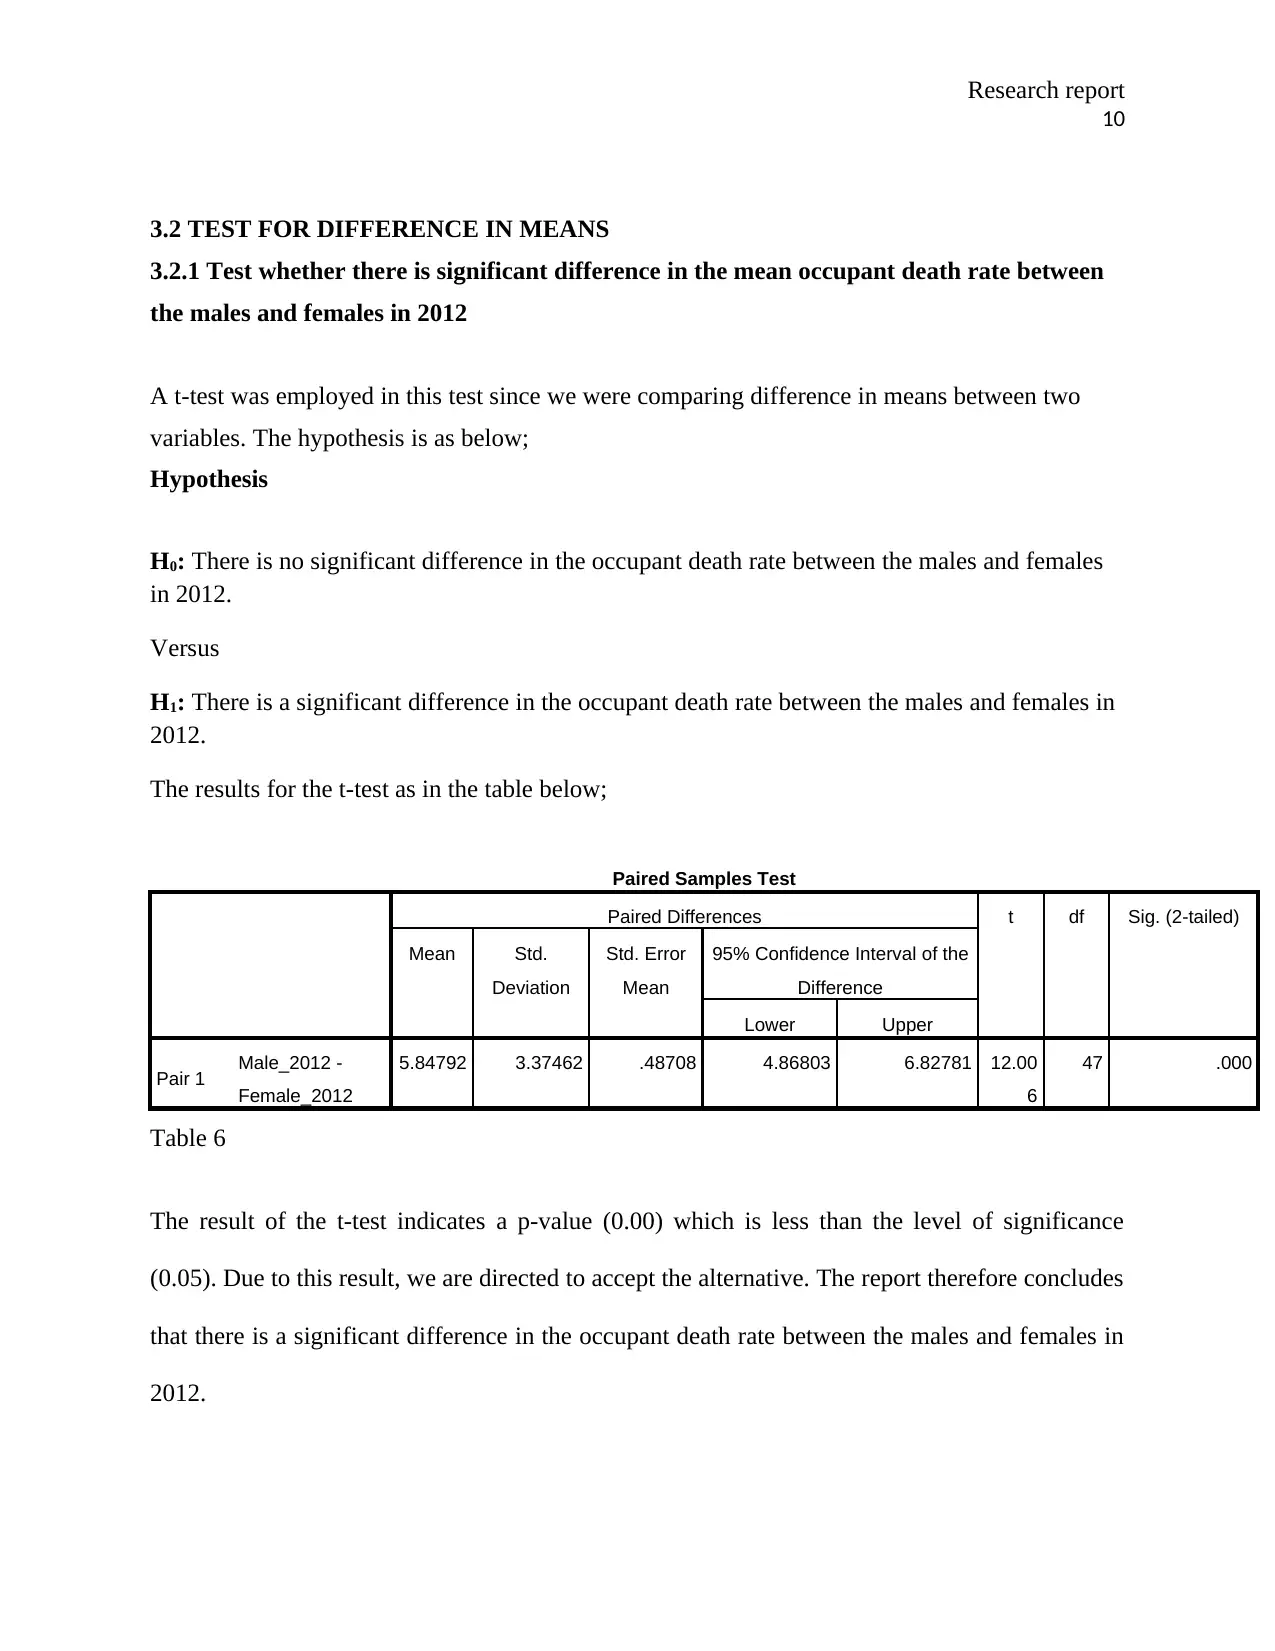
3.2 TEST FOR DIFFERENCE IN MEANS
3.2.1 Test whether there is significant difference in the mean occupant death rate between
the males and females in 2012
A t-test was employed in this test since we were comparing difference in means between two
variables. The hypothesis is as below;
Hypothesis
H0: There is no significant difference in the occupant death rate between the males and females
in 2012.
Versus
H1: There is a significant difference in the occupant death rate between the males and females in
2012.
The results for the t-test as in the table below;
Paired Samples Test
Paired Differences t df Sig. (2-tailed)
Mean Std.
Deviation
Std. Error
Mean
95% Confidence Interval of the
Difference
Lower Upper
Pair 1 Male_2012 -
Female_2012
5.84792 3.37462 .48708 4.86803 6.82781 12.00
6
47 .000
Table 6
The result of the t-test indicates a p-value (0.00) which is less than the level of significance
(0.05). Due to this result, we are directed to accept the alternative. The report therefore concludes
that there is a significant difference in the occupant death rate between the males and females in
2012.
10
3.2 TEST FOR DIFFERENCE IN MEANS
3.2.1 Test whether there is significant difference in the mean occupant death rate between
the males and females in 2012
A t-test was employed in this test since we were comparing difference in means between two
variables. The hypothesis is as below;
Hypothesis
H0: There is no significant difference in the occupant death rate between the males and females
in 2012.
Versus
H1: There is a significant difference in the occupant death rate between the males and females in
2012.
The results for the t-test as in the table below;
Paired Samples Test
Paired Differences t df Sig. (2-tailed)
Mean Std.
Deviation
Std. Error
Mean
95% Confidence Interval of the
Difference
Lower Upper
Pair 1 Male_2012 -
Female_2012
5.84792 3.37462 .48708 4.86803 6.82781 12.00
6
47 .000
Table 6
The result of the t-test indicates a p-value (0.00) which is less than the level of significance
(0.05). Due to this result, we are directed to accept the alternative. The report therefore concludes
that there is a significant difference in the occupant death rate between the males and females in
2012.
Paraphrase This Document
Need a fresh take? Get an instant paraphrase of this document with our AI Paraphraser
Research report
11
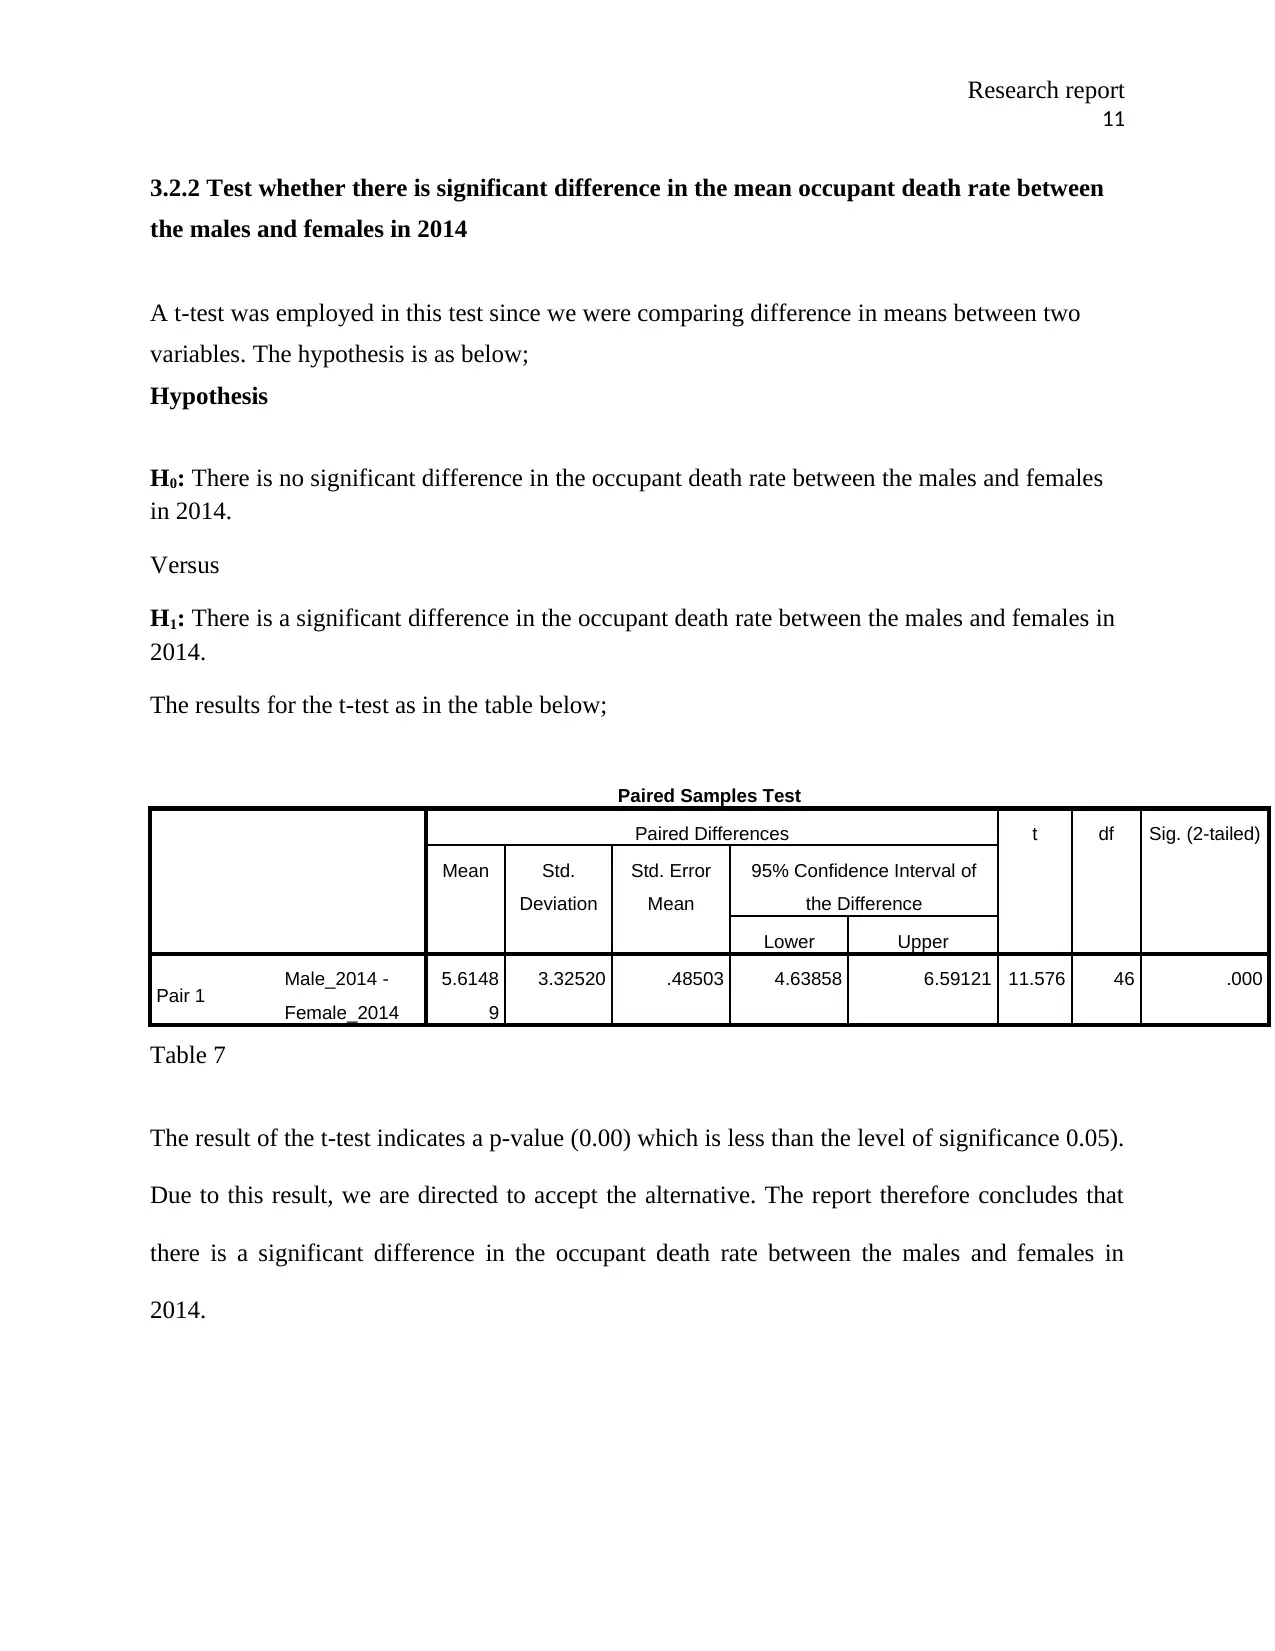
3.2.2 Test whether there is significant difference in the mean occupant death rate between
the males and females in 2014
A t-test was employed in this test since we were comparing difference in means between two
variables. The hypothesis is as below;
Hypothesis
H0: There is no significant difference in the occupant death rate between the males and females
in 2014.
Versus
H1: There is a significant difference in the occupant death rate between the males and females in
2014.
The results for the t-test as in the table below;
Paired Samples Test
Paired Differences t df Sig. (2-tailed)
Mean Std.
Deviation
Std. Error
Mean
95% Confidence Interval of
the Difference
Lower Upper
Pair 1 Male_2014 -
Female_2014
5.6148
9
3.32520 .48503 4.63858 6.59121 11.576 46 .000
Table 7
The result of the t-test indicates a p-value (0.00) which is less than the level of significance 0.05).
Due to this result, we are directed to accept the alternative. The report therefore concludes that
there is a significant difference in the occupant death rate between the males and females in
2014.
11
3.2.2 Test whether there is significant difference in the mean occupant death rate between
the males and females in 2014
A t-test was employed in this test since we were comparing difference in means between two
variables. The hypothesis is as below;
Hypothesis
H0: There is no significant difference in the occupant death rate between the males and females
in 2014.
Versus
H1: There is a significant difference in the occupant death rate between the males and females in
2014.
The results for the t-test as in the table below;
Paired Samples Test
Paired Differences t df Sig. (2-tailed)
Mean Std.
Deviation
Std. Error
Mean
95% Confidence Interval of
the Difference
Lower Upper
Pair 1 Male_2014 -
Female_2014
5.6148
9
3.32520 .48503 4.63858 6.59121 11.576 46 .000
Table 7
The result of the t-test indicates a p-value (0.00) which is less than the level of significance 0.05).
Due to this result, we are directed to accept the alternative. The report therefore concludes that
there is a significant difference in the occupant death rate between the males and females in
2014.
Research report
12
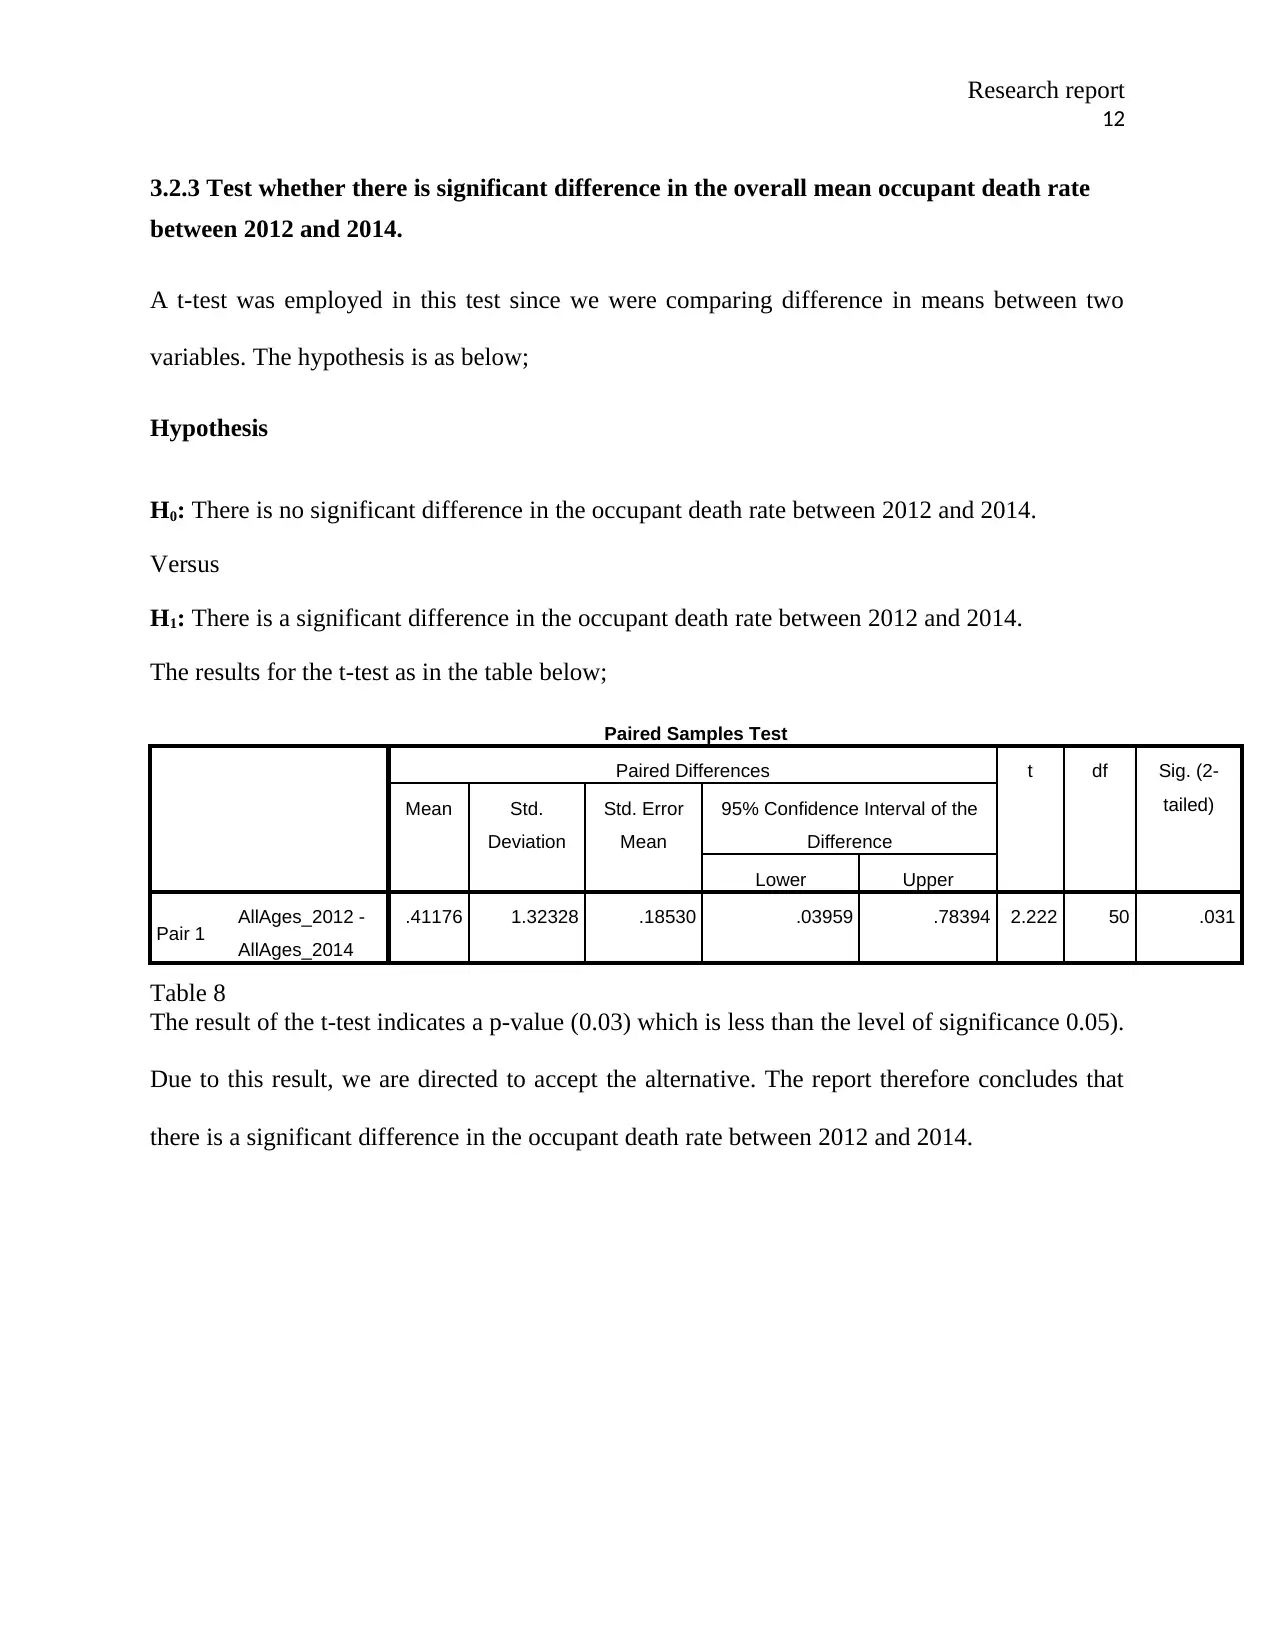
3.2.3 Test whether there is significant difference in the overall mean occupant death rate
between 2012 and 2014.
A t-test was employed in this test since we were comparing difference in means between two
variables. The hypothesis is as below;
Hypothesis
H0: There is no significant difference in the occupant death rate between 2012 and 2014.
Versus
H1: There is a significant difference in the occupant death rate between 2012 and 2014.
The results for the t-test as in the table below;
Paired Samples Test
Paired Differences t df Sig. (2-
tailed)Mean Std.
Deviation
Std. Error
Mean
95% Confidence Interval of the
Difference
Lower Upper
Pair 1 AllAges_2012 -
AllAges_2014
.41176 1.32328 .18530 .03959 .78394 2.222 50 .031
Table 8
The result of the t-test indicates a p-value (0.03) which is less than the level of significance 0.05).
Due to this result, we are directed to accept the alternative. The report therefore concludes that
there is a significant difference in the occupant death rate between 2012 and 2014.
12
3.2.3 Test whether there is significant difference in the overall mean occupant death rate
between 2012 and 2014.
A t-test was employed in this test since we were comparing difference in means between two
variables. The hypothesis is as below;
Hypothesis
H0: There is no significant difference in the occupant death rate between 2012 and 2014.
Versus
H1: There is a significant difference in the occupant death rate between 2012 and 2014.
The results for the t-test as in the table below;
Paired Samples Test
Paired Differences t df Sig. (2-
tailed)Mean Std.
Deviation
Std. Error
Mean
95% Confidence Interval of the
Difference
Lower Upper
Pair 1 AllAges_2012 -
AllAges_2014
.41176 1.32328 .18530 .03959 .78394 2.222 50 .031
Table 8
The result of the t-test indicates a p-value (0.03) which is less than the level of significance 0.05).
Due to this result, we are directed to accept the alternative. The report therefore concludes that
there is a significant difference in the occupant death rate between 2012 and 2014.
⊘ This is a preview!⊘
Do you want full access?
Subscribe today to unlock all pages.
Trusted by 1+ million students worldwide
1 out of 19
Related Documents


Your All-in-One AI-Powered Toolkit for Academic Success.
+13062052269
info@desklib.com
Available 24*7 on WhatsApp / Email
![[object Object]](/_next/static/media/star-bottom.7253800d.svg)
Unlock your academic potential
Copyright © 2020–2026 A2Z Services. All Rights Reserved. Developed and managed by ZUCOL.