Big Data Analytics Report: Road Safety Dataset Analysis, IMAT5322
VerifiedAdded on 2022/08/16
|14
|3249
|14
Report
AI Summary
This report presents a big data analytics project focused on analyzing a road safety dataset from the UK government's data.gov.uk website. The analysis utilizes PySpark to process and analyze three datasets: accident information, casualty information, and vehicle information, all from 2018. The report details the data preprocessing steps, data definitions, and the application of various data analytics techniques, including SQL queries and data visualizations such as bar charts, line charts, and swarm plots, to identify patterns and correlations within the data. The key findings include insights into accident severity, the types of vehicles involved in accidents, the age groups most affected, and the peak hours for fatal accidents. The report concludes with a discussion of the findings and their implications for road safety, as well as potential areas for future research.
Running head: BIG DATA ANALYTICS
Big Data Analytics
Student Name:
Student ID:
University Name:
Paper Code:
Big Data Analytics
Student Name:
Student ID:
University Name:
Paper Code:
Paraphrase This Document
Need a fresh take? Get an instant paraphrase of this document with our AI Paraphraser
2BIG DATA ANALYTICS
Executive Summary
One of the latest technology in demand big data, generally using such technology large dataset
are being analyzed to discover hidden patterns in the dataset also the correlation of the attributes
are been analyzed and also to find depth insights of the dataset. Now with the evolving
technology it has now become possible to analyze the dataset properly and get the required
answer immediately and in no time. In the analysis the dataset used is the road safety dataset
which was actually taken and also can be downloadable from data.gov.uk official website. Road
safety is a very important topic around the world, and in the United Kingdom it's no different.
Each year thousands of accidents are reported to the police and details such as accident severity,
location, date, weather, road conditions, and number of causalities are recorded. There are three
datasets to be analyzed: Accident information from 2018, casualty information from 2018, and
Vehicle information from 2018. The assignment contains in depth analysis of the dataset with
appropriate visualization techniques to understand the data properly. At the end few conclusion
will be concluded regarding the analysis performed over the dataset.

3BIG DATA ANALYTICS
Table of Contents
Executive Summary.........................................................................................................................2
Introduction......................................................................................................................................4
Discussion........................................................................................................................................4
Introduction of data..................................................................................................................4
Preprocessing of data...............................................................................................................5
Data Definition........................................................................................................................5
Data Analytics.........................................................................................................................7
Conclusion.....................................................................................................................................12
Reference.......................................................................................................................................13
⊘ This is a preview!⊘
Do you want full access?
Subscribe today to unlock all pages.
Trusted by 1+ million students worldwide
4BIG DATA ANALYTICS
Introduction
With the recent evolution of technology, large dataset are being analyzed to discover
hidden patterns in the dataset also the correlation of the attributes are been analyzed and also to
find depth insights of the dataset (Armbrust et al., 2015). Now with the evolving technology it
has now become possible to analyze the dataset properly and get the required answer
immediately and in no time. Big data analytics helps many organization to understand the data in
much better and informatics way and to identify the essential and crucial information which are
important to the business and future business decisions (Karau et al., 2015).
Python and spark is been considered as the buzz word nowadays. Spark is been used
nowadays in the analytics industries for processing and getting knowledge of large dataset
(Zaharia et al., 2016). Spark is considered to be an open source framework which is responsible
for smoothly pre-processing with high speed and it does support various languages like python,
java and R programming (Zhu et al., 2018). Python is a great programming language which is
widely used for analysis and prediction purposes.
Pyspark is considered to be one of the best language to perform different exploratory data
analysis and also for building machine learning pipeline which is also one of the major part done
using pyspark using huge volumes of data (Guller, 2015). In PySpark the major datatype used is
the Spark data frame (Aubin, Saunier and Miranda-Moreno, 2015). Also another way is to use
inbuilt Pandas library which will automatically convert into dataframe using toPandas() in the
Spark dataframe which will eventually a pandas object (Karau et al., 2015). Also it should be
kept in mind these function should not be used frequently for small data frames as it will
eventually pulls the entire into the memory space which is available on a single node.
Discussion
Introduction of data
In the analysis the dataset used is the road safety dataset which was actually taken and
downloaded from data.gov.uk website. Road safety is a very important topic around the world,
and in the United Kingdom it's no different. Each year thousands of accidents are reported to the
police and details such as accident severity, location, date, weather, road conditions, and number
of causalities are recorded. There are three datasets to be analyzed: Accident information from
2018, casualty information from 2018, and Vehicle information from 2018. The dataset are in the
Paraphrase This Document
Need a fresh take? Get an instant paraphrase of this document with our AI Paraphraser
5BIG DATA ANALYTICS
form of csv file which are placed inside the zip files. The main objective is to make roads safer
for everyone by digging into common denominators and using visualization to make sense of the
data.
Preprocessing of data
All the three dataset has been downloaded from the official website of the UK govt.
dataset. At first the datasets are inside the zip file which needs to be unzip using extractall
function which is there in the python program.
The department of transportation made this dataset which covers the information of the
accidents which took place in the first and second quarters of the year 2018 in the Great Britain
which is now available on the official website (Shoro and Soomro, 2015). The dataset used was
first released as UN-validate subset which was not taken into consideration, later on after one the
full validation data has been released afterward (Zaharia et al., 2016).
Data Definition
The accident dataset contains the following attributes with its appropriate data type which
is the main dataset out of the three-
1. Accident Index: Index of each accident (STRING)
2. Location Easting OSGR: Gives us the exact location of the place (INTEGER)
3. Location Northing OSGR: Gives us the exact location of the place (INTEGER)
4. Longitude: Longitude of the place (INTEGER)
5. Latitude: Latitude of the place (INTEGER)
6. Police Force: Number of police available at that time (INTEGER)
7. Accident Severity: Severity of the accident (INTEGER)
8. Number of Vehicles: Number of involved in the accident (INTEGER)
9. Number of Casualties: Number of people died or injured (INTEGER)
10. Date: The date of travel (INTEGER)
11. Day of Week: Day of the week (INTEGER)
6BIG DATA ANALYTICS
12. Time: Time of the accident (STRING)
13. Local Authority (District): local district number (INTEGER)
14. Local Authority (Highway): local Highway number (STRING)
15. 1st Road Class: Hierarchy which the road falls in (INTEGER)
16. 1st Road Number: Road number (STRING)
17. Speed limit: Speed limit in the road (INTEGER)
18. Junction Detail: Each number in this column various junction types (INTEGER)
19. Junction Control: Kind of control (INTEGER)
20. 2nd Road Class: Hierarchy which the road falls in (INTEGER)
21. 2nd Road Number: Road number (STRING)
22. Pedestrian Crossing Human Control: Human Control for Pedestrian Crossing (INTEGER)
23. Pedestrian Crossing Physical Facilities: Physical Facilities for Pedestrian Crossing
(INTEGER)
24. Light Conditions: Daytime or Nighttime (INTEGER)
25. Weather Conditions: Weather Conditions when the accident happened (INTEGER)
26. Road Surface Conditions: Road Surface Conditions where the accident occurred (INTEGER)
27. Special Conditions at Site: Other Conditions prevailing at the accident spot (INTEGER)
28. Carriageway Hazards: Carriageway Hazards in the past (STRING)
29. Urban or Rural Area: Is it an Urban or rural area (INTEGER)
30. Did Police Officer Attend Scene of Accident: Did Police Officer Attend Scene of Accident
(INTEGER)
31. LSOA of Accident Location: Accident location (STRING)
Below are the essential attributes required for the analysis in the causalities dataset which
consist of only integer data types. Only numerical data are there.
⊘ This is a preview!⊘
Do you want full access?
Subscribe today to unlock all pages.
Trusted by 1+ million students worldwide
7BIG DATA ANALYTICS
Accident_Index ,Vehicle_Reference ,Casualty_Reference ,Casualty_Class ,Sex_of_Casualty ,Ag
e_of_Casualty ,Age_Band_of_Casualty ,Casualty_Severity ,Pedestrian_Location ,Pedestrian_Mo
vement ,Car_Passenger ,Bus_or_Coach_Passenger ,Pedestrian_Road_Maintenance_Worker ,Cas
ualty_Type ,Casualty_Home_Area_Type ,Casualty_IMD_Decile
And the dataset for vehicle consist of the below attributes which consist of only integer
data type, here also the dataset has only integer values of data. The essential attributes are listed
below-
Accident_Index ,Vehicle_Reference ,Vehicle_Type ,Towing_and_Articulation ,Vehicle_Manoeu
vre ,Vehicle_Location_Restricted_Lane ,Junction_Location ,Skidding_and_Overturning ,Hit_Ob
ject_in_Carriageway ,Vehicle_Leaving_Carriageway ,Hit_Object_off_Carriageway ,1st_Point_o
f_Impact ,Was_Vehicle_Left_Hand_Drive? ,Journey_Purpose_of_Driver ,Sex_of_Driver ,Age_o
f_Driver ,Age_Band_of_Driver ,Engine_Capacity_(CC) ,Propulsion_Code ,Age_of_Vehicle ,Dri
ver_IMD_Decile ,Driver_Home_Area_Type ,Vehicle_IMD_Decile
Data Analytics
Figure 1: Bar chart
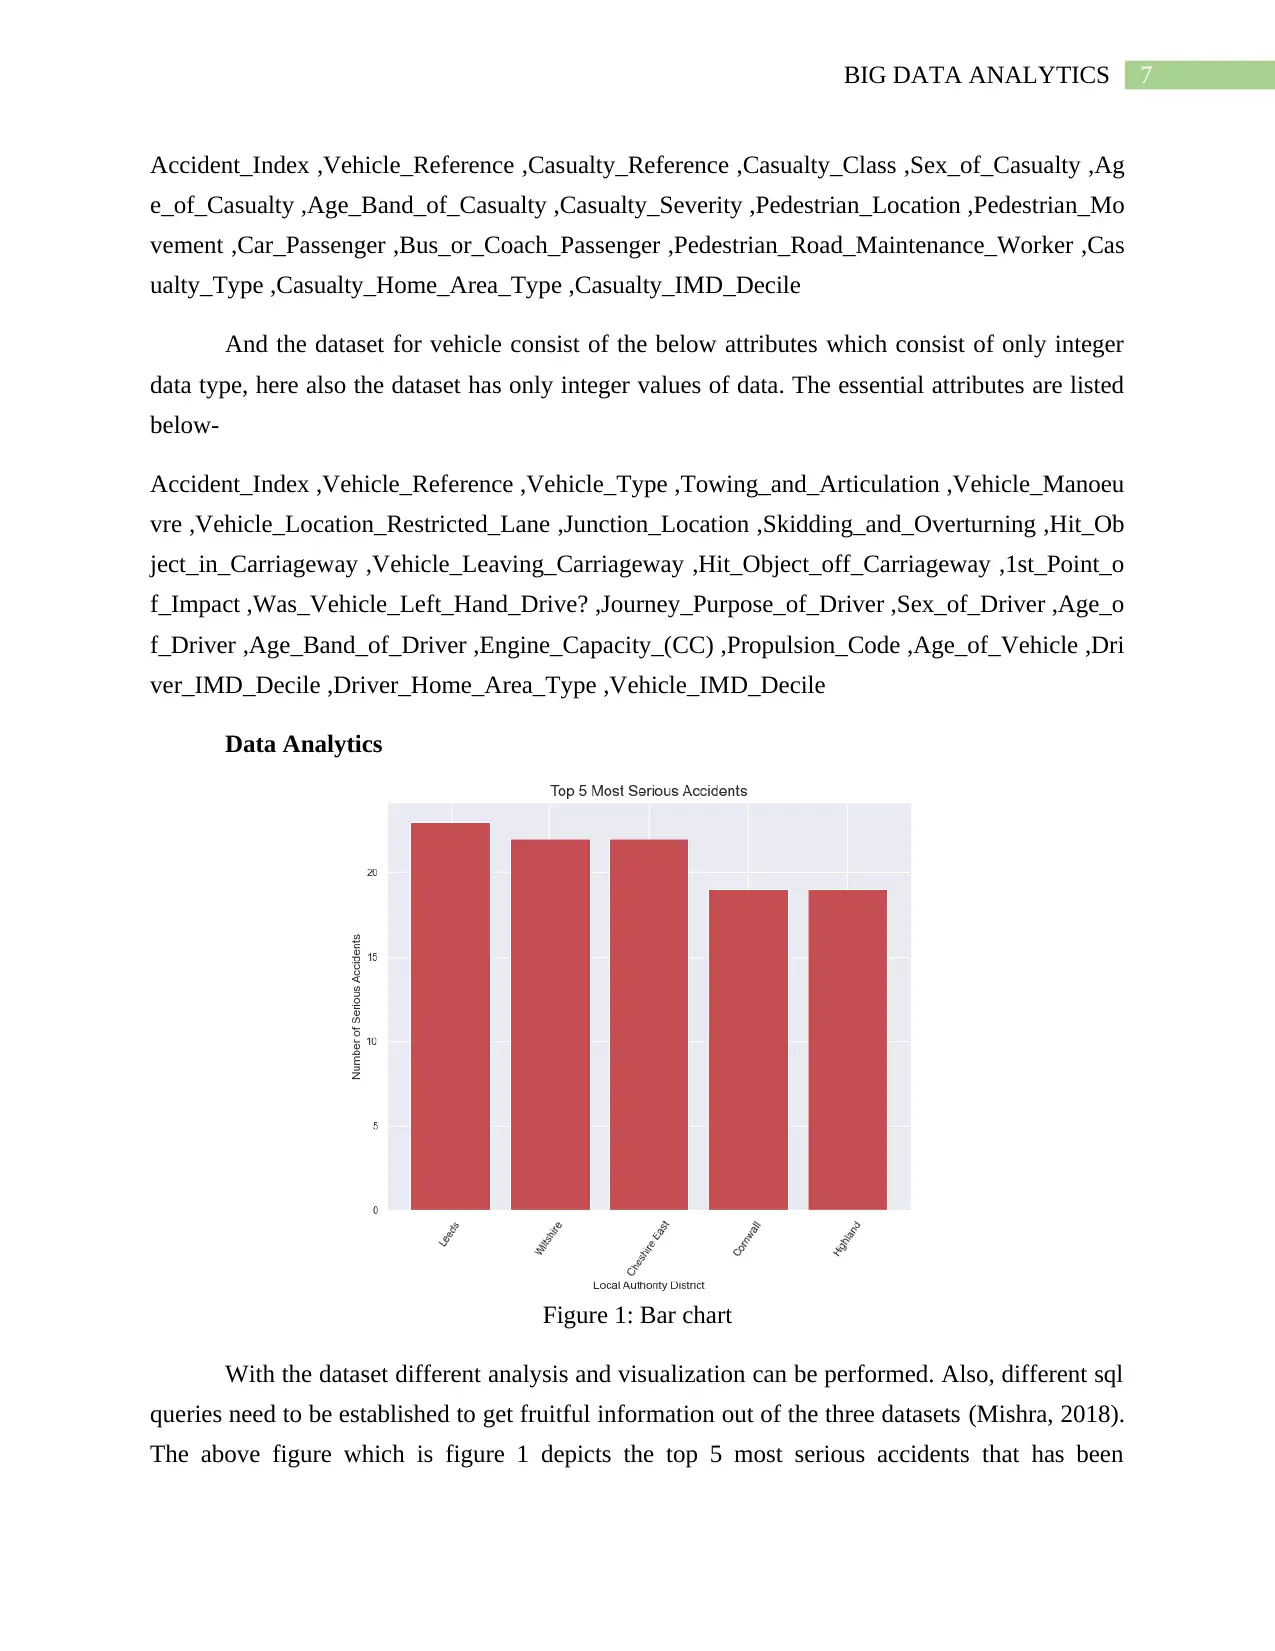
With the dataset different analysis and visualization can be performed. Also, different sql
queries need to be established to get fruitful information out of the three datasets (Mishra, 2018).
The above figure which is figure 1 depicts the top 5 most serious accidents that has been
Accident_Index ,Vehicle_Reference ,Casualty_Reference ,Casualty_Class ,Sex_of_Casualty ,Ag
e_of_Casualty ,Age_Band_of_Casualty ,Casualty_Severity ,Pedestrian_Location ,Pedestrian_Mo
vement ,Car_Passenger ,Bus_or_Coach_Passenger ,Pedestrian_Road_Maintenance_Worker ,Cas
ualty_Type ,Casualty_Home_Area_Type ,Casualty_IMD_Decile
And the dataset for vehicle consist of the below attributes which consist of only integer
data type, here also the dataset has only integer values of data. The essential attributes are listed
below-
Accident_Index ,Vehicle_Reference ,Vehicle_Type ,Towing_and_Articulation ,Vehicle_Manoeu
vre ,Vehicle_Location_Restricted_Lane ,Junction_Location ,Skidding_and_Overturning ,Hit_Ob
ject_in_Carriageway ,Vehicle_Leaving_Carriageway ,Hit_Object_off_Carriageway ,1st_Point_o
f_Impact ,Was_Vehicle_Left_Hand_Drive? ,Journey_Purpose_of_Driver ,Sex_of_Driver ,Age_o
f_Driver ,Age_Band_of_Driver ,Engine_Capacity_(CC) ,Propulsion_Code ,Age_of_Vehicle ,Dri
ver_IMD_Decile ,Driver_Home_Area_Type ,Vehicle_IMD_Decile
Data Analytics
Figure 1: Bar chart
With the dataset different analysis and visualization can be performed. Also, different sql
queries need to be established to get fruitful information out of the three datasets (Mishra, 2018).
The above figure which is figure 1 depicts the top 5 most serious accidents that has been
Paraphrase This Document
Need a fresh take? Get an instant paraphrase of this document with our AI Paraphraser
8BIG DATA ANALYTICS
occurred in the country. Figure 1 will help to identify which authorities have the most fatal
accidents. According to the figure the highest is the Leeds followed by Wiltshire then Cheshire
east then Cornwall and at the end the highland Top 5 authorities were shown in this
visualization.
To visualize this accident dataset with the dictionary dataset has been joined as left outer
joined to count the maximum number of fatal occurred for each local authority districts
(Penchikala, 2018). The y axis shows the total number of serious accidents occurred and the y
axis show from which local authority the accident took place.
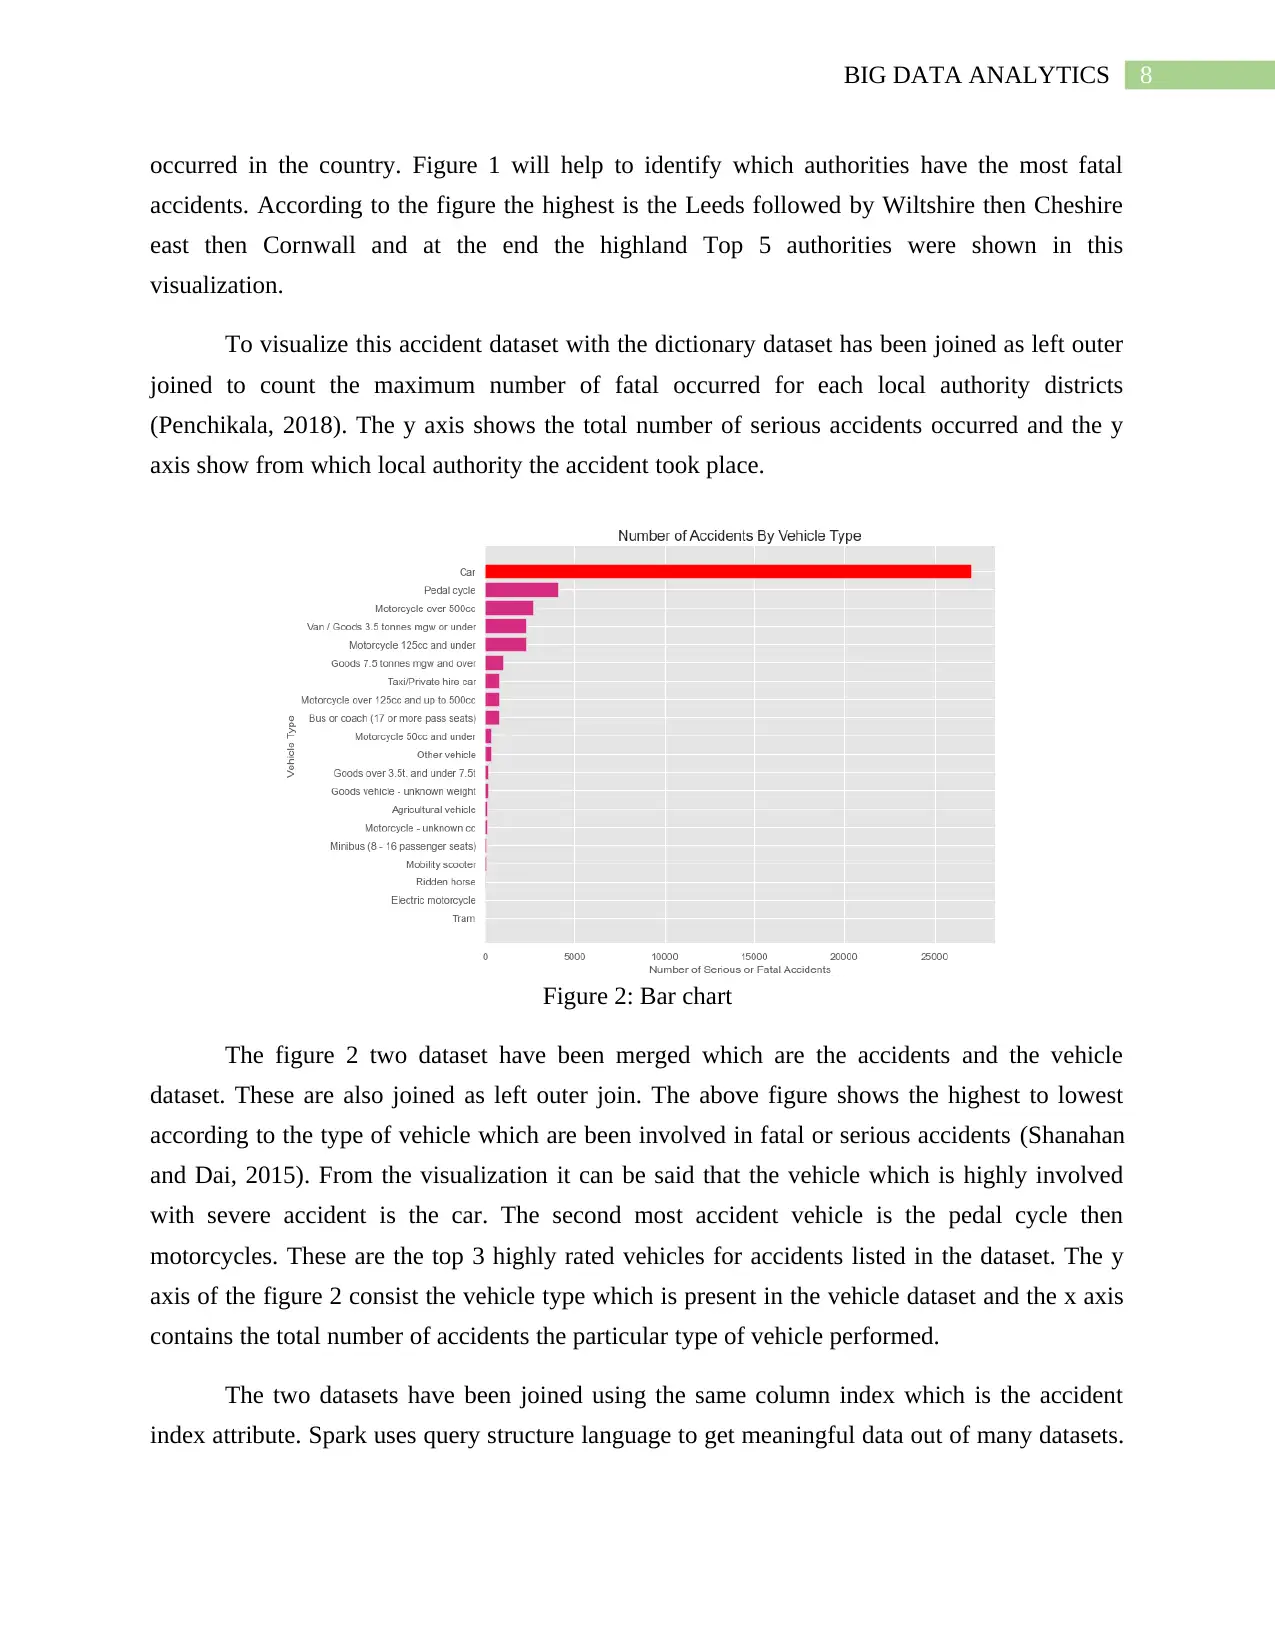
Figure 2: Bar chart
The figure 2 two dataset have been merged which are the accidents and the vehicle
dataset. These are also joined as left outer join. The above figure shows the highest to lowest
according to the type of vehicle which are been involved in fatal or serious accidents (Shanahan
and Dai, 2015). From the visualization it can be said that the vehicle which is highly involved
with severe accident is the car. The second most accident vehicle is the pedal cycle then
motorcycles. These are the top 3 highly rated vehicles for accidents listed in the dataset. The y
axis of the figure 2 consist the vehicle type which is present in the vehicle dataset and the x axis
contains the total number of accidents the particular type of vehicle performed.
The two datasets have been joined using the same column index which is the accident
index attribute. Spark uses query structure language to get meaningful data out of many datasets.
occurred in the country. Figure 1 will help to identify which authorities have the most fatal
accidents. According to the figure the highest is the Leeds followed by Wiltshire then Cheshire
east then Cornwall and at the end the highland Top 5 authorities were shown in this
visualization.
To visualize this accident dataset with the dictionary dataset has been joined as left outer
joined to count the maximum number of fatal occurred for each local authority districts
(Penchikala, 2018). The y axis shows the total number of serious accidents occurred and the y
axis show from which local authority the accident took place.
Figure 2: Bar chart
The figure 2 two dataset have been merged which are the accidents and the vehicle
dataset. These are also joined as left outer join. The above figure shows the highest to lowest
according to the type of vehicle which are been involved in fatal or serious accidents (Shanahan
and Dai, 2015). From the visualization it can be said that the vehicle which is highly involved
with severe accident is the car. The second most accident vehicle is the pedal cycle then
motorcycles. These are the top 3 highly rated vehicles for accidents listed in the dataset. The y
axis of the figure 2 consist the vehicle type which is present in the vehicle dataset and the x axis
contains the total number of accidents the particular type of vehicle performed.
The two datasets have been joined using the same column index which is the accident
index attribute. Spark uses query structure language to get meaningful data out of many datasets.
9BIG DATA ANALYTICS
Also, the grouping has been done based on the vehicle type. The data with Accident Severity as
1 and Accident Severity as 2 were considered as the most severe and the fatal ones.
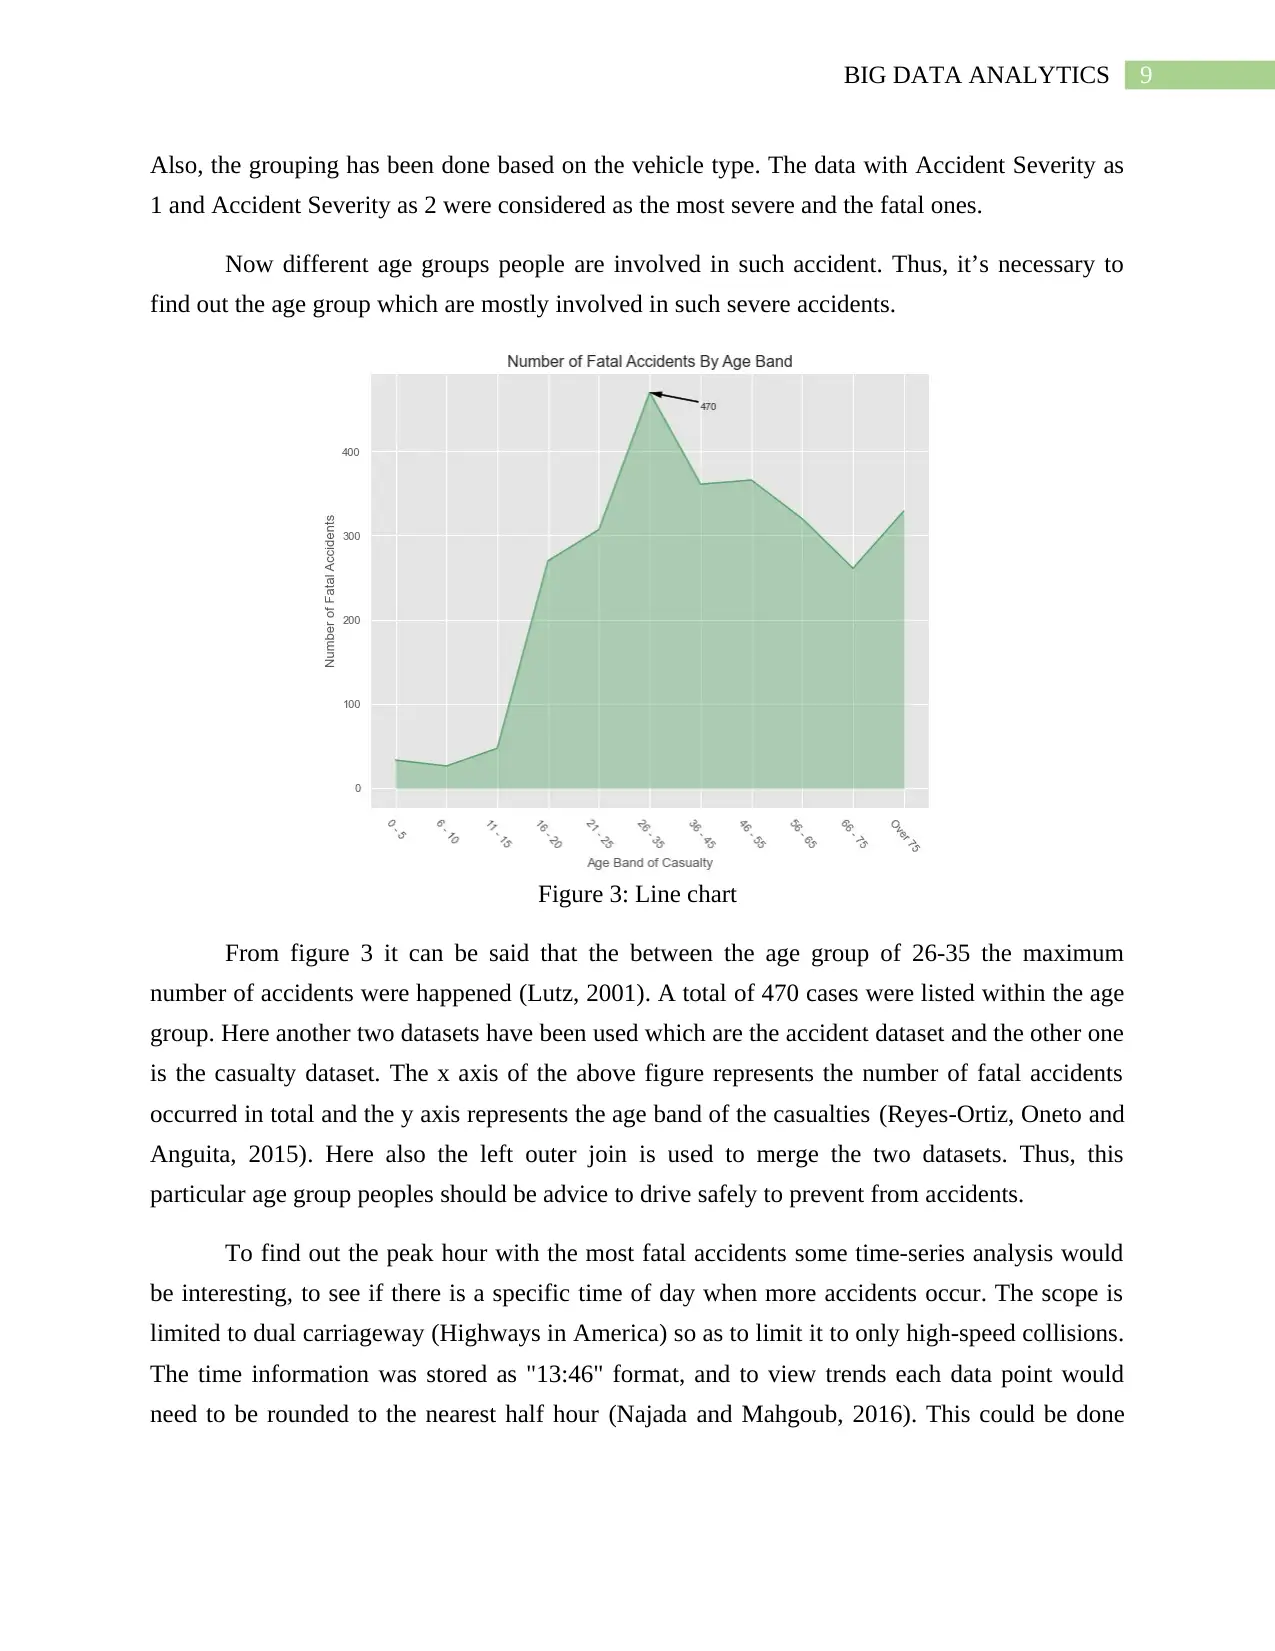
Now different age groups people are involved in such accident. Thus, it’s necessary to
find out the age group which are mostly involved in such severe accidents.
Figure 3: Line chart
From figure 3 it can be said that the between the age group of 26-35 the maximum
number of accidents were happened (Lutz, 2001). A total of 470 cases were listed within the age
group. Here another two datasets have been used which are the accident dataset and the other one
is the casualty dataset. The x axis of the above figure represents the number of fatal accidents
occurred in total and the y axis represents the age band of the casualties (Reyes-Ortiz, Oneto and
Anguita, 2015). Here also the left outer join is used to merge the two datasets. Thus, this
particular age group peoples should be advice to drive safely to prevent from accidents.
To find out the peak hour with the most fatal accidents some time-series analysis would
be interesting, to see if there is a specific time of day when more accidents occur. The scope is
limited to dual carriageway (Highways in America) so as to limit it to only high-speed collisions.
The time information was stored as "13:46" format, and to view trends each data point would
need to be rounded to the nearest half hour (Najada and Mahgoub, 2016). This could be done
Also, the grouping has been done based on the vehicle type. The data with Accident Severity as
1 and Accident Severity as 2 were considered as the most severe and the fatal ones.
Now different age groups people are involved in such accident. Thus, it’s necessary to
find out the age group which are mostly involved in such severe accidents.
Figure 3: Line chart
From figure 3 it can be said that the between the age group of 26-35 the maximum
number of accidents were happened (Lutz, 2001). A total of 470 cases were listed within the age
group. Here another two datasets have been used which are the accident dataset and the other one
is the casualty dataset. The x axis of the above figure represents the number of fatal accidents
occurred in total and the y axis represents the age band of the casualties (Reyes-Ortiz, Oneto and
Anguita, 2015). Here also the left outer join is used to merge the two datasets. Thus, this
particular age group peoples should be advice to drive safely to prevent from accidents.
To find out the peak hour with the most fatal accidents some time-series analysis would
be interesting, to see if there is a specific time of day when more accidents occur. The scope is
limited to dual carriageway (Highways in America) so as to limit it to only high-speed collisions.
The time information was stored as "13:46" format, and to view trends each data point would
need to be rounded to the nearest half hour (Najada and Mahgoub, 2016). This could be done
⊘ This is a preview!⊘
Do you want full access?
Subscribe today to unlock all pages.
Trusted by 1+ million students worldwide
10BIG DATA ANALYTICS
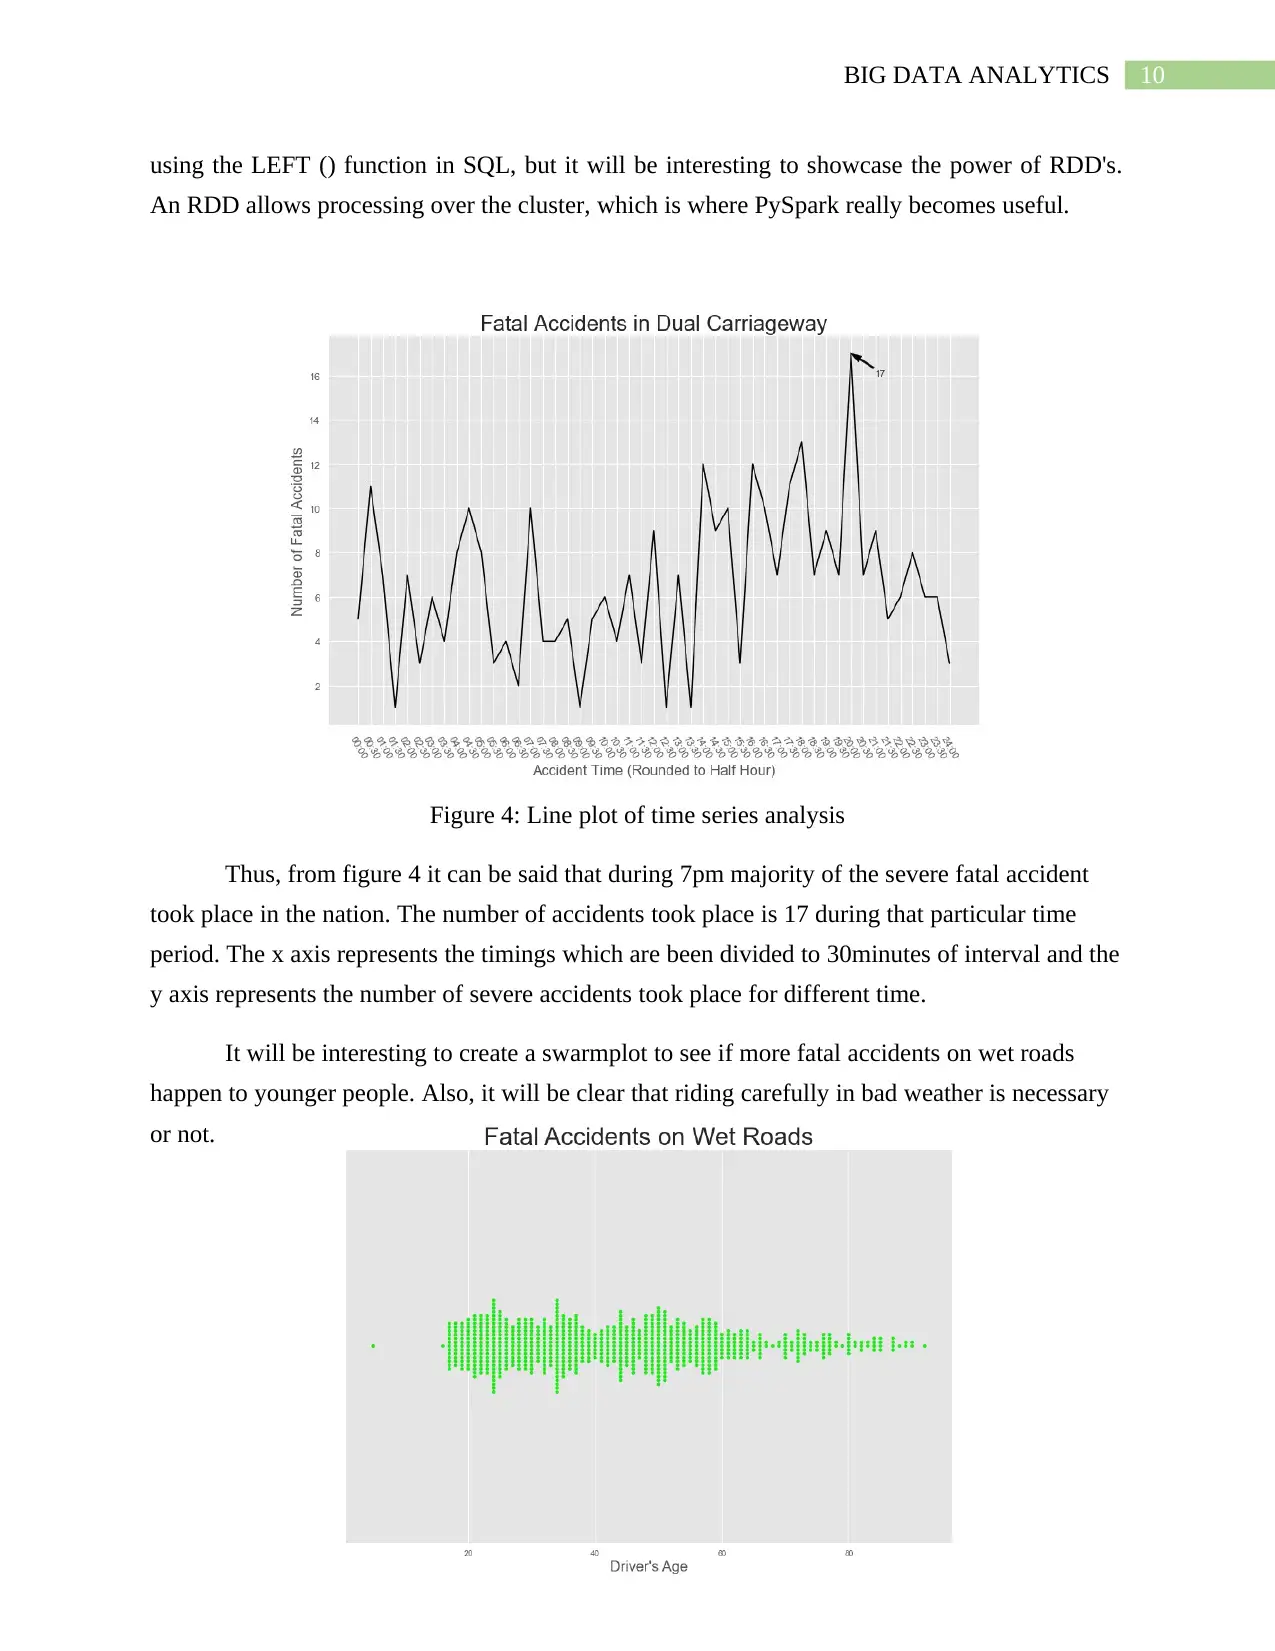
using the LEFT () function in SQL, but it will be interesting to showcase the power of RDD's.
An RDD allows processing over the cluster, which is where PySpark really becomes useful.
Figure 4: Line plot of time series analysis
Thus, from figure 4 it can be said that during 7pm majority of the severe fatal accident
took place in the nation. The number of accidents took place is 17 during that particular time
period. The x axis represents the timings which are been divided to 30minutes of interval and the
y axis represents the number of severe accidents took place for different time.
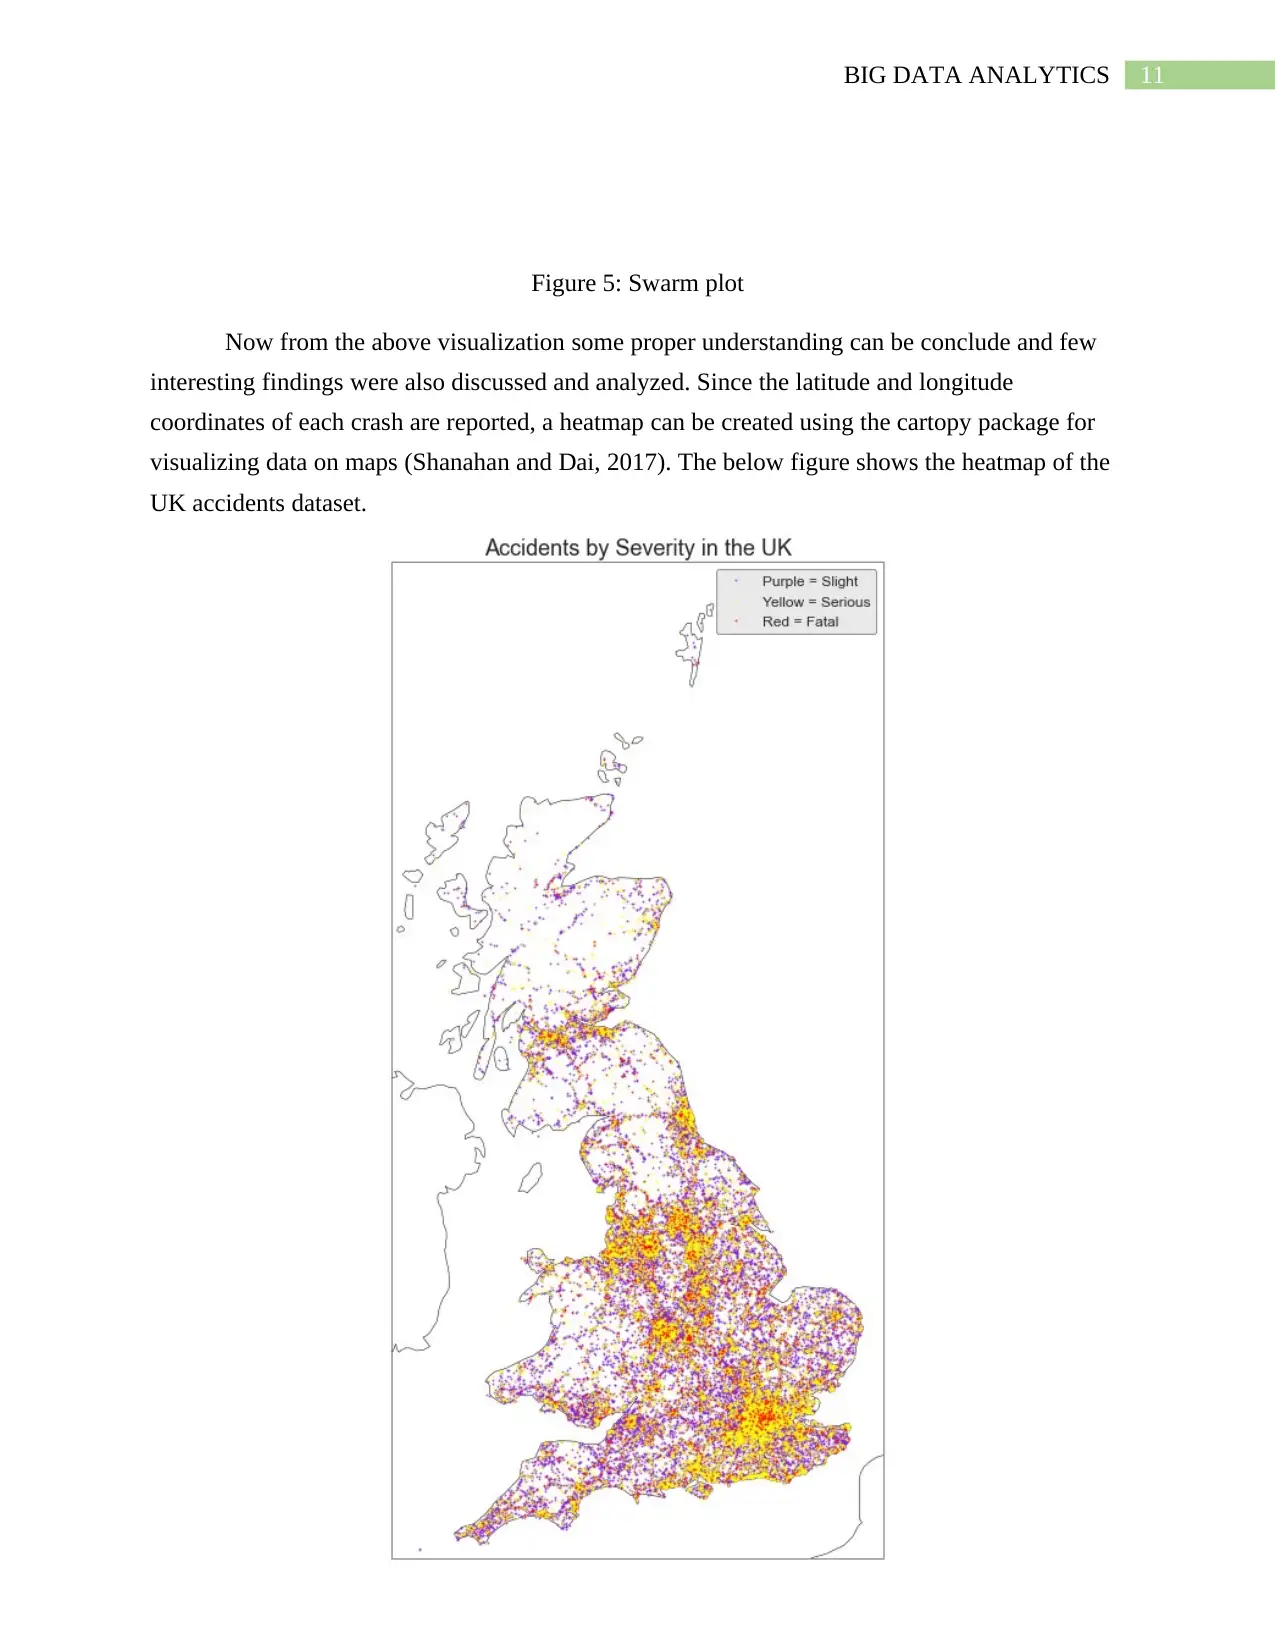
It will be interesting to create a swarmplot to see if more fatal accidents on wet roads
happen to younger people. Also, it will be clear that riding carefully in bad weather is necessary
or not.
using the LEFT () function in SQL, but it will be interesting to showcase the power of RDD's.
An RDD allows processing over the cluster, which is where PySpark really becomes useful.
Figure 4: Line plot of time series analysis
Thus, from figure 4 it can be said that during 7pm majority of the severe fatal accident
took place in the nation. The number of accidents took place is 17 during that particular time
period. The x axis represents the timings which are been divided to 30minutes of interval and the
y axis represents the number of severe accidents took place for different time.
It will be interesting to create a swarmplot to see if more fatal accidents on wet roads
happen to younger people. Also, it will be clear that riding carefully in bad weather is necessary
or not.
Paraphrase This Document
Need a fresh take? Get an instant paraphrase of this document with our AI Paraphraser
11BIG DATA ANALYTICS
Figure 5: Swarm plot
Now from the above visualization some proper understanding can be conclude and few
interesting findings were also discussed and analyzed. Since the latitude and longitude
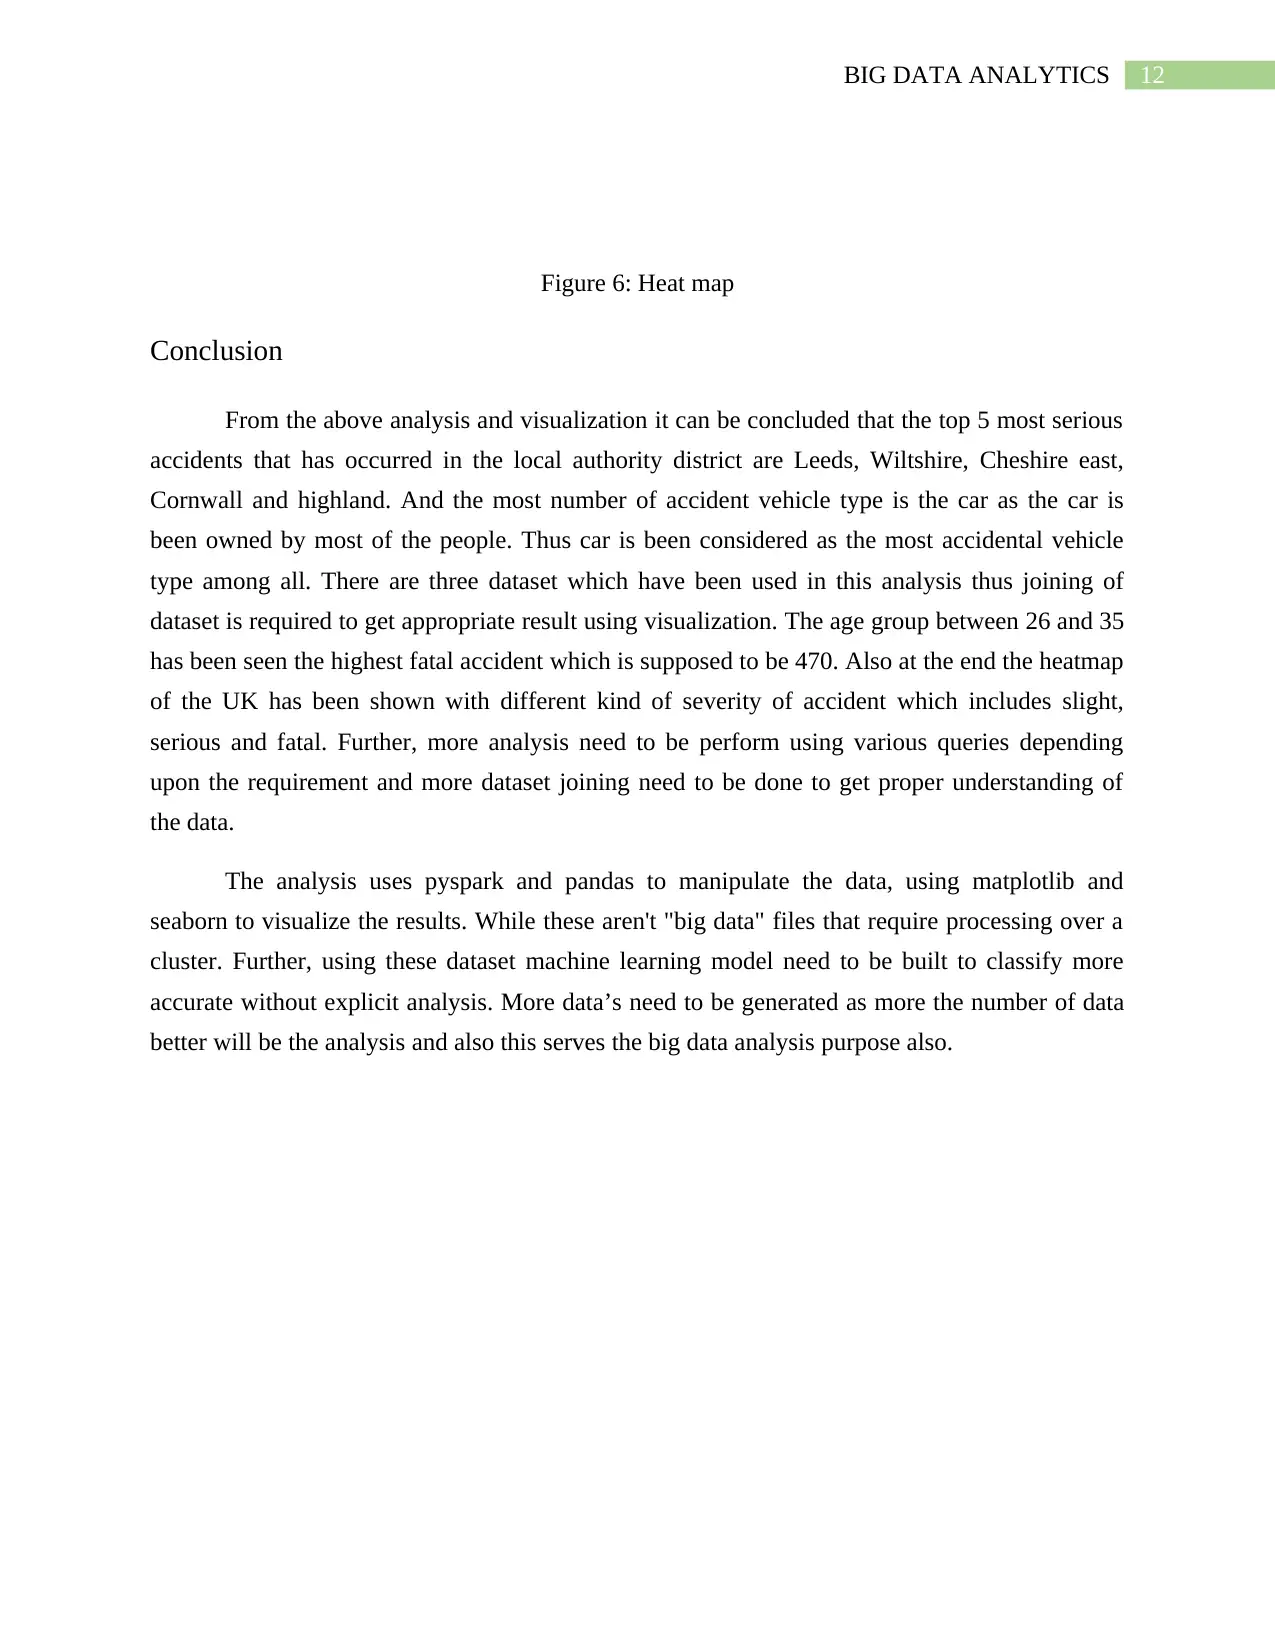
coordinates of each crash are reported, a heatmap can be created using the cartopy package for
visualizing data on maps (Shanahan and Dai, 2017). The below figure shows the heatmap of the
UK accidents dataset.
Figure 5: Swarm plot
Now from the above visualization some proper understanding can be conclude and few
interesting findings were also discussed and analyzed. Since the latitude and longitude
coordinates of each crash are reported, a heatmap can be created using the cartopy package for
visualizing data on maps (Shanahan and Dai, 2017). The below figure shows the heatmap of the
UK accidents dataset.
12BIG DATA ANALYTICS
Figure 6: Heat map
Conclusion
From the above analysis and visualization it can be concluded that the top 5 most serious
accidents that has occurred in the local authority district are Leeds, Wiltshire, Cheshire east,
Cornwall and highland. And the most number of accident vehicle type is the car as the car is
been owned by most of the people. Thus car is been considered as the most accidental vehicle
type among all. There are three dataset which have been used in this analysis thus joining of
dataset is required to get appropriate result using visualization. The age group between 26 and 35
has been seen the highest fatal accident which is supposed to be 470. Also at the end the heatmap
of the UK has been shown with different kind of severity of accident which includes slight,
serious and fatal. Further, more analysis need to be perform using various queries depending
upon the requirement and more dataset joining need to be done to get proper understanding of
the data.
The analysis uses pyspark and pandas to manipulate the data, using matplotlib and
seaborn to visualize the results. While these aren't "big data" files that require processing over a
cluster. Further, using these dataset machine learning model need to be built to classify more
accurate without explicit analysis. More data’s need to be generated as more the number of data
better will be the analysis and also this serves the big data analysis purpose also.
⊘ This is a preview!⊘
Do you want full access?
Subscribe today to unlock all pages.
Trusted by 1+ million students worldwide
1 out of 14
Related Documents


Your All-in-One AI-Powered Toolkit for Academic Success.
+13062052269
info@desklib.com
Available 24*7 on WhatsApp / Email
![[object Object]](/_next/static/media/star-bottom.7253800d.svg)
Unlock your academic potential
Copyright © 2020–2026 A2Z Services. All Rights Reserved. Developed and managed by ZUCOL.