LTI611S Civil Engineering: Intermodal Transportation Report Analysis
VerifiedAdded on 2022/08/17
|8
|1867
|12
Report
AI Summary
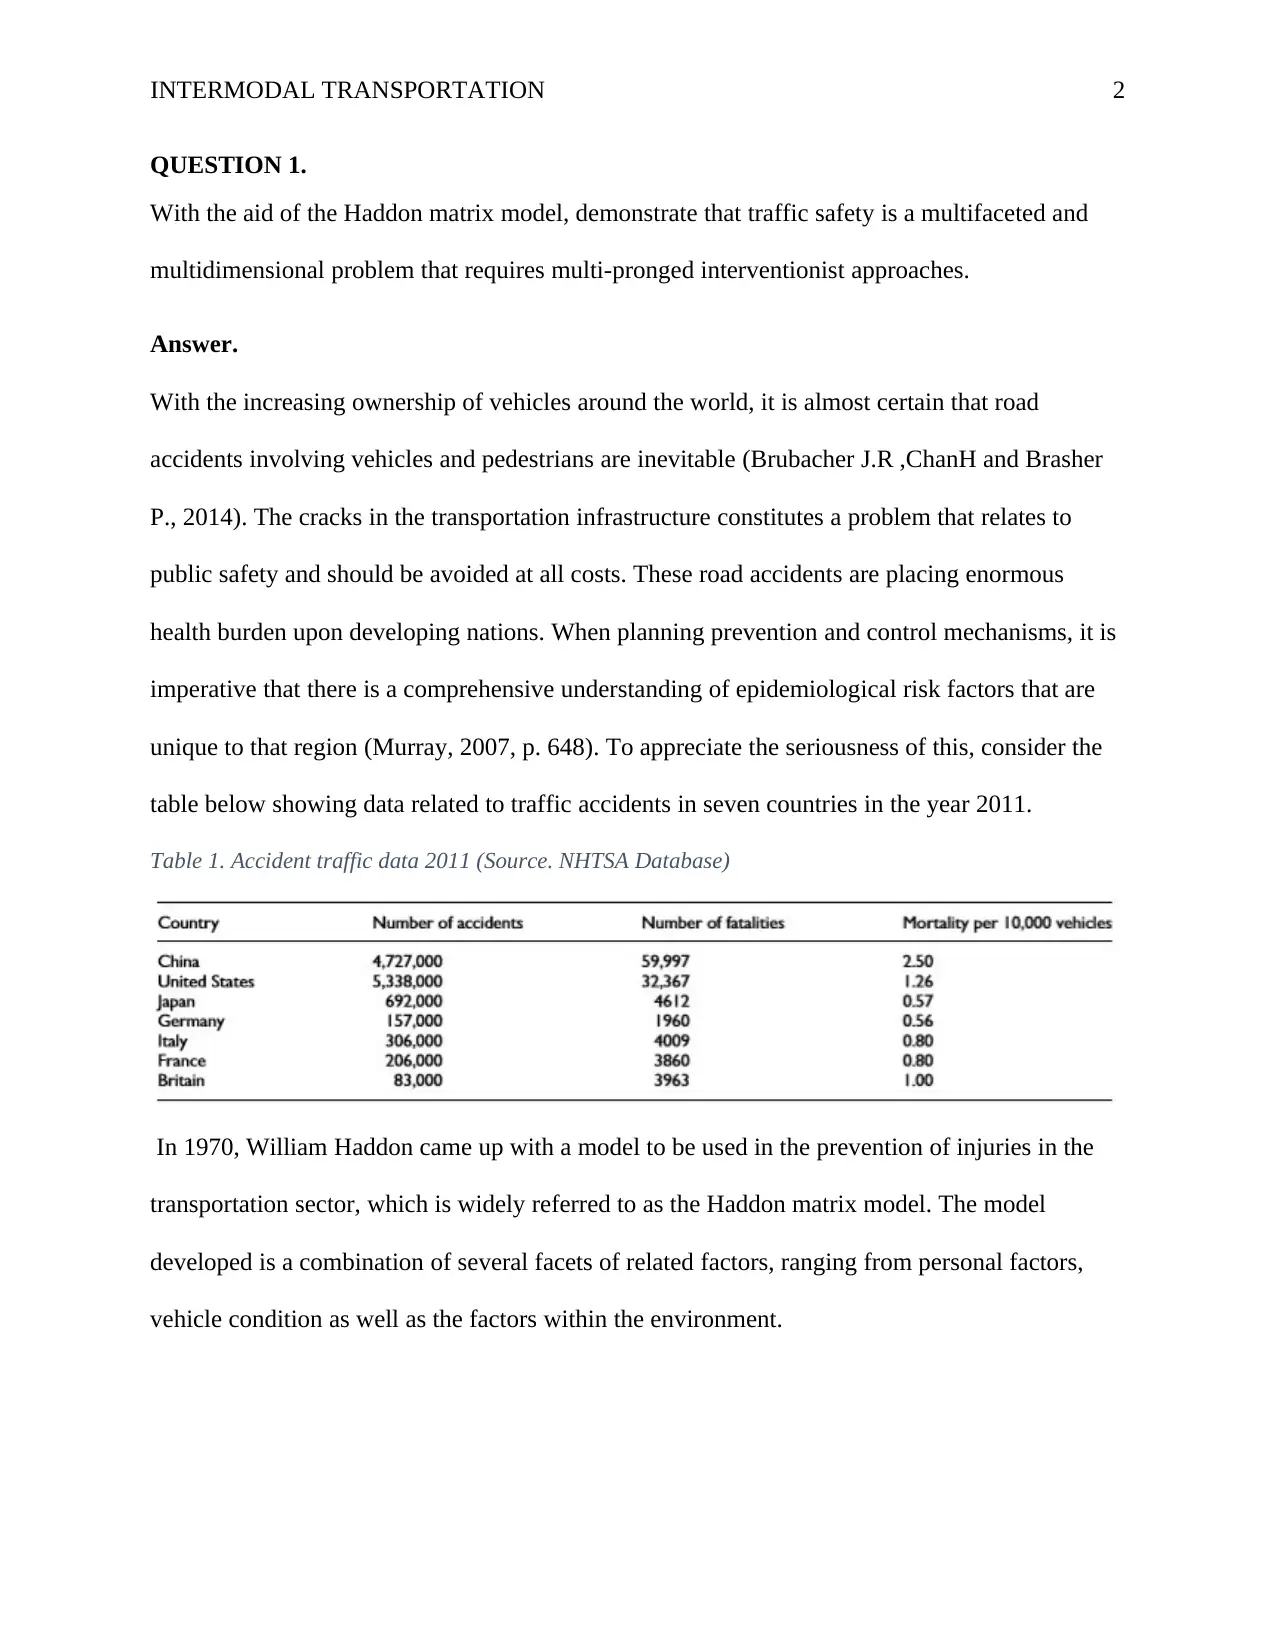
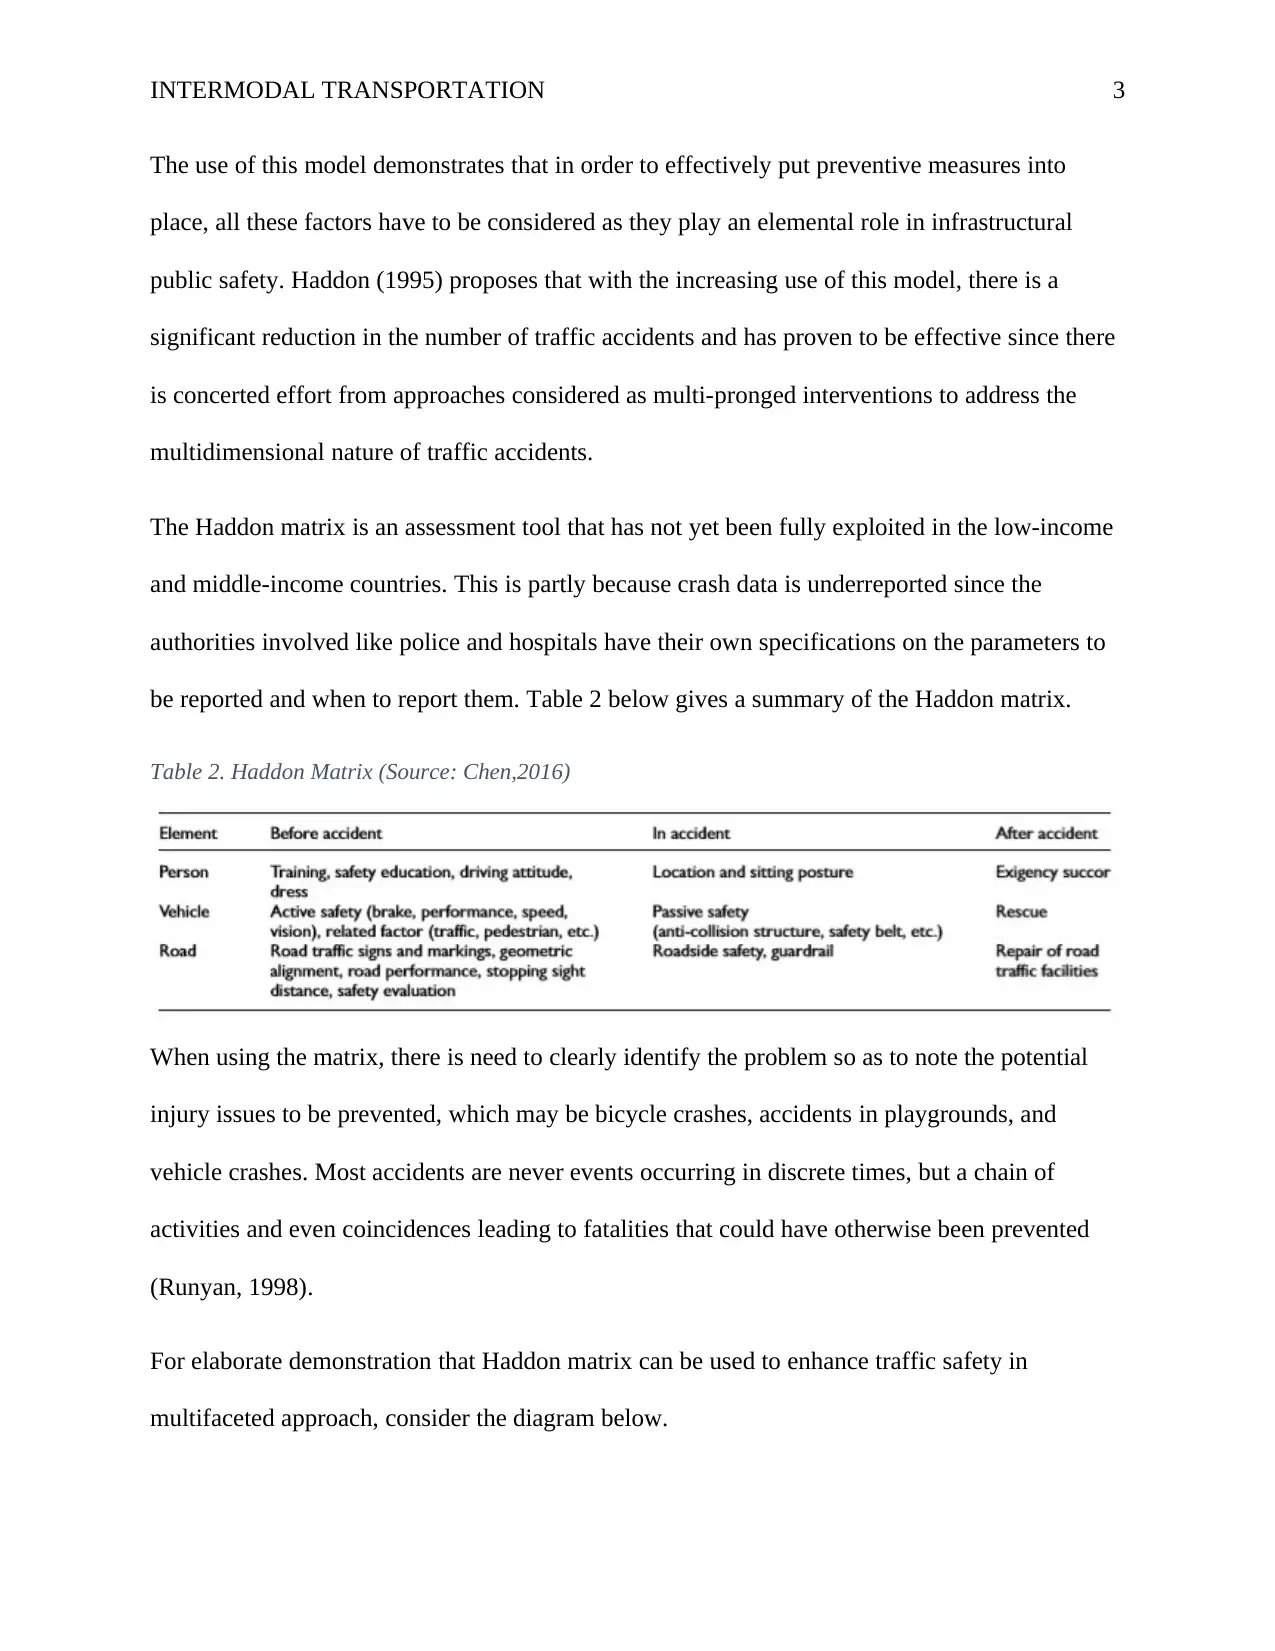
This report examines intermodal transportation, emphasizing road safety and data analysis within the context of civil engineering. It begins by demonstrating that traffic safety is a multifaceted problem requiring multi-pronged interventionist approaches, using the Haddon matrix model ...
Read More
Contribute Materials
Your contribution can guide someone’s learning journey. Share your
documents today.

Running head: INTERMODAL TRANSPORTATION
1
Civil Engineering
Land Transport Safety and Infrastructure Considerations
Name of Student:
Student ID:
Instructor:
Course: LTI611S
Submission date:
1
Civil Engineering
Land Transport Safety and Infrastructure Considerations
Name of Student:
Student ID:
Instructor:
Course: LTI611S
Submission date:
Secure Best Marks with AI Grader
Need help grading? Try our AI Grader for instant feedback on your assignments.

INTERMODAL TRANSPORTATION 2
QUESTION 1.
With the aid of the Haddon matrix model, demonstrate that traffic safety is a multifaceted and
multidimensional problem that requires multi-pronged interventionist approaches.
Answer.
With the increasing ownership of vehicles around the world, it is almost certain that road
accidents involving vehicles and pedestrians are inevitable (Brubacher J.R ,ChanH and Brasher
P., 2014). The cracks in the transportation infrastructure constitutes a problem that relates to
public safety and should be avoided at all costs. These road accidents are placing enormous
health burden upon developing nations. When planning prevention and control mechanisms, it is
imperative that there is a comprehensive understanding of epidemiological risk factors that are
unique to that region (Murray, 2007, p. 648). To appreciate the seriousness of this, consider the
table below showing data related to traffic accidents in seven countries in the year 2011.
Table 1. Accident traffic data 2011 (Source. NHTSA Database)
In 1970, William Haddon came up with a model to be used in the prevention of injuries in the
transportation sector, which is widely referred to as the Haddon matrix model. The model
developed is a combination of several facets of related factors, ranging from personal factors,
vehicle condition as well as the factors within the environment.

INTERMODAL TRANSPORTATION 3
The use of this model demonstrates that in order to effectively put preventive measures into
place, all these factors have to be considered as they play an elemental role in infrastructural
public safety. Haddon (1995) proposes that with the increasing use of this model, there is a
significant reduction in the number of traffic accidents and has proven to be effective since there
is concerted effort from approaches considered as multi-pronged interventions to address the
multidimensional nature of traffic accidents.
The Haddon matrix is an assessment tool that has not yet been fully exploited in the low-income
and middle-income countries. This is partly because crash data is underreported since the
authorities involved like police and hospitals have their own specifications on the parameters to
be reported and when to report them. Table 2 below gives a summary of the Haddon matrix.
Table 2. Haddon Matrix (Source: Chen,2016)
When using the matrix, there is need to clearly identify the problem so as to note the potential
injury issues to be prevented, which may be bicycle crashes, accidents in playgrounds, and
vehicle crashes. Most accidents are never events occurring in discrete times, but a chain of
activities and even coincidences leading to fatalities that could have otherwise been prevented
(Runyan, 1998).
For elaborate demonstration that Haddon matrix can be used to enhance traffic safety in
multifaceted approach, consider the diagram below.

INTERMODAL TRANSPORTATION 4
Figure 1. The 3-D Haddon matrix
From the diagram above, it can be seen that the model proposes three phases of prevention of the
traffic accidents, prior to occurrence of the accident, during the accident and after the accident.
The latter can be confusing but take for instance, actions taken to deal with a violent traffic
offender are essential in avoiding future occurrences of similar incidences, thus as much as it is a
post-event in the context of one event, it is also a pre-event in the future incident. Similarly,
punishing a drunkard driver who has just caused a crush is a post-evet because it happens after
the crush. However, it is a lesson and a strategy to ensure that such similar incidences do not
occur in future hence a pre-event in the strategizing towards the future (Wegman, 2016).
The model presented in fig.1 represents a perfect combination of the phases, factors and decision
criteria that must all be incorporated in prevention mechanism of traffic accidents. Employing
prevention strategies using one dimension say the phases without considering the factors
(vehicle, host and physical environments) would prove futile since the risk has not been reduced
fully. Risk in this context can be defined as:
Secure Best Marks with AI Grader
Need help grading? Try our AI Grader for instant feedback on your assignments.

INTERMODAL TRANSPORTATION 5
Risk= Crash frequency x severity
(probability x exposure) (crash cost in lives)
Therefore, there is need to deliberately introduce integrated approach as proposed by the Hudson
matrix when developing preventive measures aimed at reducing traffic accidents and
consequently injuries.
In its most basic form, the model for injury control primarily focused on the driver, road and the
vehicle (Edmonston, 2007). These are the multifaceted dimensions that needs to be integrated to
effectively control injuries. Giving consideration to say the conduct of driver and ignoring the
vehicle and physical state of the road does not give desired results. Similarly, addressing the
condition of the vehicle and road but ignoring the driver (who may be drunk or has not
undergone through proper training) does not achieve much in prevention of road carnages. All
these dimensions must be considered, hence the need to employ the Haddon’s matrix.
Over time however, theorists have expounded on the initial model adding a number of factors to
help in informed decision making when deciding the course of actions for preventive measures.
In summary, Haddon matrix has proved to be elemental in guiding research and interventions
aimed at prevention of injuries and fatalities in traffic accidents. The fact that it considers a
number of factors increases its efficiency and effectiveness resulting into appropriate
interventions as the first step involves a comprehensive understanding of the problem.

INTERMODAL TRANSPORTATION 6
QUESTION 2.
“Designing an effective road safety and conducting good quality road safety studies are
impossible without good data” (Wegman’s, 2016:1). In light of this statement, discuss how you
would go about collecting and analyzing the following types of road safety data:
a) Crash data
Crash data is obtained from accident and emergency departments of hospitals and police
reports, since these are the first responders to get such information when it occurs. In the
process of obtaining this data, patient confidentiality must be observed (Wegman, 2016).
From reports made by police, the number of people injured and the severity of the
injuries can be accessed. There is a step wise approach in collecting crash data as outlined
below:
All patients attending the accident and emergency department had their details
recorded. These details include name, address, age, sex, marital status, source of
injury, time, date and day of arrival.
The doctor who handles the accident victims record their medical conditions
The information is then coded appropriately for analysis
The survey form is then given to a senior doctor who recorded the Abbreviated
Injury Scale Score (AISS) to help in determining the Injury Severity Score (ISS),
the first process in analysis. Similarly, the length of admission is vital since
admissions less than 3 nights is considered as short, those between 3 to 28 nights
medium while admissions exceeding 28 nights is considered to be long.
A post mortem report is used to extract information of patients declared dead on
arrival or those who died after being admitted.

INTERMODAL TRANSPORTATION 7
This step-by- step procedure is straightforward and ensures that reliable and relevant crash data
is collected and analyzed to compute the number and severity of injuries resulting from road
accidents while upholding patient confidentiality at the same time.
The analysis also involves crash frequency and rate so as to put in place preventive measures to
curb road accidents, a concept illustrated by Chen et al. (2016). Areas where crash is more likely
to occur are also noted, which may be contributed to geometric design of the road and the
general physical environment.
b) Exposure data
Exposure data is used to obtain risk data in the form of outcome per unit exposure, and also to
describe the differences in the road safety situation (Rob Floyd and Tyson Graves, 2006). It
should be noted that there is no any standard way of collecting exposure data.
A travel survey may come in handy when collecting data about vehicle kilometers, number of
trips, duration spent in traffic, and ownership of vehicle. Methods of collecting exposure data
therefore include travel surveys, traffic count, vehicle fleet registers, driving license registers,
and road registers (World Health Organisation, 2013).
Analysis of exposure data involves obtaining risk estimates, which is the rate of the number of
accidents divided by the amount of exposure of a population in a given period of time. The
information so obtained after the analysis ensures that process of decision making and policy
implementation is informed and remains relevant to attaining the main objective of accident
reduction to enhance road safety.
References
Paraphrase This Document
Need a fresh take? Get an instant paraphrase of this document with our AI Paraphraser

INTERMODAL TRANSPORTATION 8
Brubacher J.R ,ChanH and Brasher P. (2014). Reduction in fatalities, ambulance calls, and
hospital admissions for road trauma after implementation of new traffic laws. Journal of
Public Health, 104(10), 89-97. doi:10.2105/AJPH. 2014.302068
Edmonston, C. J. (2007). Applying the Haddon Matrix to school transport safety. Journal of
Educational Safety, 1-8.
Haddon, W. (1995). Energydamageandthe10countermeasurestrategies. International Journal of
Prevention, 1(1), 40-44.
Murray, W. (2007). Work-related driving and driver distraction: Using the Haddon matrix to
identify and manage the distractions. Journal of Safety and Policy Analysis International,
641-657.
Rob Floyd and Tyson Graves. (2006, February). CRASH DATA COLLECTION AND
ANALYSIS SYSTEM. pp. 1-91.
Runyan, C. W. (1998). Using the Haddon matrix: introducing the third dimension. Journal of
Injury Prevention, 4, 302-307.
Rustagi, N. (2017, May 3). Applying Haddon Matrix for Evaluation of Road Crash Victims in
Delhi, India. Indian Journal of Surgery, 1-10. doi:10.1007/s12262-017-1632-0
Tao Chen, Chu Zhang and Lifeng Xu. (2016). Factor analysis of fatal road traffic crashes with
massive casualties in China. Advances in Mechanical Engineering, 8(4), 1-11.
doi:10.1177/168781401664271
Wegman, F. (2016). Road safety, data collection, analysis, indicators and targets. Netherlands.
World Health Organisation. (2013). Global status report on road safety:: supporting a decade of
action.
1 out of 8

Your All-in-One AI-Powered Toolkit for Academic Success.
+13062052269
info@desklib.com
Available 24*7 on WhatsApp / Email
Unlock your academic potential
© 2024 | Zucol Services PVT LTD | All rights reserved.