Roast Ltd: Financial Decision Making and Performance Analysis Report
VerifiedAdded on 2023/01/17
|18
|4511
|71
Report
AI Summary
This report provides a comprehensive financial analysis of Roast Ltd, a UK-based cafe. It begins with an industry review of the cafe and coffee shop market in the UK, highlighting market growth, key players, opportunities, and challenges. The core of the report focuses on Roast Ltd's financial performance, analyzing its statement of profit or loss, statement of financial position, and cash flow statements for 2017 and 2018. The analysis includes detailed examination of revenue, cost of sales, operating expenses, and profitability ratios such as gross margin, net margin, and return on equity. The report evaluates the company's liquidity and solvency positions using current, quick, and debt-to-equity ratios. Furthermore, the report delves into investment appraisal, including management forecasts and various investment appraisal techniques to assess the viability of a proposed £400 million investment. The analysis also covers the sources of finance used by the company, including loans taken for expansion. The report concludes by summarizing the financial health of the company and making recommendations for improvement.
FINANCIAL DECISION
MAKING
MAKING
Paraphrase This Document
Need a fresh take? Get an instant paraphrase of this document with our AI Paraphraser
TABLE OF CONTENTS
EXECUTIVE SUMMARY.............................................................................................................1
PART 1 :INDUSTRY REVIEW.....................................................................................................1
PART 2 : BUSINESS PERFORMANCE ANALYSIS...................................................................2
2.1 Statement of Profit or Loss....................................................................................................2
2.2 Statement of Financial position............................................................................................5
2.3 Statements of cash flows........................................................................................................8
PART 3 : INVESTMENT APPRAISAL ......................................................................................10
3.1.a Management Forecast .....................................................................................................10
3.1.b Investment appraisal techniques ......................................................................................10
3.2 Sources of Finance...............................................................................................................11
REFERENCES..............................................................................................................................14
EXECUTIVE SUMMARY
The report will be revealing about the present scenario of cafe industry. Cafe industry of
UK is growing with a good speed along giving rise to coffee culture. Report includes the
analysis of financial statements of Roast ltd. The financial statements of company reveal
represent good and healthy position from its core. Making deep analysis through analysis it could
be identified that it is suffering from critical stage. It is showing profitability growth in the
present year where company in actual has negative in cash balances. Company has run out of
cash due to its expansions plans as it has purchased inventory, equipments and property in
Romania. For expansions plan it has also taken loans from banks that has raised its financial cost.
Company is planning to expand its business for whir it is requiring investment of £400 m. For
knowing the viability of investment various investment appraisal techniques have been used.
PART 1 :INDUSTRY REVIEW
Industry of cafe and restaurants also includes the establishments that are unlicensed and
and focus over the sales of coffee, hot and cold drinks and snacks. The coffee shop market of UK
has grown by 7.9% during 2018 in turnover representing consecutive 20 years of outlet growth
and sales. Industry leader are having discussions on negative impact of trade and consumers
confidence that can blow the sector off in 2019. As per the reports of Allegra world coffee Portal
on cafe industry of UK, revealing that cafe and coffee shops market of UK is valued at £10.1 bn
around 25,483 outlets. Annual sales have increased with 7.9% cemented from growth of two
decades. The turbulence because of Brexit is impeding the sector.
Branded cafes have secured outlet growth of 8.7% in 2018. fragility in economy of UK is
a concern for the industry. Coffee shops are vital piece of the UK's high streets. Research shows
that cafes are placed well for catalysing the increasing consumers preference for the experience
and the digitally enhanced of retail concepts. Majority of the industry leaders are of the view
that social media is proving to be an effective marketing source (World Coffee Portal, 2019).
Costa Coffee, Starbusks and Caffe Nero have remained the largest players in Coffee industry of
UK with 2655 outlets, 992 & 683 stores.
Opportunities and Challenges
1
⊘ This is a preview!⊘
Do you want full access?
Subscribe today to unlock all pages.
Trusted by 1+ million students worldwide
Relationship of UK with EU is impacting coffee and cafe shops industry. Political
impasse is contributing towards the rising prices, labour shortages and consumer
confidence.
Brexit is negatively impacting the industry and the economy and shops have to make
adequate measures for addressing the challenges.
Major deals like acquisition by Coca Cola of market leader Costa Coffee for 3.9 bn and
acquisition of Pret A by JAB Holdings for 1.5 bn has introduced foreign investment to
coffee chain market of UK.
It is forecasted that outlets of the country will be increasing and turnovers will be
increased with growth of 5%.
Currency depreciations can make the imports of raw materials from abroad costlier.
PART 2 : BUSINESS PERFORMANCE ANALYSIS
Analysing the performance of company using appropriate methods.
2.1 Statement of Profit or Loss
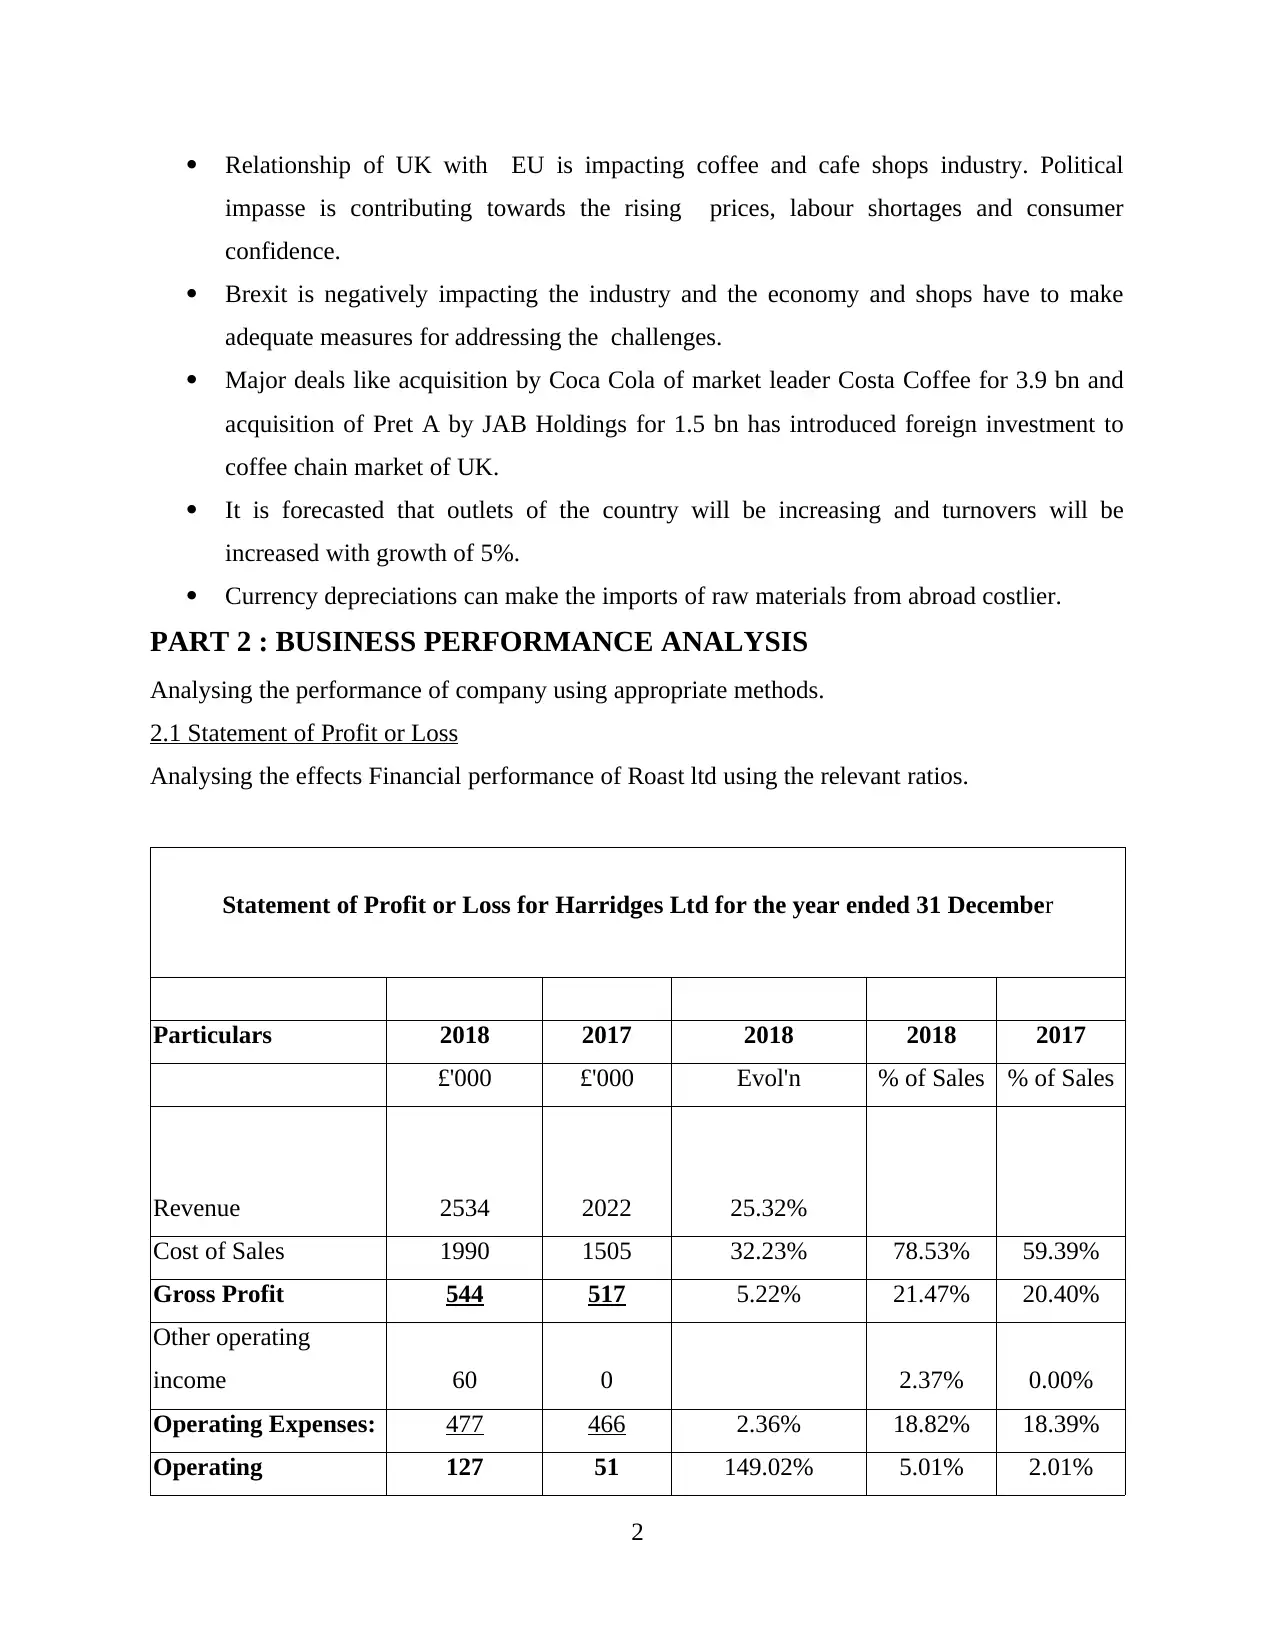
Analysing the effects Financial performance of Roast ltd using the relevant ratios.
Statement of Profit or Loss for Harridges Ltd for the year ended 31 December
Particulars 2018 2017 2018 2018 2017
£'000 £'000 Evol'n % of Sales % of Sales
Revenue 2534 2022 25.32%
Cost of Sales 1990 1505 32.23% 78.53% 59.39%
Gross Profit 544 517 5.22% 21.47% 20.40%
Other operating
income 60 0 2.37% 0.00%
Operating Expenses: 477 466 2.36% 18.82% 18.39%
Operating 127 51 149.02% 5.01% 2.01%
2
impasse is contributing towards the rising prices, labour shortages and consumer
confidence.
Brexit is negatively impacting the industry and the economy and shops have to make
adequate measures for addressing the challenges.
Major deals like acquisition by Coca Cola of market leader Costa Coffee for 3.9 bn and
acquisition of Pret A by JAB Holdings for 1.5 bn has introduced foreign investment to
coffee chain market of UK.
It is forecasted that outlets of the country will be increasing and turnovers will be
increased with growth of 5%.
Currency depreciations can make the imports of raw materials from abroad costlier.
PART 2 : BUSINESS PERFORMANCE ANALYSIS
Analysing the performance of company using appropriate methods.
2.1 Statement of Profit or Loss
Analysing the effects Financial performance of Roast ltd using the relevant ratios.
Statement of Profit or Loss for Harridges Ltd for the year ended 31 December
Particulars 2018 2017 2018 2018 2017
£'000 £'000 Evol'n % of Sales % of Sales
Revenue 2534 2022 25.32%
Cost of Sales 1990 1505 32.23% 78.53% 59.39%
Gross Profit 544 517 5.22% 21.47% 20.40%
Other operating
income 60 0 2.37% 0.00%
Operating Expenses: 477 466 2.36% 18.82% 18.39%
Operating 127 51 149.02% 5.01% 2.01%
2
Paraphrase This Document
Need a fresh take? Get an instant paraphrase of this document with our AI Paraphraser
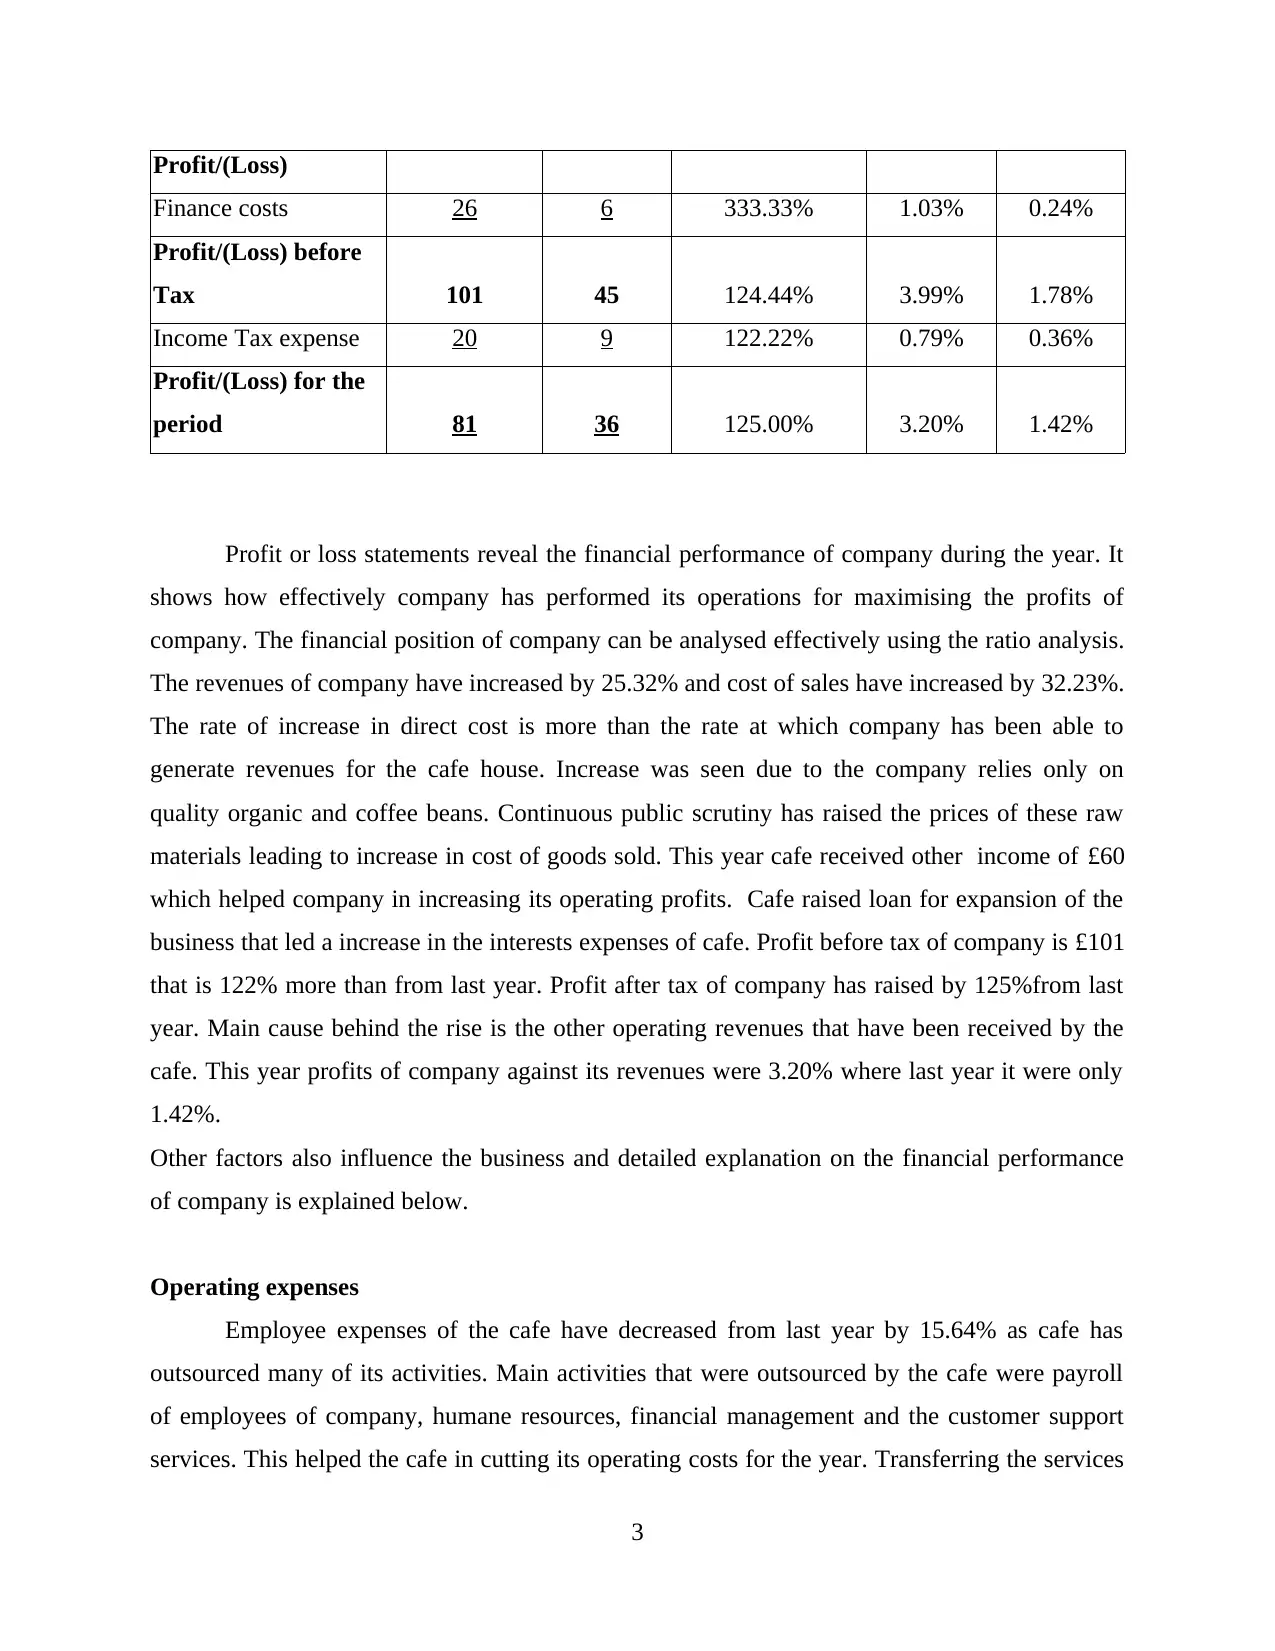
Profit/(Loss)
Finance costs 26 6 333.33% 1.03% 0.24%
Profit/(Loss) before
Tax 101 45 124.44% 3.99% 1.78%
Income Tax expense 20 9 122.22% 0.79% 0.36%
Profit/(Loss) for the
period 81 36 125.00% 3.20% 1.42%
Profit or loss statements reveal the financial performance of company during the year. It
shows how effectively company has performed its operations for maximising the profits of
company. The financial position of company can be analysed effectively using the ratio analysis.
The revenues of company have increased by 25.32% and cost of sales have increased by 32.23%.
The rate of increase in direct cost is more than the rate at which company has been able to
generate revenues for the cafe house. Increase was seen due to the company relies only on
quality organic and coffee beans. Continuous public scrutiny has raised the prices of these raw
materials leading to increase in cost of goods sold. This year cafe received other income of £60
which helped company in increasing its operating profits. Cafe raised loan for expansion of the
business that led a increase in the interests expenses of cafe. Profit before tax of company is £101
that is 122% more than from last year. Profit after tax of company has raised by 125%from last
year. Main cause behind the rise is the other operating revenues that have been received by the
cafe. This year profits of company against its revenues were 3.20% where last year it were only
1.42%.
Other factors also influence the business and detailed explanation on the financial performance
of company is explained below.
Operating expenses
Employee expenses of the cafe have decreased from last year by 15.64% as cafe has
outsourced many of its activities. Main activities that were outsourced by the cafe were payroll
of employees of company, humane resources, financial management and the customer support
services. This helped the cafe in cutting its operating costs for the year. Transferring the services
3
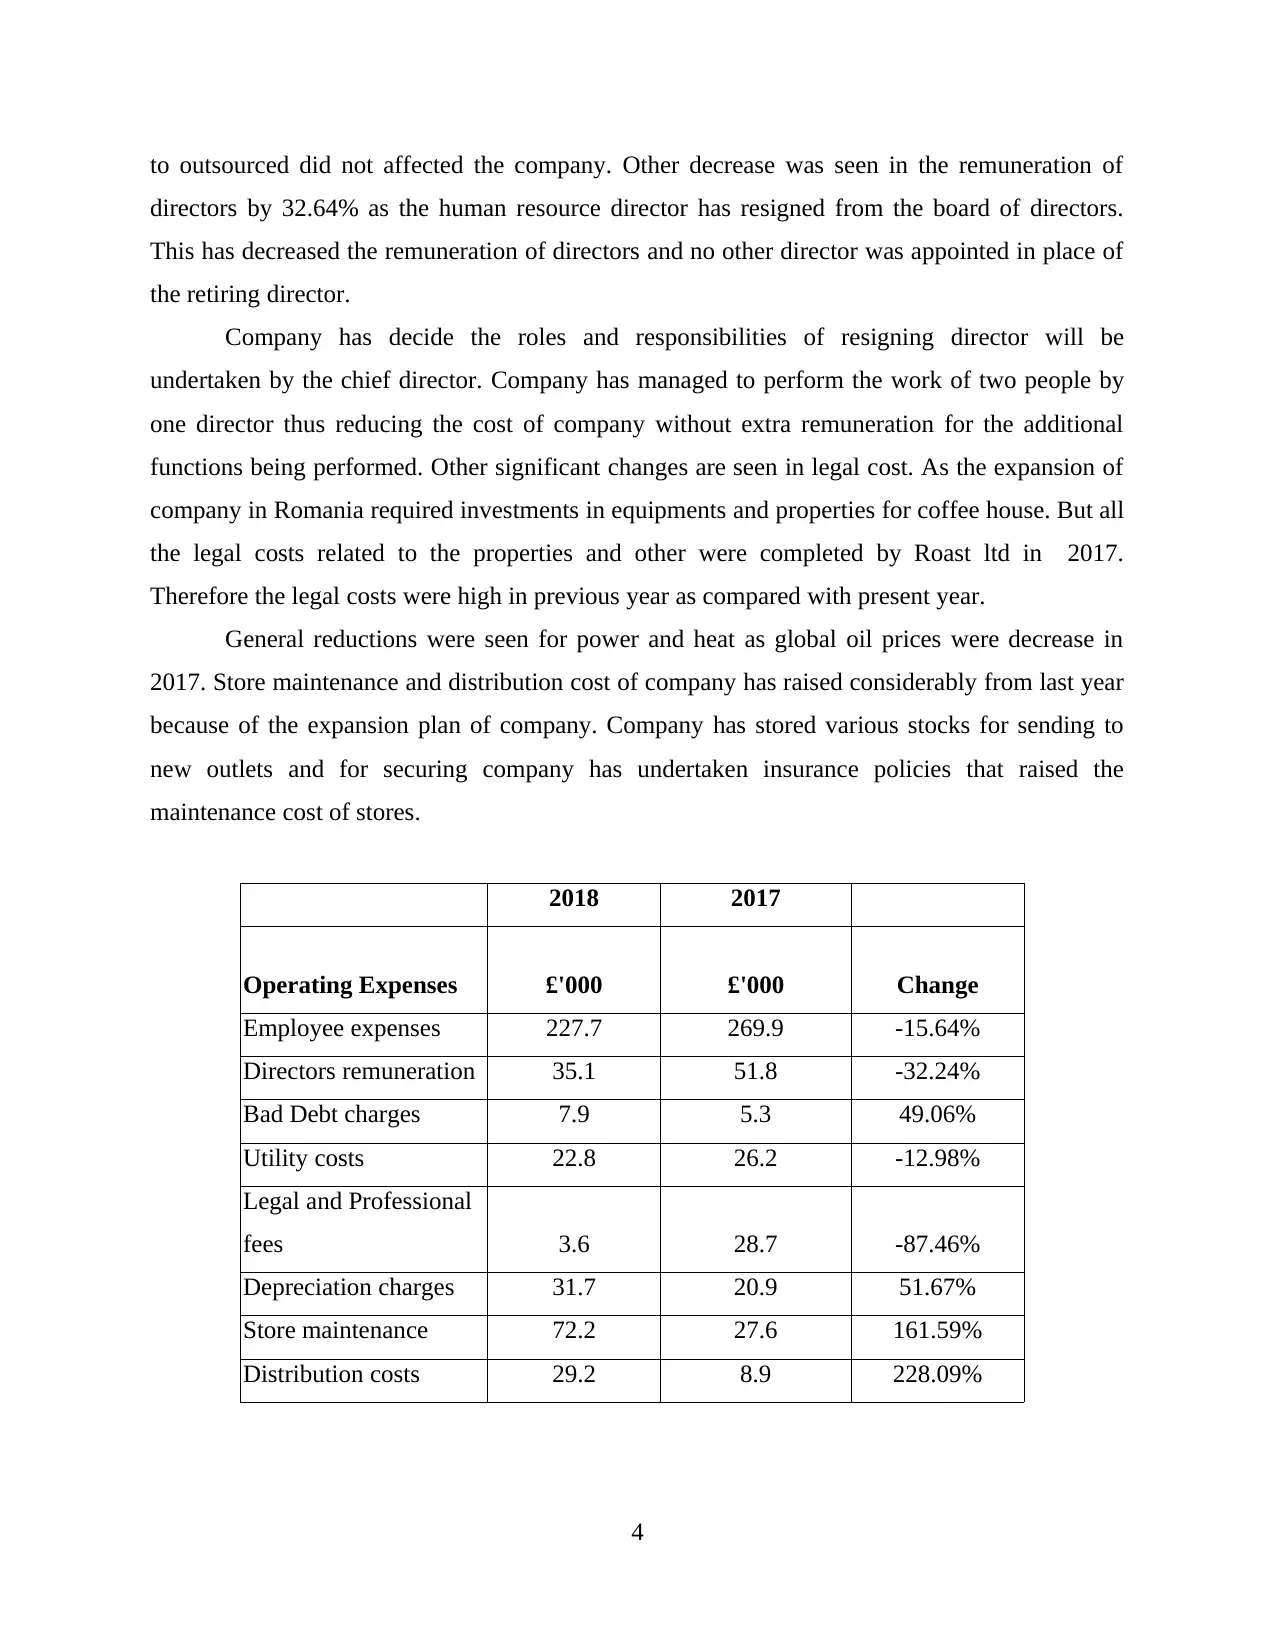
to outsourced did not affected the company. Other decrease was seen in the remuneration of
directors by 32.64% as the human resource director has resigned from the board of directors.
This has decreased the remuneration of directors and no other director was appointed in place of
the retiring director.
Company has decide the roles and responsibilities of resigning director will be
undertaken by the chief director. Company has managed to perform the work of two people by
one director thus reducing the cost of company without extra remuneration for the additional
functions being performed. Other significant changes are seen in legal cost. As the expansion of
company in Romania required investments in equipments and properties for coffee house. But all
the legal costs related to the properties and other were completed by Roast ltd in 2017.
Therefore the legal costs were high in previous year as compared with present year.
General reductions were seen for power and heat as global oil prices were decrease in
2017. Store maintenance and distribution cost of company has raised considerably from last year
because of the expansion plan of company. Company has stored various stocks for sending to
new outlets and for securing company has undertaken insurance policies that raised the
maintenance cost of stores.
2018 2017
Operating Expenses £'000 £'000 Change
Employee expenses 227.7 269.9 -15.64%
Directors remuneration 35.1 51.8 -32.24%
Bad Debt charges 7.9 5.3 49.06%
Utility costs 22.8 26.2 -12.98%
Legal and Professional
fees 3.6 28.7 -87.46%
Depreciation charges 31.7 20.9 51.67%
Store maintenance 72.2 27.6 161.59%
Distribution costs 29.2 8.9 228.09%
4
⊘ This is a preview!⊘
Do you want full access?
Subscribe today to unlock all pages.
Trusted by 1+ million students worldwide
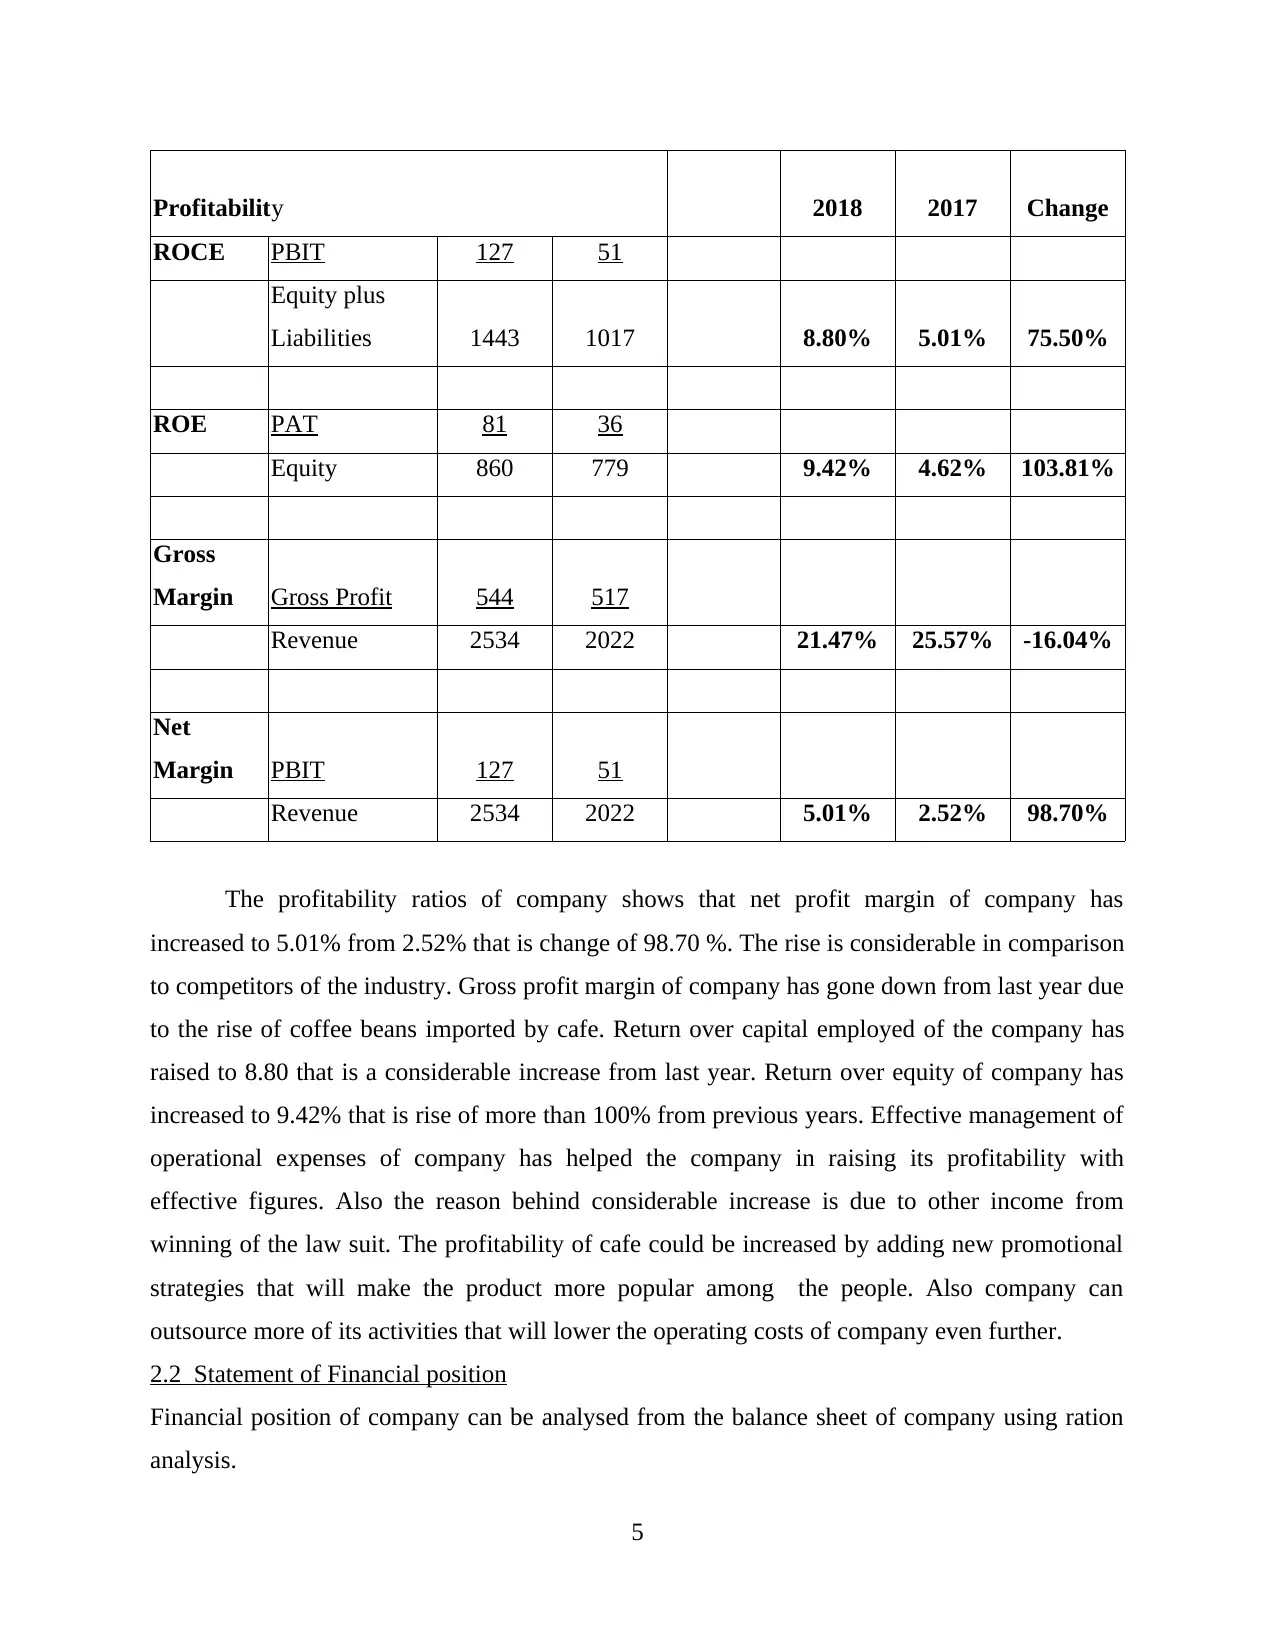
Profitability 2018 2017 Change
ROCE PBIT 127 51
Equity plus
Liabilities 1443 1017 8.80% 5.01% 75.50%
ROE PAT 81 36
Equity 860 779 9.42% 4.62% 103.81%
Gross
Margin Gross Profit 544 517
Revenue 2534 2022 21.47% 25.57% -16.04%
Net
Margin PBIT 127 51
Revenue 2534 2022 5.01% 2.52% 98.70%
The profitability ratios of company shows that net profit margin of company has
increased to 5.01% from 2.52% that is change of 98.70 %. The rise is considerable in comparison
to competitors of the industry. Gross profit margin of company has gone down from last year due
to the rise of coffee beans imported by cafe. Return over capital employed of the company has
raised to 8.80 that is a considerable increase from last year. Return over equity of company has
increased to 9.42% that is rise of more than 100% from previous years. Effective management of
operational expenses of company has helped the company in raising its profitability with
effective figures. Also the reason behind considerable increase is due to other income from
winning of the law suit. The profitability of cafe could be increased by adding new promotional
strategies that will make the product more popular among the people. Also company can
outsource more of its activities that will lower the operating costs of company even further.
2.2 Statement of Financial position
Financial position of company can be analysed from the balance sheet of company using ration
analysis.
5
Paraphrase This Document
Need a fresh take? Get an instant paraphrase of this document with our AI Paraphraser
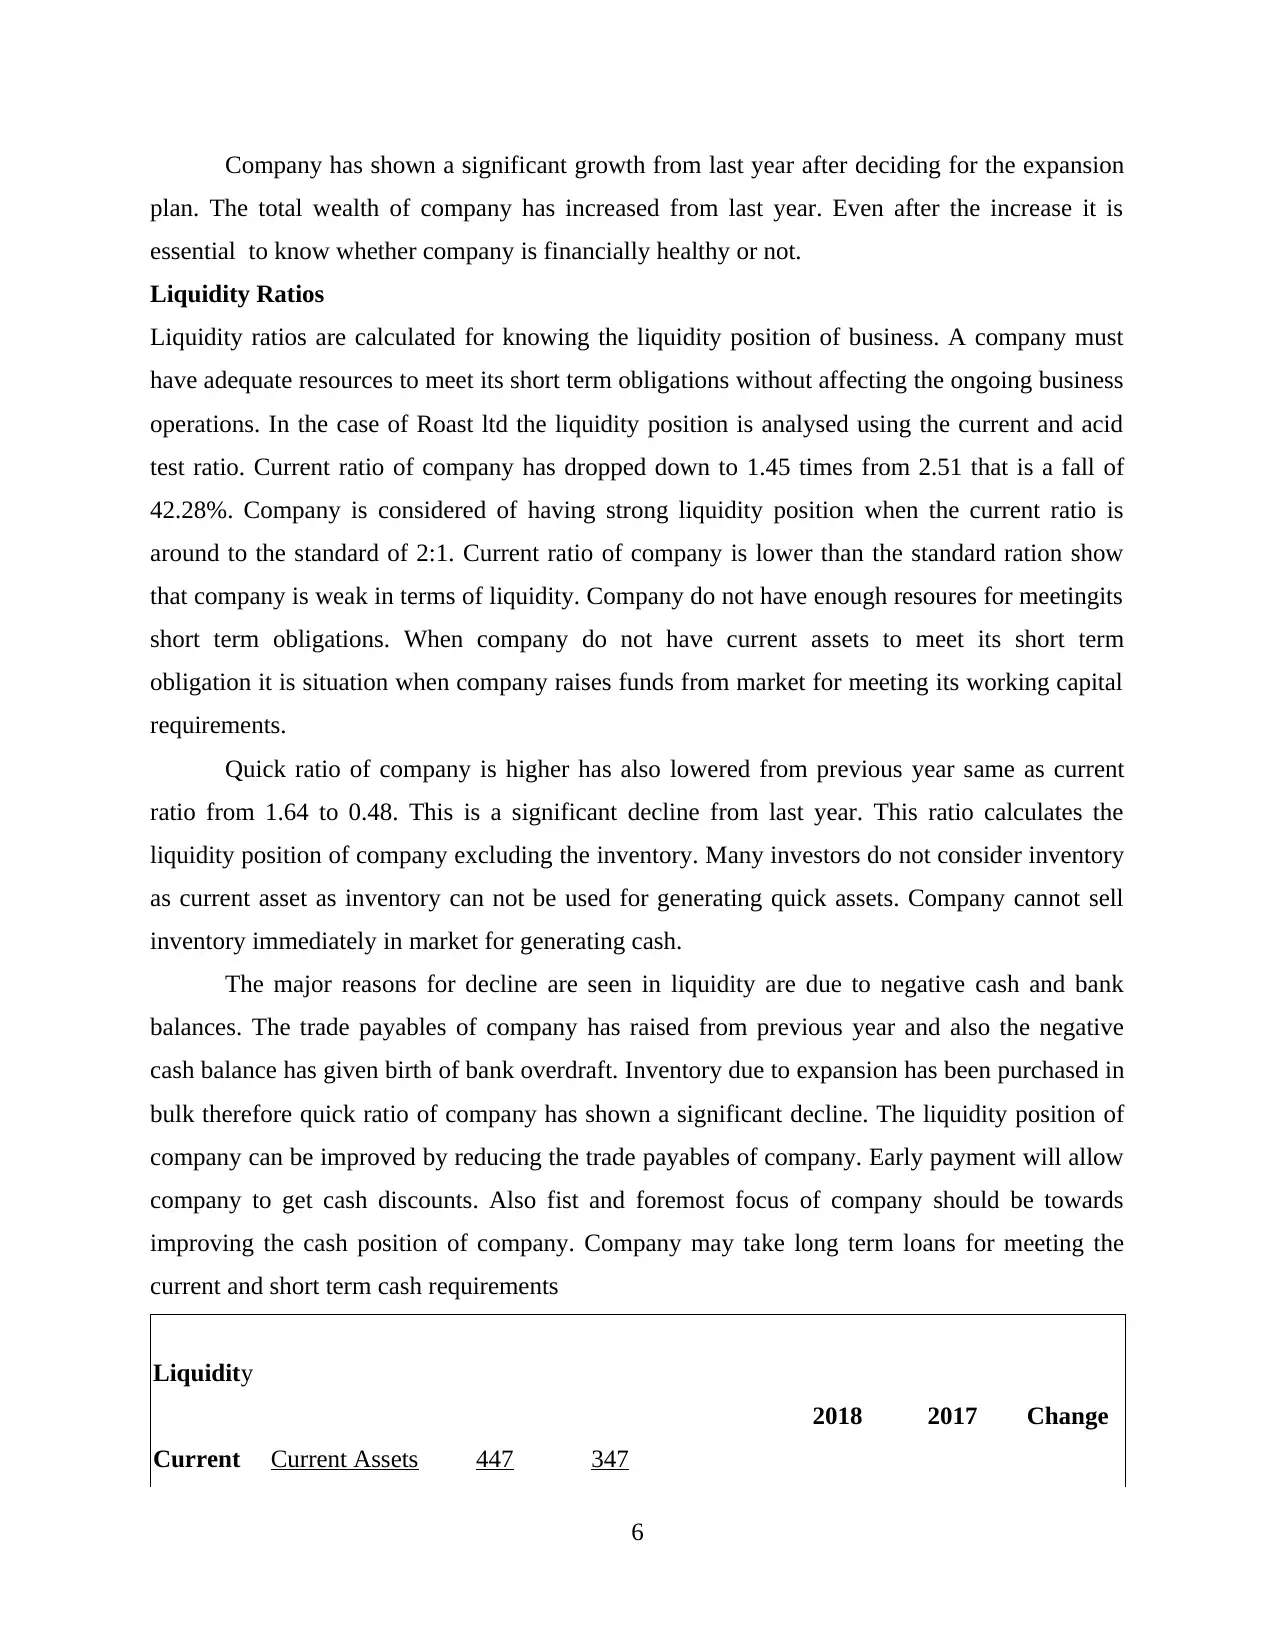
Company has shown a significant growth from last year after deciding for the expansion
plan. The total wealth of company has increased from last year. Even after the increase it is
essential to know whether company is financially healthy or not.
Liquidity Ratios
Liquidity ratios are calculated for knowing the liquidity position of business. A company must
have adequate resources to meet its short term obligations without affecting the ongoing business
operations. In the case of Roast ltd the liquidity position is analysed using the current and acid
test ratio. Current ratio of company has dropped down to 1.45 times from 2.51 that is a fall of
42.28%. Company is considered of having strong liquidity position when the current ratio is
around to the standard of 2:1. Current ratio of company is lower than the standard ration show
that company is weak in terms of liquidity. Company do not have enough resoures for meetingits
short term obligations. When company do not have current assets to meet its short term
obligation it is situation when company raises funds from market for meeting its working capital
requirements.
Quick ratio of company is higher has also lowered from previous year same as current
ratio from 1.64 to 0.48. This is a significant decline from last year. This ratio calculates the
liquidity position of company excluding the inventory. Many investors do not consider inventory
as current asset as inventory can not be used for generating quick assets. Company cannot sell
inventory immediately in market for generating cash.
The major reasons for decline are seen in liquidity are due to negative cash and bank
balances. The trade payables of company has raised from previous year and also the negative
cash balance has given birth of bank overdraft. Inventory due to expansion has been purchased in
bulk therefore quick ratio of company has shown a significant decline. The liquidity position of
company can be improved by reducing the trade payables of company. Early payment will allow
company to get cash discounts. Also fist and foremost focus of company should be towards
improving the cash position of company. Company may take long term loans for meeting the
current and short term cash requirements
Liquidity
2018 2017 Change
Current Current Assets 447 347
6
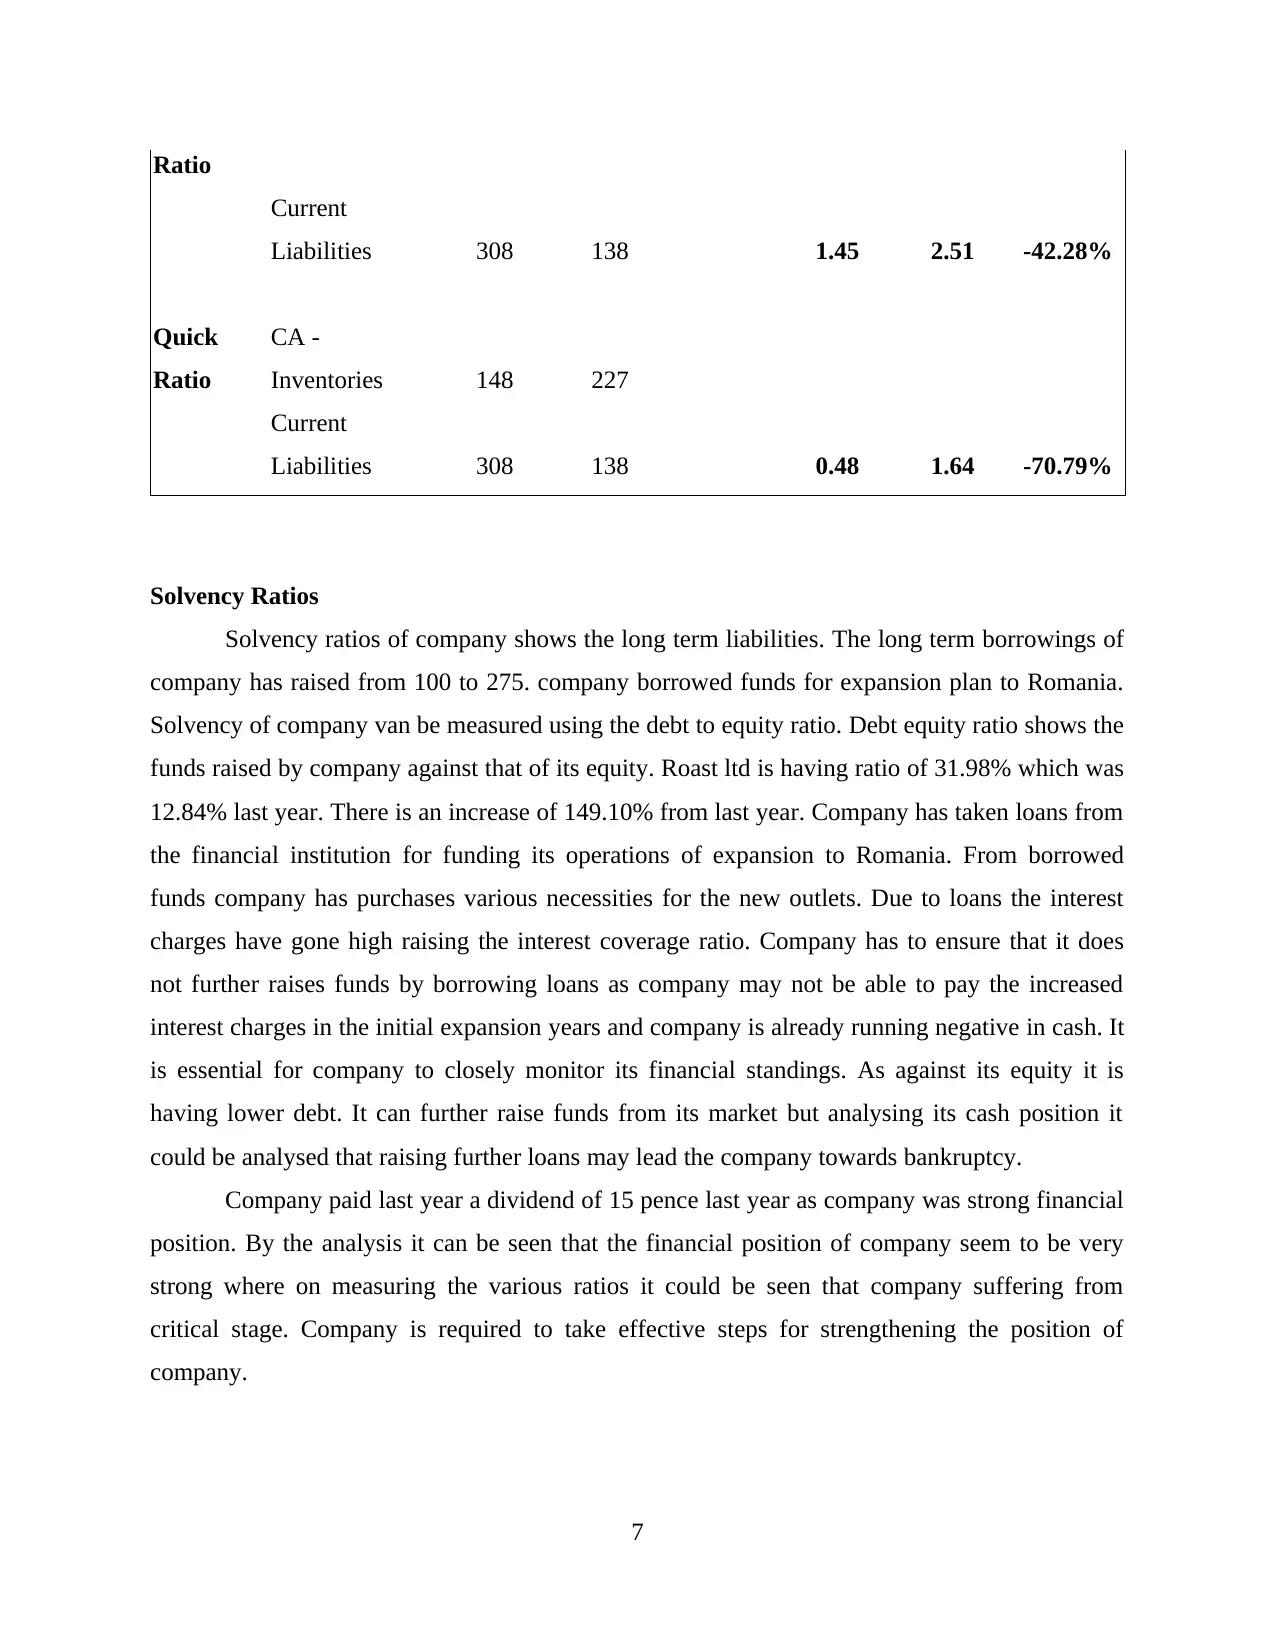
Ratio
Current
Liabilities 308 138 1.45 2.51 -42.28%
Quick
Ratio
CA -
Inventories 148 227
Current
Liabilities 308 138 0.48 1.64 -70.79%
Solvency Ratios
Solvency ratios of company shows the long term liabilities. The long term borrowings of
company has raised from 100 to 275. company borrowed funds for expansion plan to Romania.
Solvency of company van be measured using the debt to equity ratio. Debt equity ratio shows the
funds raised by company against that of its equity. Roast ltd is having ratio of 31.98% which was
12.84% last year. There is an increase of 149.10% from last year. Company has taken loans from
the financial institution for funding its operations of expansion to Romania. From borrowed
funds company has purchases various necessities for the new outlets. Due to loans the interest
charges have gone high raising the interest coverage ratio. Company has to ensure that it does
not further raises funds by borrowing loans as company may not be able to pay the increased
interest charges in the initial expansion years and company is already running negative in cash. It
is essential for company to closely monitor its financial standings. As against its equity it is
having lower debt. It can further raise funds from its market but analysing its cash position it
could be analysed that raising further loans may lead the company towards bankruptcy.
Company paid last year a dividend of 15 pence last year as company was strong financial
position. By the analysis it can be seen that the financial position of company seem to be very
strong where on measuring the various ratios it could be seen that company suffering from
critical stage. Company is required to take effective steps for strengthening the position of
company.
7
Current
Liabilities 308 138 1.45 2.51 -42.28%
Quick
Ratio
CA -
Inventories 148 227
Current
Liabilities 308 138 0.48 1.64 -70.79%
Solvency Ratios
Solvency ratios of company shows the long term liabilities. The long term borrowings of
company has raised from 100 to 275. company borrowed funds for expansion plan to Romania.
Solvency of company van be measured using the debt to equity ratio. Debt equity ratio shows the
funds raised by company against that of its equity. Roast ltd is having ratio of 31.98% which was
12.84% last year. There is an increase of 149.10% from last year. Company has taken loans from
the financial institution for funding its operations of expansion to Romania. From borrowed
funds company has purchases various necessities for the new outlets. Due to loans the interest
charges have gone high raising the interest coverage ratio. Company has to ensure that it does
not further raises funds by borrowing loans as company may not be able to pay the increased
interest charges in the initial expansion years and company is already running negative in cash. It
is essential for company to closely monitor its financial standings. As against its equity it is
having lower debt. It can further raise funds from its market but analysing its cash position it
could be analysed that raising further loans may lead the company towards bankruptcy.
Company paid last year a dividend of 15 pence last year as company was strong financial
position. By the analysis it can be seen that the financial position of company seem to be very
strong where on measuring the various ratios it could be seen that company suffering from
critical stage. Company is required to take effective steps for strengthening the position of
company.
7
⊘ This is a preview!⊘
Do you want full access?
Subscribe today to unlock all pages.
Trusted by 1+ million students worldwide
Solvency
8
8
Paraphrase This Document
Need a fresh take? Get an instant paraphrase of this document with our AI Paraphraser
2018 2017 Change
Debt
/Equity
Interest bearing
debt 275 100
Equity 860 779 31.98% 12.84% 149.10%
Debt
/Equity
Interest bearing
net debt
Equity
* nets off cash
Gearing
Interest bearing
debt 275 100
IBD + Equity 1135 879 24.23% 11.38% 112.97%
Interest
cover
Operating Profit
/(loss) 127 51
Finance costs 26 6 4.88 8.5 -42.53%
Dividend
cover PAT 81 36 0 1.2
Dividend 0 30
Dividend
per share Dividend 0 30
No. of ordinary
shares 200 0.15
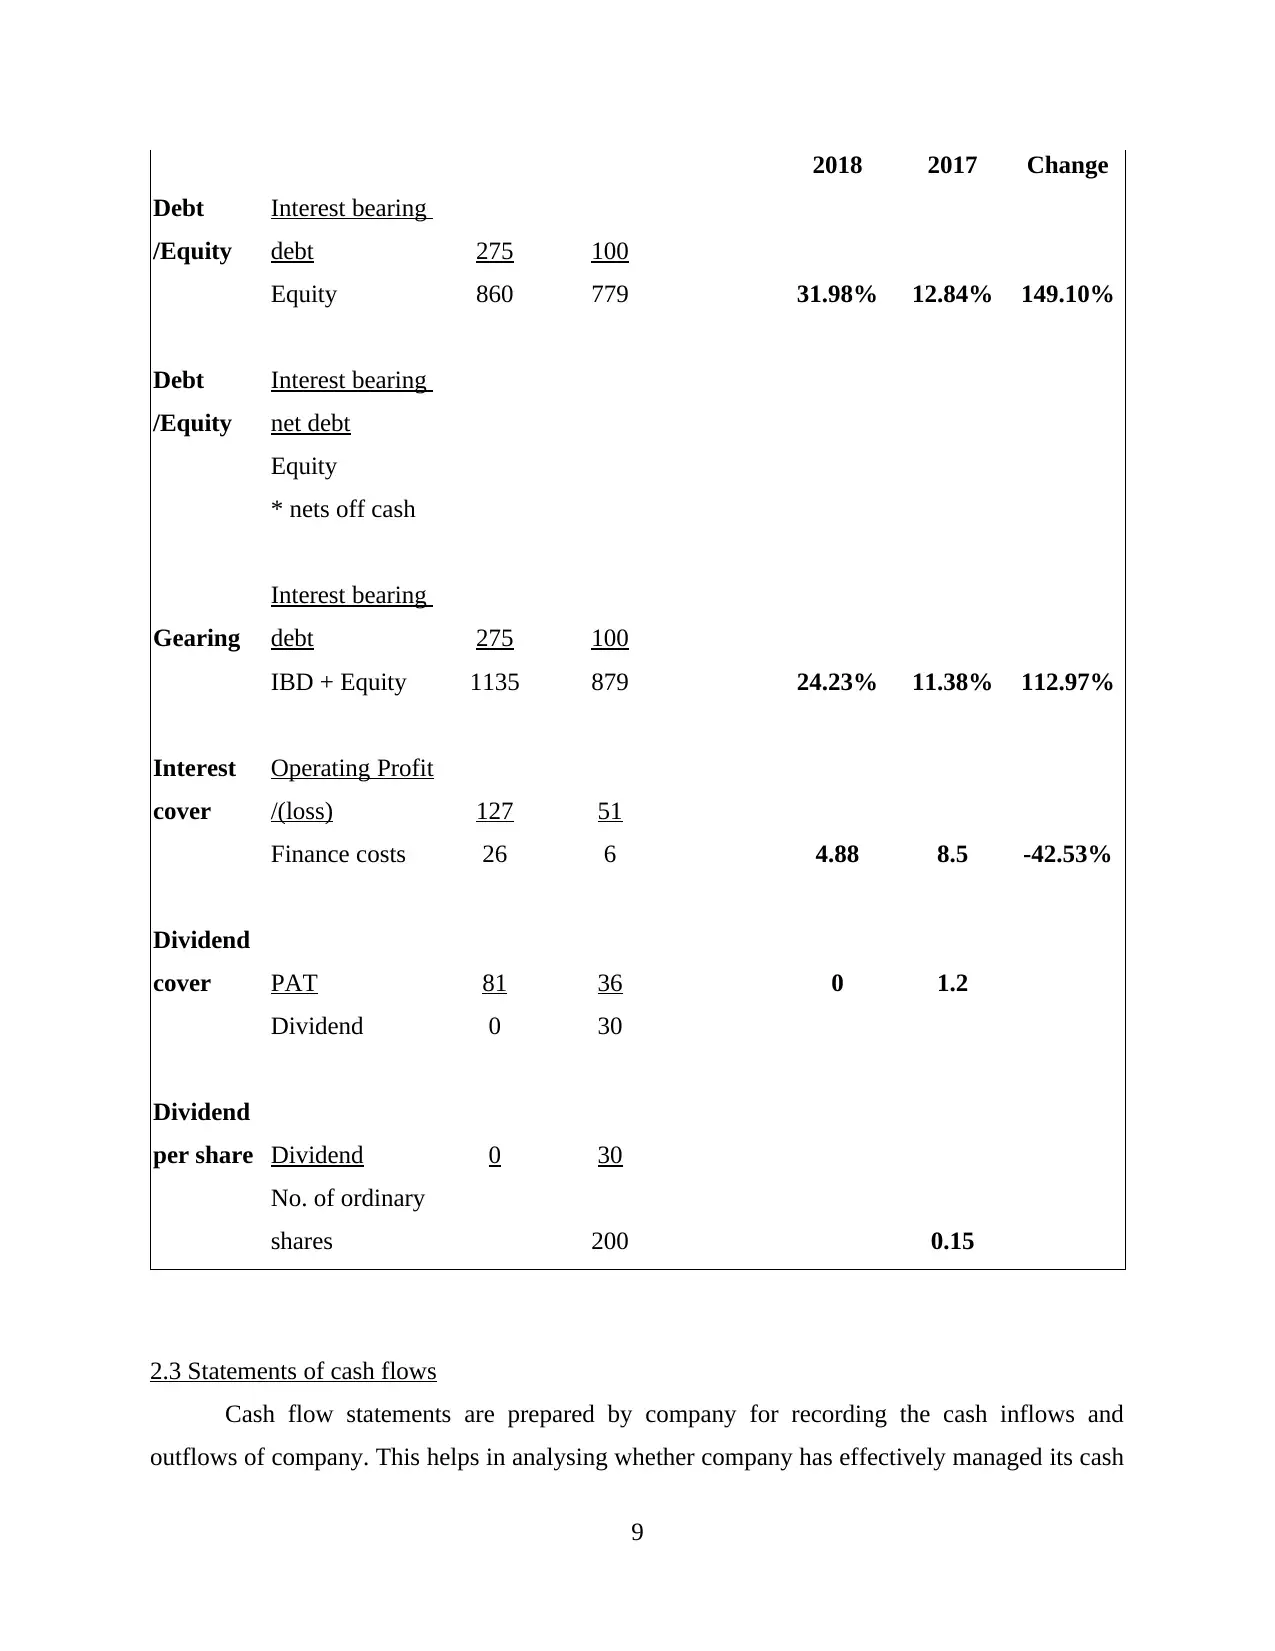
2.3 Statements of cash flows
Cash flow statements are prepared by company for recording the cash inflows and
outflows of company. This helps in analysing whether company has effectively managed its cash
9
Debt
/Equity
Interest bearing
debt 275 100
Equity 860 779 31.98% 12.84% 149.10%
Debt
/Equity
Interest bearing
net debt
Equity
* nets off cash
Gearing
Interest bearing
debt 275 100
IBD + Equity 1135 879 24.23% 11.38% 112.97%
Interest
cover
Operating Profit
/(loss) 127 51
Finance costs 26 6 4.88 8.5 -42.53%
Dividend
cover PAT 81 36 0 1.2
Dividend 0 30
Dividend
per share Dividend 0 30
No. of ordinary
shares 200 0.15
2.3 Statements of cash flows
Cash flow statements are prepared by company for recording the cash inflows and
outflows of company. This helps in analysing whether company has effectively managed its cash
9
requirements. Company must have positive cash flows at the end of the period. Roast at
beginning of year had a positive cash balance of £134. The funds at the beginning were sufficient
for managing the business operations smoothly. Company had a negative cash balance of £24
from operating activities. Operating activities refers to activities performed for running the
business. Company has purchased made bulk purchases this year for expansion plans that raised
the spendings in inventory. Roast ltd had purchased the properties and equipments for the new
coffee outlets in the expansion plans to Romania. This is has acquired significant cash outflow of
company. Purchases were also essential for the business plans but has made the cash balance to
go negative. Cafe had raised funds through external source for funding the operations of
expansion plans. Purchase of equipments and property were partially facilitated byte borrowing
raised through loans. Aggregating the operating, financing and investing activities company
showed a negative cash balance of £73. The negative cash balance portrays very negative image
of company to outsiders. It should be disclosed by company in its disclosures that negative cash
balances are seen due to the above mentioned reasons. Company has to take quick and adequate
measures to turn the cash balances to positive. If company will not be having cash to repay its
loans and interests. This could cause sever concerns even though it is showing positive increase
in profitability.
Working Capital analysis of company
2018 2017 Change
Inventory days 55 29 26
Receivable days 21 17 5
Payables days 43 33 10
Operating Cycle 33 12 21
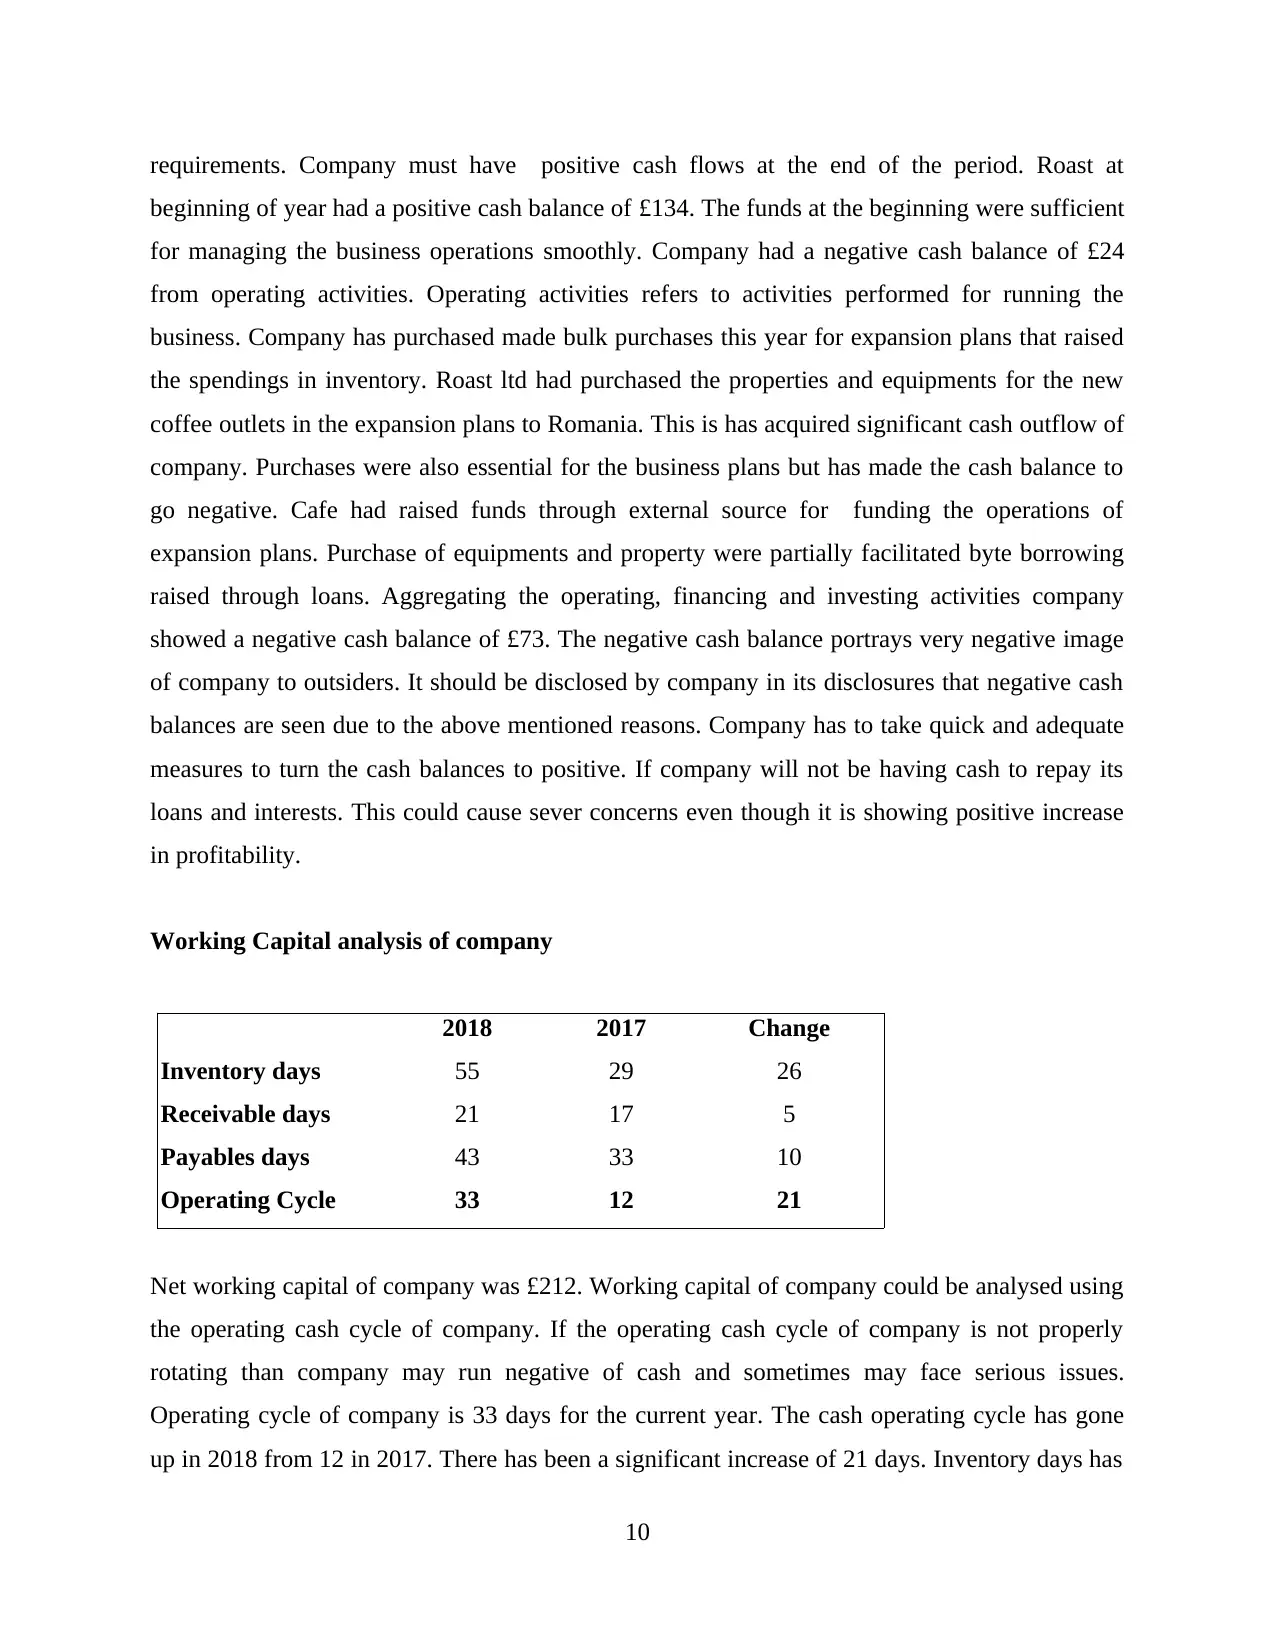
Net working capital of company was £212. Working capital of company could be analysed using
the operating cash cycle of company. If the operating cash cycle of company is not properly
rotating than company may run negative of cash and sometimes may face serious issues.
Operating cycle of company is 33 days for the current year. The cash operating cycle has gone
up in 2018 from 12 in 2017. There has been a significant increase of 21 days. Inventory days has
10
beginning of year had a positive cash balance of £134. The funds at the beginning were sufficient
for managing the business operations smoothly. Company had a negative cash balance of £24
from operating activities. Operating activities refers to activities performed for running the
business. Company has purchased made bulk purchases this year for expansion plans that raised
the spendings in inventory. Roast ltd had purchased the properties and equipments for the new
coffee outlets in the expansion plans to Romania. This is has acquired significant cash outflow of
company. Purchases were also essential for the business plans but has made the cash balance to
go negative. Cafe had raised funds through external source for funding the operations of
expansion plans. Purchase of equipments and property were partially facilitated byte borrowing
raised through loans. Aggregating the operating, financing and investing activities company
showed a negative cash balance of £73. The negative cash balance portrays very negative image
of company to outsiders. It should be disclosed by company in its disclosures that negative cash
balances are seen due to the above mentioned reasons. Company has to take quick and adequate
measures to turn the cash balances to positive. If company will not be having cash to repay its
loans and interests. This could cause sever concerns even though it is showing positive increase
in profitability.
Working Capital analysis of company
2018 2017 Change
Inventory days 55 29 26
Receivable days 21 17 5
Payables days 43 33 10
Operating Cycle 33 12 21
Net working capital of company was £212. Working capital of company could be analysed using
the operating cash cycle of company. If the operating cash cycle of company is not properly
rotating than company may run negative of cash and sometimes may face serious issues.
Operating cycle of company is 33 days for the current year. The cash operating cycle has gone
up in 2018 from 12 in 2017. There has been a significant increase of 21 days. Inventory days has
10
⊘ This is a preview!⊘
Do you want full access?
Subscribe today to unlock all pages.
Trusted by 1+ million students worldwide
1 out of 18
Related Documents


Your All-in-One AI-Powered Toolkit for Academic Success.
+13062052269
info@desklib.com
Available 24*7 on WhatsApp / Email
![[object Object]](/_next/static/media/star-bottom.7253800d.svg)
Unlock your academic potential
Copyright © 2020–2026 A2Z Services. All Rights Reserved. Developed and managed by ZUCOL.