Financial Performance and Investment Appraisal for Roast Ltd.
VerifiedAdded on 2023/01/16
|17
|4840
|62
Report
AI Summary
This report provides a comprehensive financial analysis of Roast Ltd., a UK-based coffee shop company. It begins with an overview of the UK coffee house industry, highlighting its growth and key players. The core of the report analyzes Roast Ltd.'s financial statements, including the profit and loss statement, balance sheet, and cash flow statement for 2017 and 2018. The analysis reveals an increase in revenue and profitability, with detailed examination of factors influencing these changes, such as operational expenses, income sources, and financial ratios. The report also evaluates the company's financial position, examining solvency and liquidity ratios. Finally, the report explores investment appraisal techniques to aid in making informed financing decisions for the company's future growth and expansion.
FINANCIAL DECISION-
MAKING
MAKING
Paraphrase This Document
Need a fresh take? Get an instant paraphrase of this document with our AI Paraphraser
TABLE OF CONTENTS
INTRODUCTION...........................................................................................................................1
MAIN BODY...................................................................................................................................1
CONCLUSION................................................................................................................................1
REFERENCES................................................................................................................................2
EXECUTIVE SUMMARY
The cafes have been an emerging sector in the economy of UK and the ease of operating
these businesses is becoming major attractive point for the company. The current report will
evaluate the existing coffee house market and industry in UK. The financial statements of the
Roast Ltd. Will be analysed and the interpretation of the Profit and loss statement, balance sheet
and the Cash Flow Statement of the company for the year 2017 and 2018 will be compared and
analysed accordingly. The report will also analyse and develop an investment appraisal for the
company so that appropriate decisions can be taken regarding the financing options for the
company. The report will also identify that what is the forecasted growth of the company and the
estimated regarding different figures of the Roast Ltd. will be made in the report. Different
investment appraisal technique will be identified and evaluated in the report where the future
investment financing option will be critically evaluated in the report and the Roast Ltd. Will be
recommended the best strategies that they can adopt in order to finance the company's
investment.
PART 1: INDUSTRY OVERVIEW
Current UK Coffee House Industry
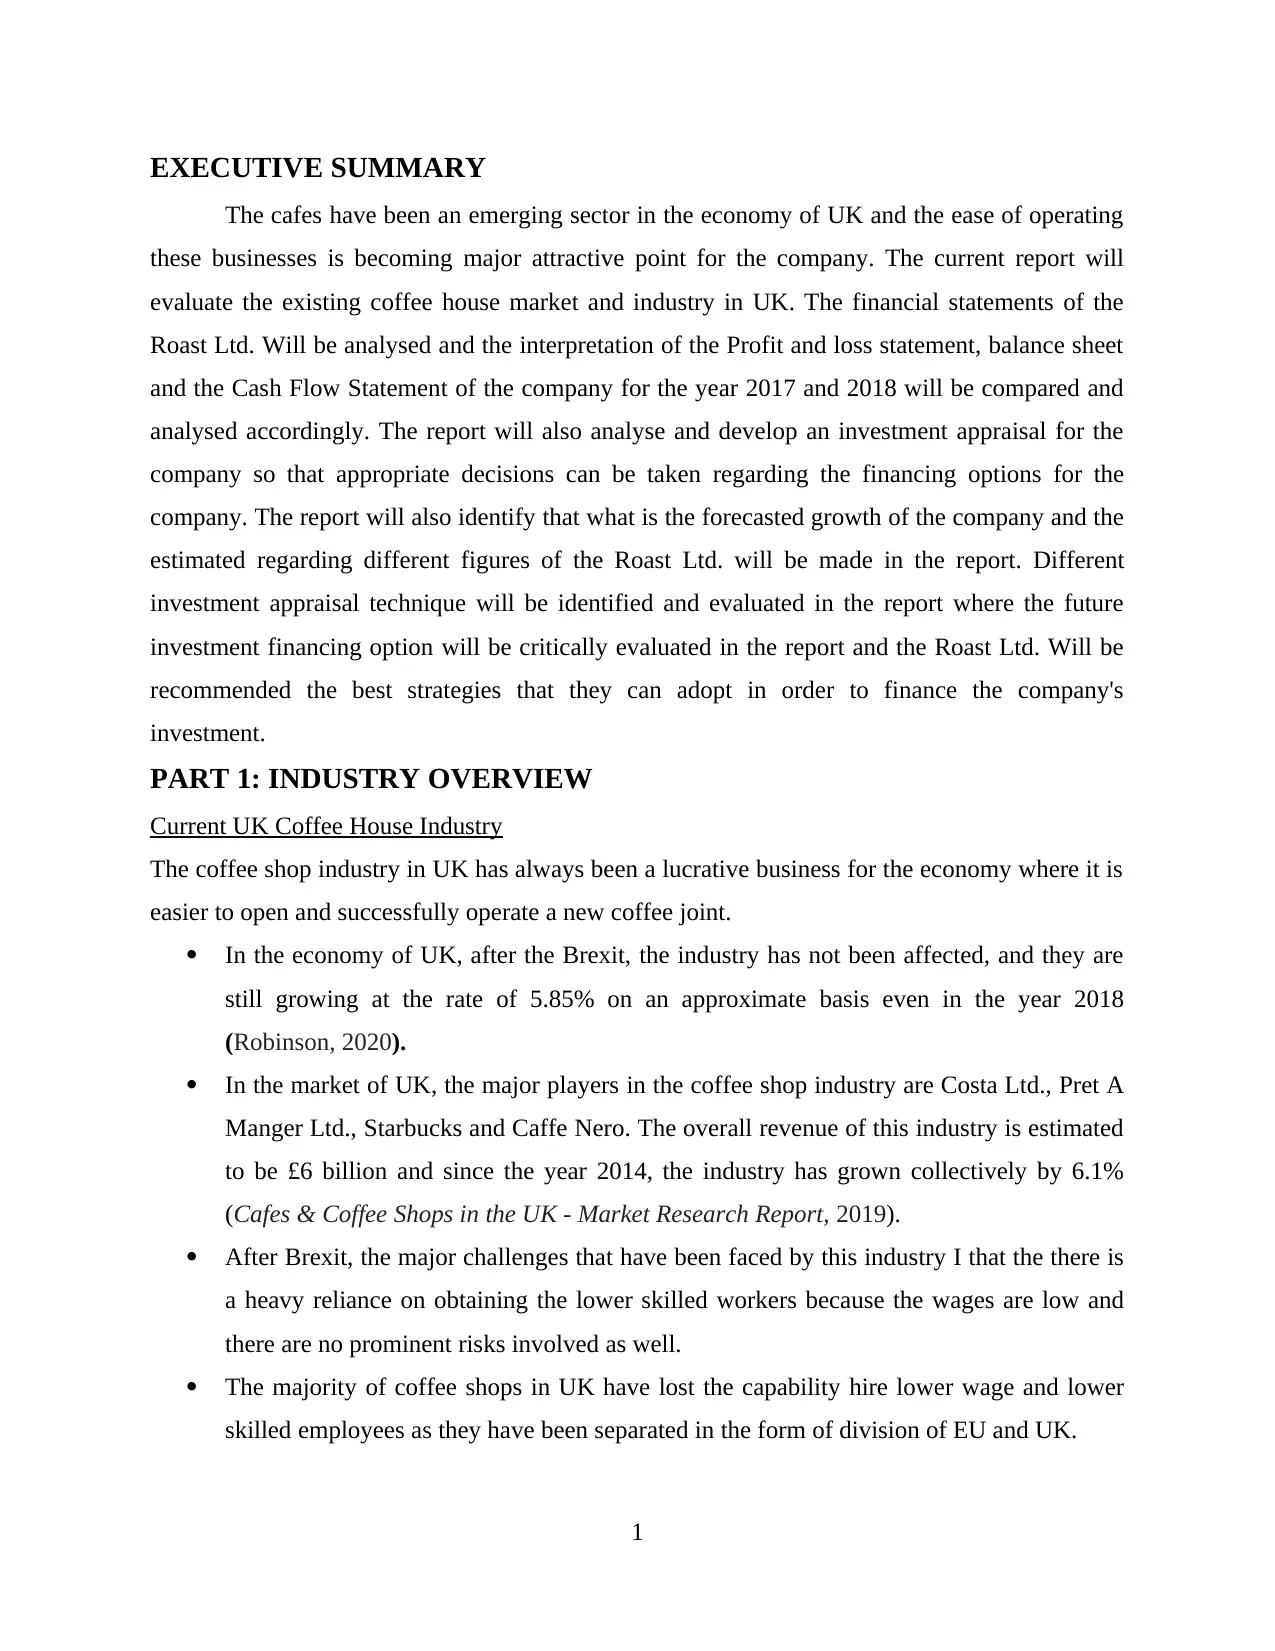
The coffee shop industry in UK has always been a lucrative business for the economy where it is
easier to open and successfully operate a new coffee joint.
In the economy of UK, after the Brexit, the industry has not been affected, and they are
still growing at the rate of 5.85% on an approximate basis even in the year 2018
(Robinson, 2020).
In the market of UK, the major players in the coffee shop industry are Costa Ltd., Pret A
Manger Ltd., Starbucks and Caffe Nero. The overall revenue of this industry is estimated
to be £6 billion and since the year 2014, the industry has grown collectively by 6.1%
(Cafes & Coffee Shops in the UK - Market Research Report, 2019).
After Brexit, the major challenges that have been faced by this industry I that the there is
a heavy reliance on obtaining the lower skilled workers because the wages are low and
there are no prominent risks involved as well.
The majority of coffee shops in UK have lost the capability hire lower wage and lower
skilled employees as they have been separated in the form of division of EU and UK.
1
The cafes have been an emerging sector in the economy of UK and the ease of operating
these businesses is becoming major attractive point for the company. The current report will
evaluate the existing coffee house market and industry in UK. The financial statements of the
Roast Ltd. Will be analysed and the interpretation of the Profit and loss statement, balance sheet
and the Cash Flow Statement of the company for the year 2017 and 2018 will be compared and
analysed accordingly. The report will also analyse and develop an investment appraisal for the
company so that appropriate decisions can be taken regarding the financing options for the
company. The report will also identify that what is the forecasted growth of the company and the
estimated regarding different figures of the Roast Ltd. will be made in the report. Different
investment appraisal technique will be identified and evaluated in the report where the future
investment financing option will be critically evaluated in the report and the Roast Ltd. Will be
recommended the best strategies that they can adopt in order to finance the company's
investment.
PART 1: INDUSTRY OVERVIEW
Current UK Coffee House Industry
The coffee shop industry in UK has always been a lucrative business for the economy where it is
easier to open and successfully operate a new coffee joint.
In the economy of UK, after the Brexit, the industry has not been affected, and they are
still growing at the rate of 5.85% on an approximate basis even in the year 2018
(Robinson, 2020).
In the market of UK, the major players in the coffee shop industry are Costa Ltd., Pret A
Manger Ltd., Starbucks and Caffe Nero. The overall revenue of this industry is estimated
to be £6 billion and since the year 2014, the industry has grown collectively by 6.1%
(Cafes & Coffee Shops in the UK - Market Research Report, 2019).
After Brexit, the major challenges that have been faced by this industry I that the there is
a heavy reliance on obtaining the lower skilled workers because the wages are low and
there are no prominent risks involved as well.
The majority of coffee shops in UK have lost the capability hire lower wage and lower
skilled employees as they have been separated in the form of division of EU and UK.
1
⊘ This is a preview!⊘
Do you want full access?
Subscribe today to unlock all pages.
Trusted by 1+ million students worldwide
Currently, UK is in free trade agreement with the EU where they have developed
negotiated tariffs but as soon as Brexit occurs, it will impact the way the industry is
operating.
Apart from the challenges, there are many opportunities as well for the industry. There is
a high degree of innovative practices that can be adopted in this industry and this is the
most significant benefit that can be generated in the industry. This significantly helps in
the growth of the industry (Eng, Tian and Robert Yu, 2018).
Another major opportunity is that the industry will never face any downward movement
or deflation in the economy and it is a highly prosperous business thus giving wider
access of expansion and development.
PART 2: BUSINESS PERFORMANCE ANALYSIS
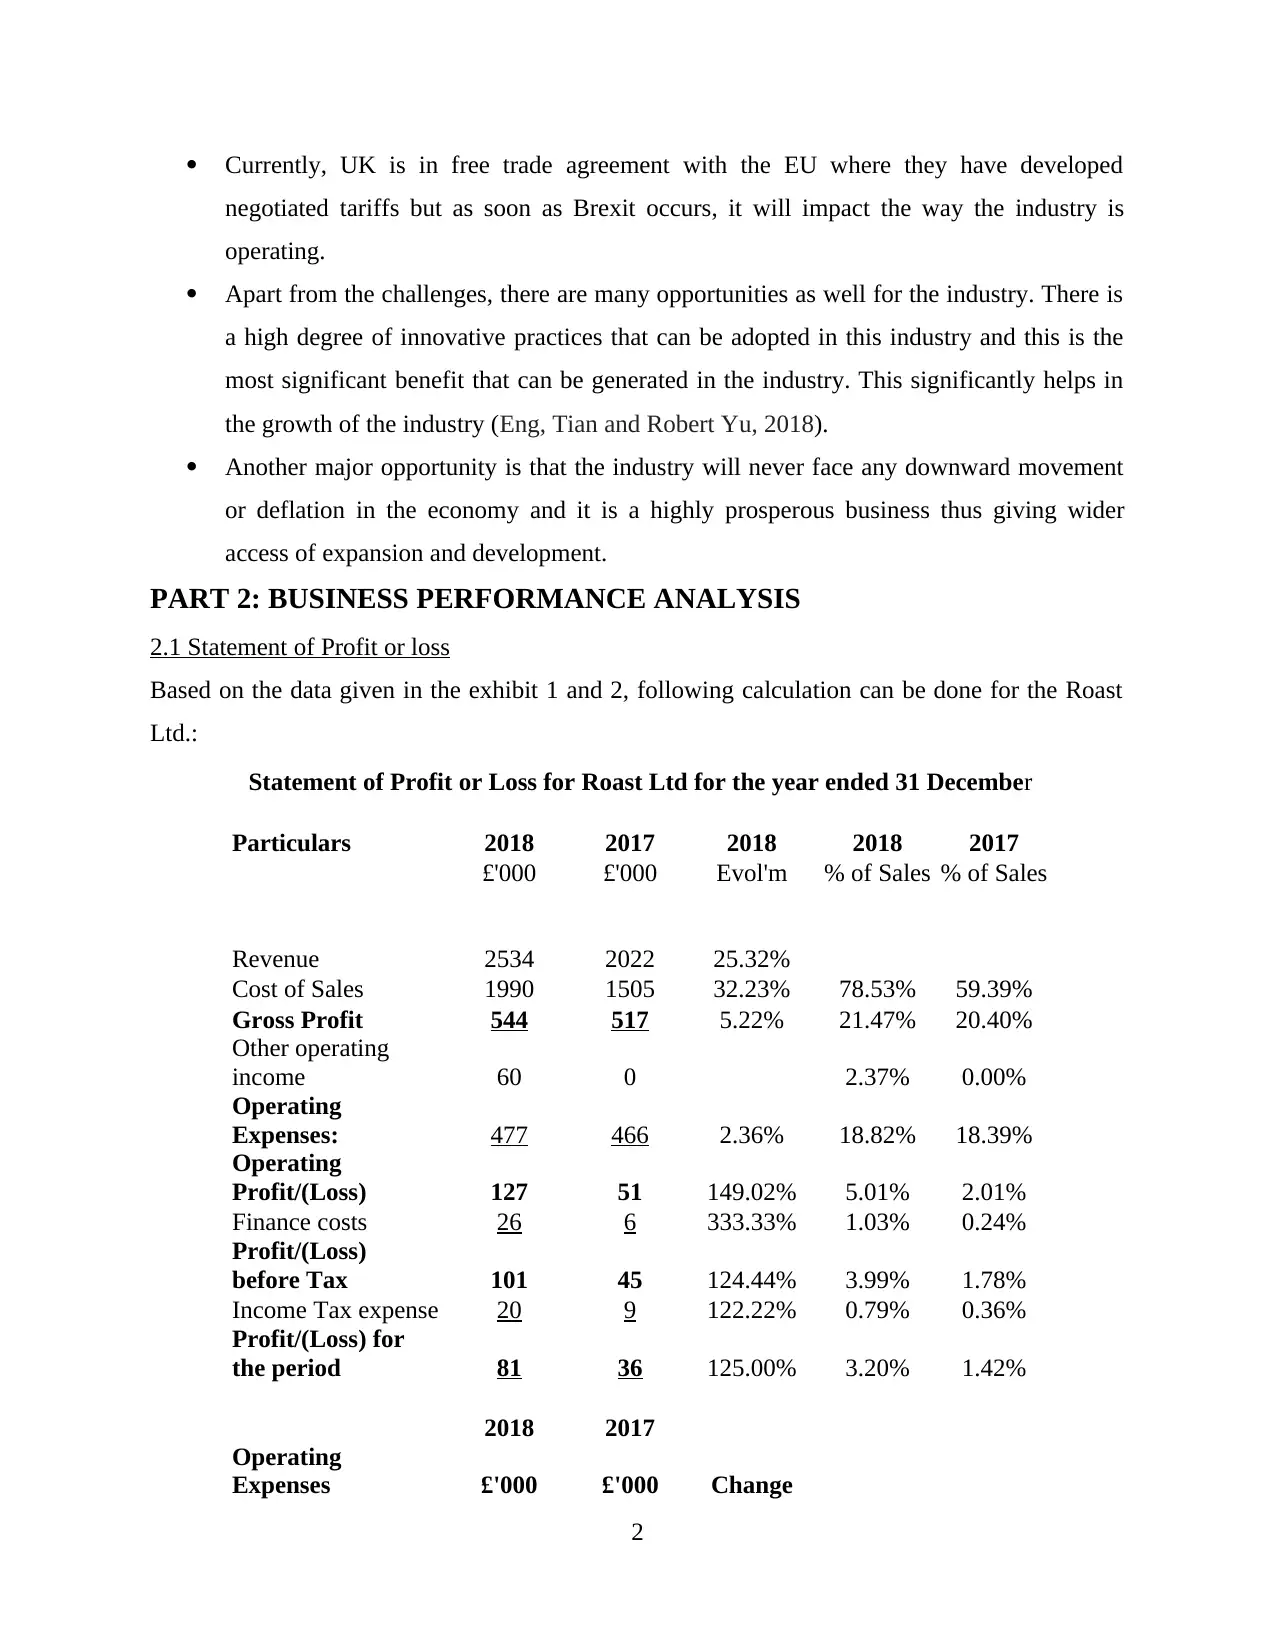
2.1 Statement of Profit or loss
Based on the data given in the exhibit 1 and 2, following calculation can be done for the Roast
Ltd.:
Statement of Profit or Loss for Roast Ltd for the year ended 31 December
Particulars 2018 2017 2018 2018 2017
£'000 £'000 Evol'm % of Sales % of Sales
Revenue 2534 2022 25.32%
Cost of Sales 1990 1505 32.23% 78.53% 59.39%
Gross Profit 544 517 5.22% 21.47% 20.40%
Other operating
income 60 0 2.37% 0.00%
Operating
Expenses: 477 466 2.36% 18.82% 18.39%
Operating
Profit/(Loss) 127 51 149.02% 5.01% 2.01%
Finance costs 26 6 333.33% 1.03% 0.24%
Profit/(Loss)
before Tax 101 45 124.44% 3.99% 1.78%
Income Tax expense 20 9 122.22% 0.79% 0.36%
Profit/(Loss) for
the period 81 36 125.00% 3.20% 1.42%
2018 2017
Operating
Expenses £'000 £'000 Change
2
negotiated tariffs but as soon as Brexit occurs, it will impact the way the industry is
operating.
Apart from the challenges, there are many opportunities as well for the industry. There is
a high degree of innovative practices that can be adopted in this industry and this is the
most significant benefit that can be generated in the industry. This significantly helps in
the growth of the industry (Eng, Tian and Robert Yu, 2018).
Another major opportunity is that the industry will never face any downward movement
or deflation in the economy and it is a highly prosperous business thus giving wider
access of expansion and development.
PART 2: BUSINESS PERFORMANCE ANALYSIS
2.1 Statement of Profit or loss
Based on the data given in the exhibit 1 and 2, following calculation can be done for the Roast
Ltd.:
Statement of Profit or Loss for Roast Ltd for the year ended 31 December
Particulars 2018 2017 2018 2018 2017
£'000 £'000 Evol'm % of Sales % of Sales
Revenue 2534 2022 25.32%
Cost of Sales 1990 1505 32.23% 78.53% 59.39%
Gross Profit 544 517 5.22% 21.47% 20.40%
Other operating
income 60 0 2.37% 0.00%
Operating
Expenses: 477 466 2.36% 18.82% 18.39%
Operating
Profit/(Loss) 127 51 149.02% 5.01% 2.01%
Finance costs 26 6 333.33% 1.03% 0.24%
Profit/(Loss)
before Tax 101 45 124.44% 3.99% 1.78%
Income Tax expense 20 9 122.22% 0.79% 0.36%
Profit/(Loss) for
the period 81 36 125.00% 3.20% 1.42%
2018 2017
Operating
Expenses £'000 £'000 Change
2
Paraphrase This Document
Need a fresh take? Get an instant paraphrase of this document with our AI Paraphraser
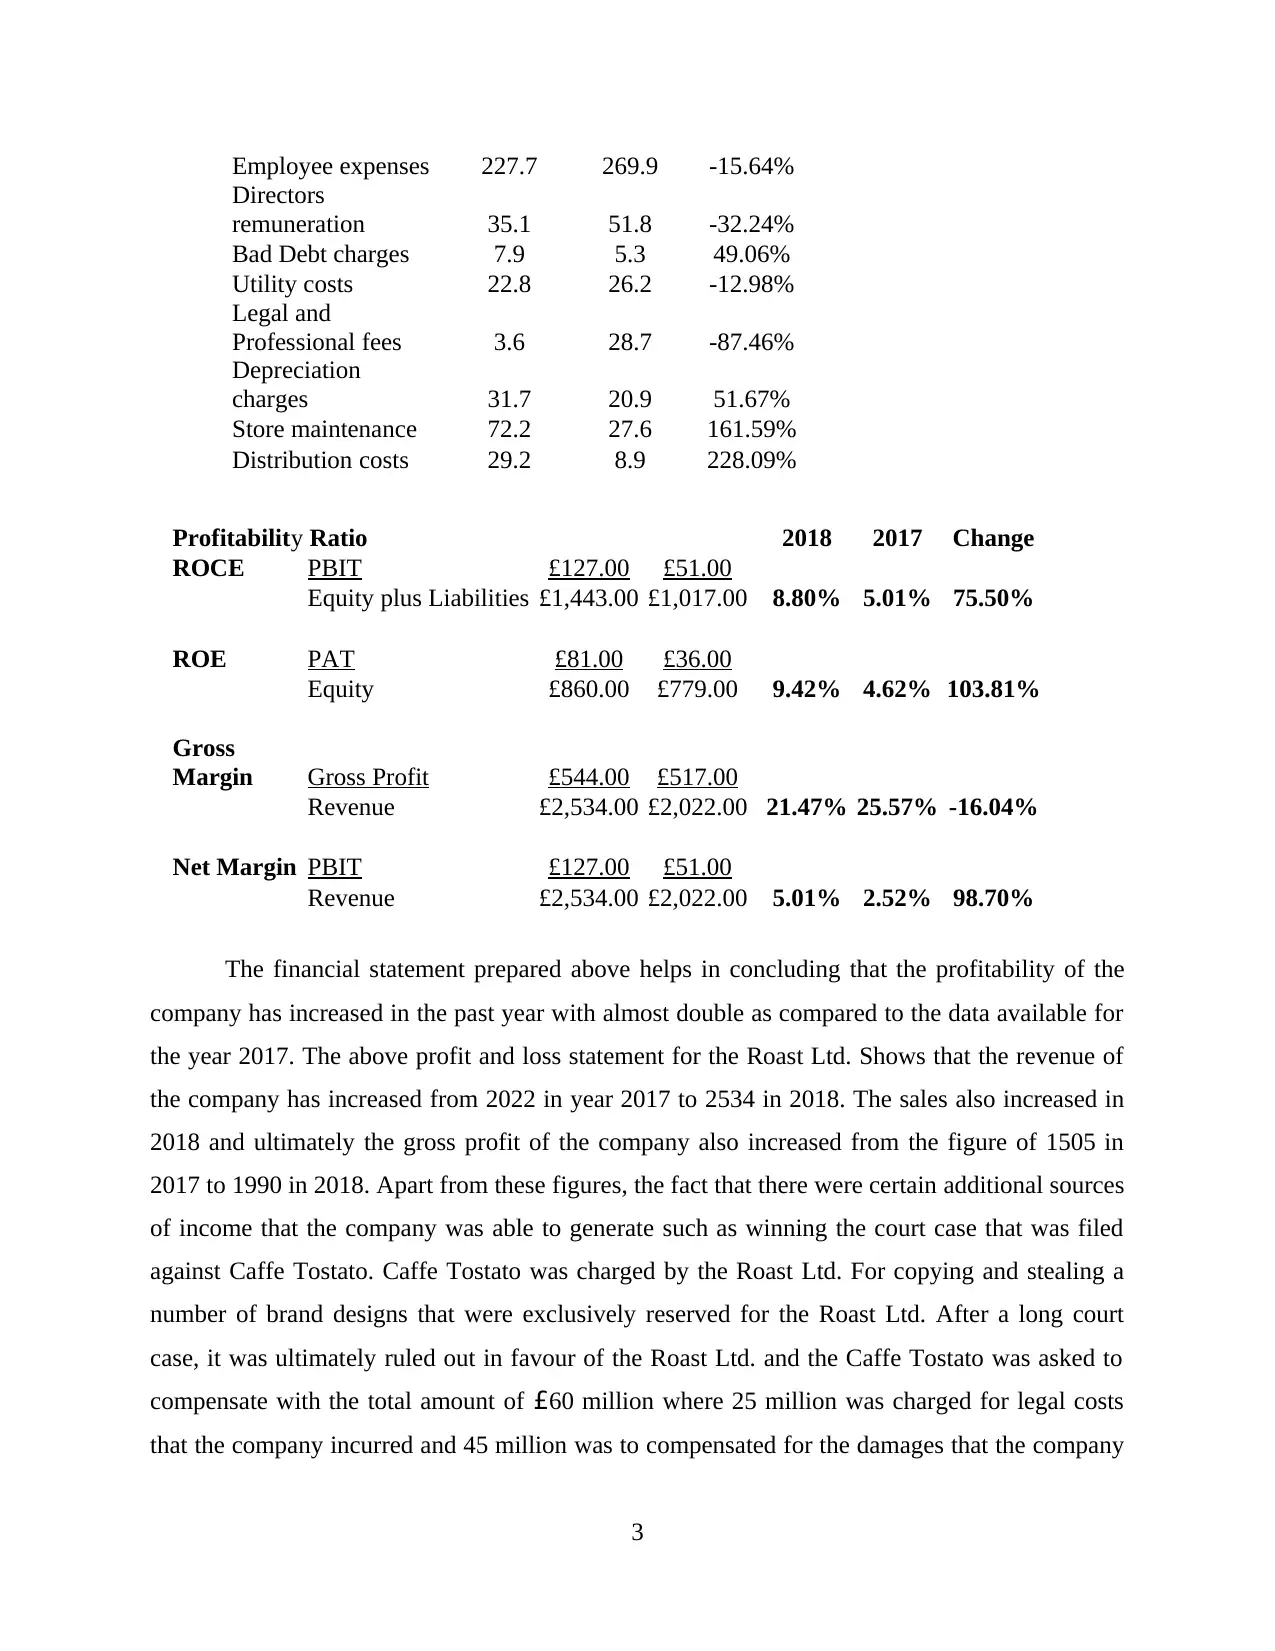
Employee expenses 227.7 269.9 -15.64%
Directors
remuneration 35.1 51.8 -32.24%
Bad Debt charges 7.9 5.3 49.06%
Utility costs 22.8 26.2 -12.98%
Legal and
Professional fees 3.6 28.7 -87.46%
Depreciation
charges 31.7 20.9 51.67%
Store maintenance 72.2 27.6 161.59%
Distribution costs 29.2 8.9 228.09%
Profitability Ratio 2018 2017 Change
ROCE PBIT £127.00 £51.00
Equity plus Liabilities £1,443.00 £1,017.00 8.80% 5.01% 75.50%
ROE PAT £81.00 £36.00
Equity £860.00 £779.00 9.42% 4.62% 103.81%
Gross
Margin Gross Profit £544.00 £517.00
Revenue £2,534.00 £2,022.00 21.47% 25.57% -16.04%
Net Margin PBIT £127.00 £51.00
Revenue £2,534.00 £2,022.00 5.01% 2.52% 98.70%
The financial statement prepared above helps in concluding that the profitability of the
company has increased in the past year with almost double as compared to the data available for
the year 2017. The above profit and loss statement for the Roast Ltd. Shows that the revenue of
the company has increased from 2022 in year 2017 to 2534 in 2018. The sales also increased in
2018 and ultimately the gross profit of the company also increased from the figure of 1505 in
2017 to 1990 in 2018. Apart from these figures, the fact that there were certain additional sources
of income that the company was able to generate such as winning the court case that was filed
against Caffe Tostato. Caffe Tostato was charged by the Roast Ltd. For copying and stealing a
number of brand designs that were exclusively reserved for the Roast Ltd. After a long court
case, it was ultimately ruled out in favour of the Roast Ltd. and the Caffe Tostato was asked to
compensate with the total amount of £60 million where 25 million was charged for legal costs
that the company incurred and 45 million was to compensated for the damages that the company
3
incurred. This was added in the operating income of the company in the year 2018 whereas, there
was no such operating income in the year 2017.
It can also be stated that other than the major source of operating income that the Roast
Ltd. Was able to earn in the year 2018. This mainly consists of the remuneration that the
company was able to save in the 2018 in the form of both employees salary and the remuneration
of the directors (Arif, Noor-E-Jannat and Anwar, 2016). The employees of the company reduced
from 20 in the support workforce to 13 employees and it was found that role of marketing and
HR director as well as Non-executive director was removed thus reducing the cost of director's
remuneration in the year 2018. This was also another additional factor in the increase of the
profitability in the year 2018 as compared to the year 2017 where it resulted in the positive
balance of the company. However, everything was not just incoming in the year 2018 because
there were certain expenditures as well that the company incurred in the year 2018. There were
certain costumers of the company i.e. one major customer who was experiencing some
difficulties in the cash flows of his business. It was requested that the payment period on the
sales be increased from the earlier period of 30 days to the 90 day period. This increase in the
period led to the increase in the bad debts charges of the company thus increasing the operating
expenses as well in the year 2018 (Mohanram Saiy and Vyas, 2018). The above analysis can be
used to day that there were some major changes that took place in the company in the year 2018
and all of these collectively led to the increase in revenue of the company.
The profitability ratios of the company increased significantly in the past year where the
ROE increased by 103% from year 2017 to 2018 and ROCE increased by 75.5% in 2018.
Although the gross margin of the company declined by 16% but due to certain income sources
that were described above, the net margin of the company increased by 98% approximately.
2.2 Statement of Financial position
The data provided in the exhibit 1and 2 regarding the position and financial statements of
the Roast Ltd. Company, it can be adequately used to analyse the financial position of the
company. The data given regarding the balance sheet of the company can be used to analyse the
company's data and develop solvency ratio (Ahmed and Safdar, 2018). These solvency ratios
will further assist in evaluating the financial position of the company and its performance level
and the liquidity ratio will determine that whether the company is able to repay it debt timely and
whether the position of the company is strong or not:
4
⊘ This is a preview!⊘
Do you want full access?
Subscribe today to unlock all pages.
Trusted by 1+ million students worldwide

Solvency Ratio
5
5
Paraphrase This Document
Need a fresh take? Get an instant paraphrase of this document with our AI Paraphraser
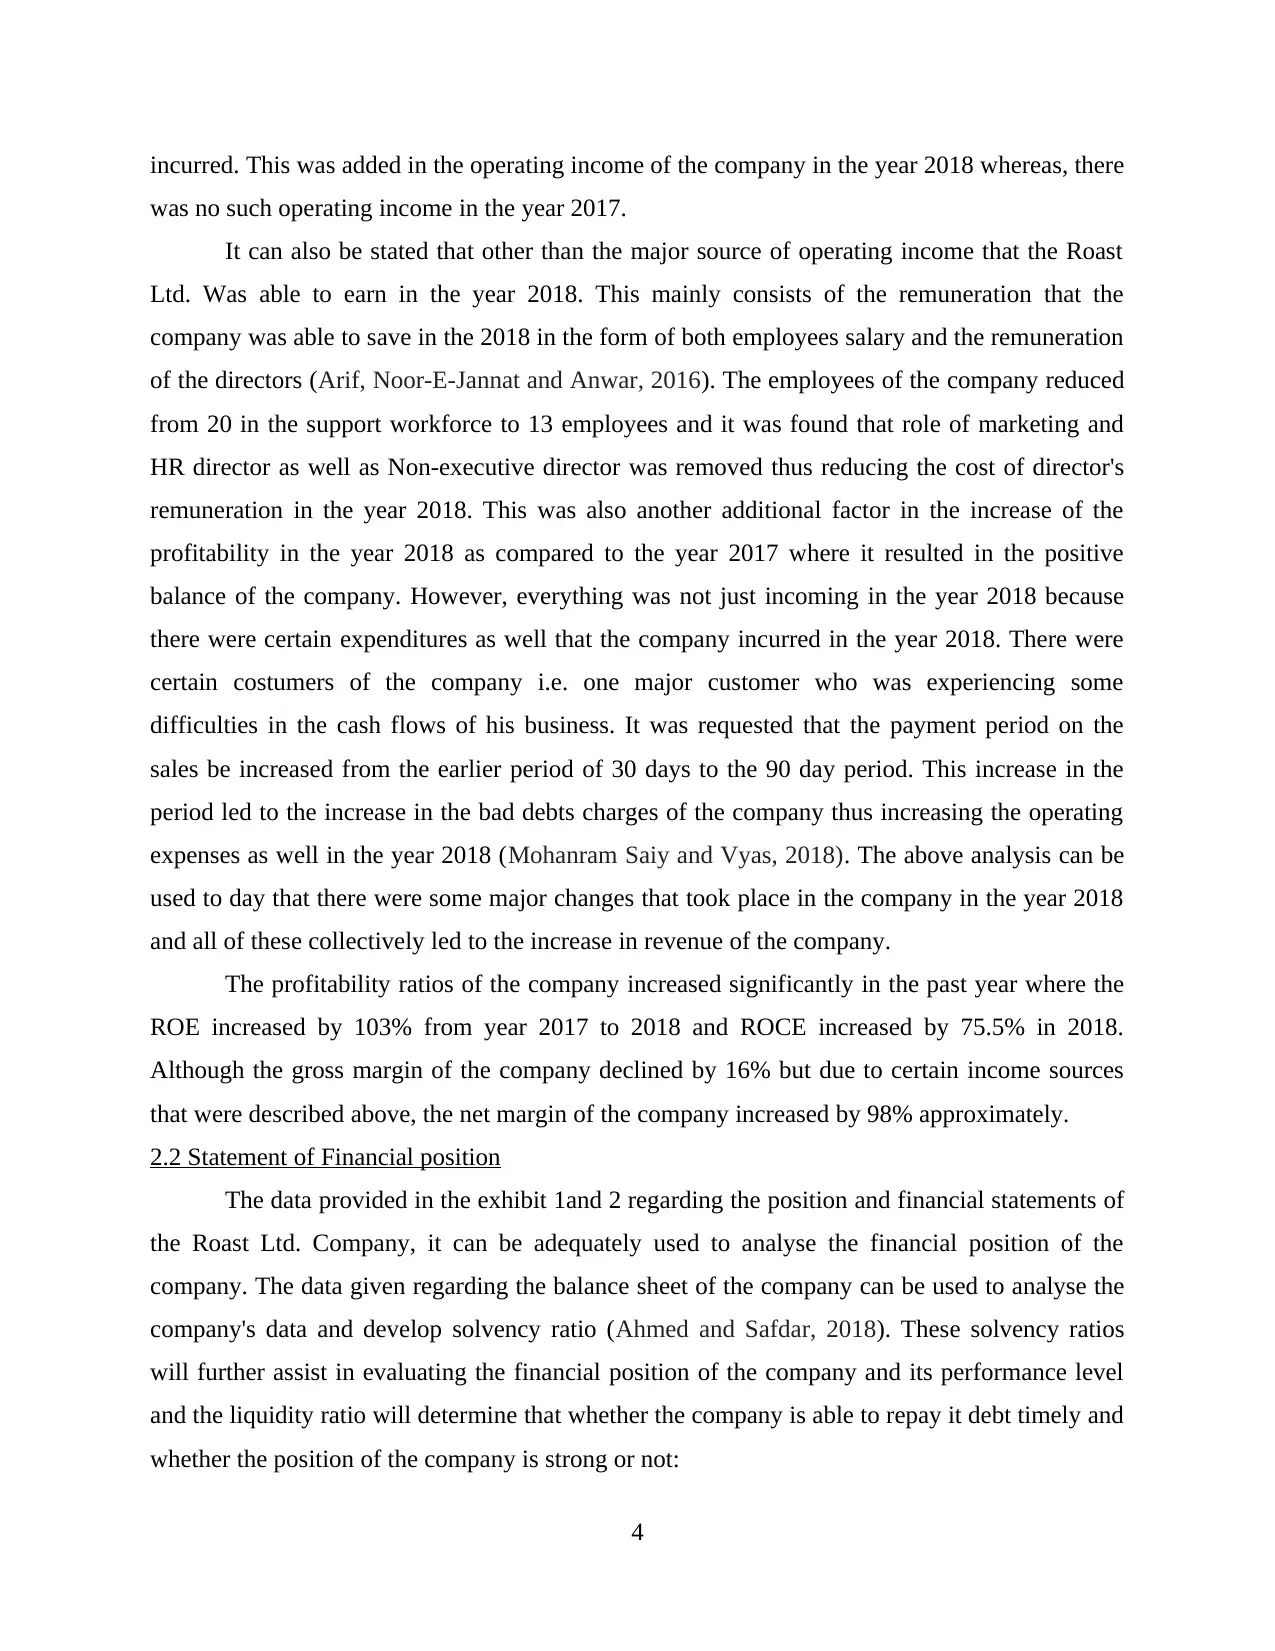
2018 2017 Change
Debt
/Equity Interest bearing debt 275 100
Equity 860 779 31.98% 12.84% 149.10%
Debt
/Equity Interest bearing net debt
Equity
* nets off cash
Gearing Interest bearing debt 275 100
IBD + Equity 1135 879 24.23% 11.38% 112.97%
Interest
cover Operating Profit /(loss) 127 51
Finance costs 26 6 4.88 8.5 -42.53%
Dividen
d cover PAT 81 36 0 1.2
Dividend 0 30
Dividen
d per
share Dividend 0 30
No. of ordinary shares 200 0.15
Liquidity Ratio
2018 2017 Change
Current
Ratio Current Assets 447 347
Current
Liabilities 308 138 1.45 2.51 -42.28%
Quick
Ratio CA - Inventories 148 227
Current
Liabilities 308 138 0.48 1.64 -70.79%
The analysis of the balance sheet of the Roast Ltd. for the year 2017 and year 2018 shows that
the assets and liabilities of the company have increased significantly from the year 2017 to the
year 2018 and therefore, it can be interpreted that the fixed assets of the company as well as the
current assets both have increased for the company. Although the cash equivalent of the
company has become zero, it shows that company has started to deal mostly on the credit basis
6
Debt
/Equity Interest bearing debt 275 100
Equity 860 779 31.98% 12.84% 149.10%
Debt
/Equity Interest bearing net debt
Equity
* nets off cash
Gearing Interest bearing debt 275 100
IBD + Equity 1135 879 24.23% 11.38% 112.97%
Interest
cover Operating Profit /(loss) 127 51
Finance costs 26 6 4.88 8.5 -42.53%
Dividen
d cover PAT 81 36 0 1.2
Dividend 0 30
Dividen
d per
share Dividend 0 30
No. of ordinary shares 200 0.15
Liquidity Ratio
2018 2017 Change
Current
Ratio Current Assets 447 347
Current
Liabilities 308 138 1.45 2.51 -42.28%
Quick
Ratio CA - Inventories 148 227
Current
Liabilities 308 138 0.48 1.64 -70.79%
The analysis of the balance sheet of the Roast Ltd. for the year 2017 and year 2018 shows that
the assets and liabilities of the company have increased significantly from the year 2017 to the
year 2018 and therefore, it can be interpreted that the fixed assets of the company as well as the
current assets both have increased for the company. Although the cash equivalent of the
company has become zero, it shows that company has started to deal mostly on the credit basis
6
(Kaur, 2018). The retained earnings of the company has also increased and this can be majorly
credited to the fact that the dividends that are to be paid to the shareholders of the company has
become 0 in the year 2018 as compared to the amount of 30 million in the year 2017. The long
term borrowings of the company have also increased from the year 2017 and this can be used to
show that the proposal of giving loan to the company by the Finan Ltd. might get accepted
because the debt financing increase shows that the company is being trusted by other financiers
as well.
Apart from this, the solvency and the liquidity ratios that were calculated above can be
used to interpret that from the year 2017 to the year 218, the overall solvency of the company has
improved drastically. The debt to equity ratio of the company has increased by approximately
150% showing that the debt financing in the company has increased in the past year i.e. the
goodwill of the company has increased in the market. The gearing ratio has also increased of the
company from 11.38% in 2017 to 24.23% in 2018. However, the interest cover was found to
have declined in the company and the dividend ratio turned zero because the company decided to
restructure the company which might not be the best move (Monahan, 2018). It is becoming
increasingly dependent on the debt financial only and this can affect the company negatively as
well because the risk factor increases.
Therefore, it can be concluded that the financial position of the company has increased
and the company has started to become successful but the dependency on the debt financing has
also increased and owing to the market risk factors this might turn out to be a redundant move.
2.3 Statement of Cash Flows
The cash flow given in the Exhibit 1 can be used to state that the cash inflow in the Roast
Ltd. Has significantly dwindled in the past year when in the beginning of the year the cash and
cash equivalents were equal to the 134 million in the beginning of 2017 and due to all the
operating, financing and investment expenditures, the revenue of the cash flow has dwindled
(Dicle and Meyer, 2018). The cash flow form the operating activities was negative in the year
2018 by the amount of negative 24 million. This was mainly due to the increase in the interest
and income taxes that were paid the amount of negative 24 million and the investing activity was
also negative in terms of cash inflow since there was increased investment in the fixed assets of
the company by a negative outflow of 358 million.
7
⊘ This is a preview!⊘
Do you want full access?
Subscribe today to unlock all pages.
Trusted by 1+ million students worldwide
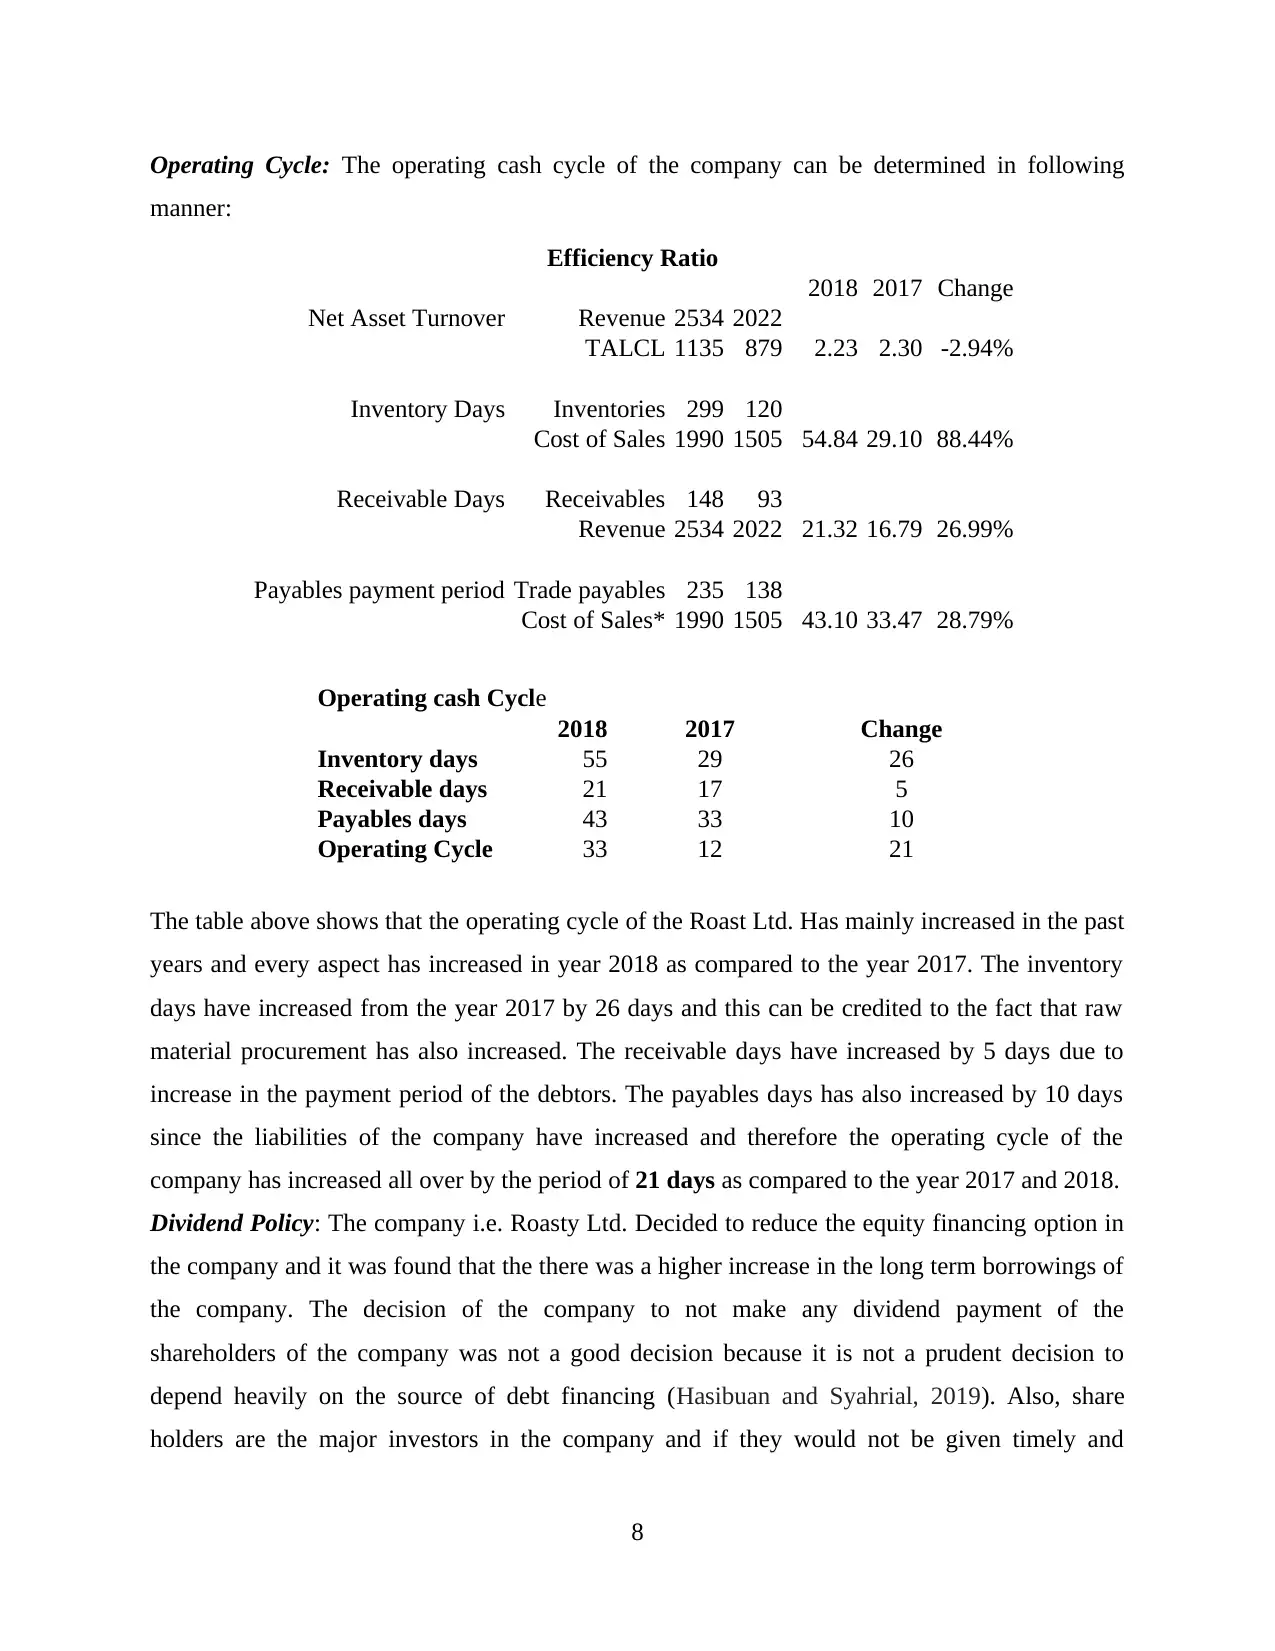
Operating Cycle: The operating cash cycle of the company can be determined in following
manner:
Efficiency Ratio
2018 2017 Change
Net Asset Turnover Revenue 2534 2022
TALCL 1135 879 2.23 2.30 -2.94%
Inventory Days Inventories 299 120
Cost of Sales 1990 1505 54.84 29.10 88.44%
Receivable Days Receivables 148 93
Revenue 2534 2022 21.32 16.79 26.99%
Payables payment period Trade payables 235 138
Cost of Sales* 1990 1505 43.10 33.47 28.79%
Operating cash Cycle
2018 2017 Change
Inventory days 55 29 26
Receivable days 21 17 5
Payables days 43 33 10
Operating Cycle 33 12 21
The table above shows that the operating cycle of the Roast Ltd. Has mainly increased in the past
years and every aspect has increased in year 2018 as compared to the year 2017. The inventory
days have increased from the year 2017 by 26 days and this can be credited to the fact that raw
material procurement has also increased. The receivable days have increased by 5 days due to
increase in the payment period of the debtors. The payables days has also increased by 10 days
since the liabilities of the company have increased and therefore the operating cycle of the
company has increased all over by the period of 21 days as compared to the year 2017 and 2018.
Dividend Policy: The company i.e. Roasty Ltd. Decided to reduce the equity financing option in
the company and it was found that the there was a higher increase in the long term borrowings of
the company. The decision of the company to not make any dividend payment of the
shareholders of the company was not a good decision because it is not a prudent decision to
depend heavily on the source of debt financing (Hasibuan and Syahrial, 2019). Also, share
holders are the major investors in the company and if they would not be given timely and
8
Paraphrase This Document
Need a fresh take? Get an instant paraphrase of this document with our AI Paraphraser
adequate dividend from the profits of the company, then it would affect the performance and
goodwill of the company negatively.
PART 3 : INVESTMENT APPRAISAL
3.1.a Management Forecast
Roast ltd is running the business of coffee from 2008 in UK. It is an Coffee house chain
that is serving the market with different coffee taste. It has created a considerable customer and
developed recognition in he market using the marketing strategies. These marketing strategies
have been successful and helped it to gain competitive advantage. Company has been offering
something new to the market since from the beginning and developed high preference among
the customers. The business is a family business inspired by the Italian heritage. Company is
famous for using the Italian technology in its coffee machines. The opening of the new coffee
chains have been successful for the company and it had successfully attained the desired targets
with slow initial growth (Kengatharan and Nurullah, 2018). Company seeing its demand has
planned to expand its business over new areas and has established the business in Romania. For
the business before expanding to the new areas have to identify the viability and other factors
that may affect the business.
Roast ltd for the expansion is proposing to acquire share in the manufacturer of coffee
machines. To acquire the share it is requiring the initial investment of 400 million pounds. It is
significant investment and should be assessed before the funds are invested in he project.
Acquiring share in coffee manufacturer. This will make the coffee machines available to the
company at reasonable cost that will help in reducing the costs of coffee. This will also help
company in generating two way income. One from the sale of machines and other from the
coffee outlets in Romania. Income from double sources will help it to stabilise as well in
supporting the business in its initial years. If company do not check the profitability of the
project before investment it may have to suffer losses which may also affect its current coffee
business.
Management has forecasted the cash flows for next five years from the adoption of the
project. New project will have the cash inflows after covering its variable costs of £60, £112,
£148, £180 and £224. The cash flows from the project seems to be adequate as company will
achieve effectiveness in controlling the operational cost of running the business as well as diect
cost associated with processing of coffee. Management has used the techniques of capital
9
budgeting for analysing the acceptability of the project. This techniques are used widely by the
businesses before investing their funds in the project. Payback period, NPV of the project and
ARR has been used by the company so that project proves to be successful (Jibril and Jagun,
2018). These have shown positive outcomes for the project. The project will be accepted by the
management as it is going positive results in methods used. If the cash flows are not positive and
not adequate than the project would have been rejected by the enterprise without checking
further the investment methods. The project should be adopted as the estimated cash flows will
recovered the cost as well as also help it to spread roots in new business.
3.1.b Investment Appraisal Techniques
Pay back Period
It is an investment appraisal technique used for assessing whether a project should be
adopted or not. Payback period is used for determining the amount of time that is required by the
project for recovering its initial investment. In other words it is a method that is used for
calculating the time required for earning back the cost incurred in investment through cash
inflows. It is also the break even point after which the investments starts earning profits. In the
given case company has will be able to recover the cost in 4 years. Period is not very much
longer as the cost of investment is high (Mahmoud, 2016). It takes time to recover the cost of
investment. Project as per the pay back period should be adopted by the company. The
advantages and disadvantages are
Advantages
This method is easy and simple to calculate as well as to understand.
Method analyses the risks associated with investments in terms of time.
Beneficial for the sectors where the investment tend to become obsolete in shorter time. Liquidity of the project is also measured by this method.
Disadvantages
This method do not consider the time value of money concept.
Cash flows generated after the payback period are not taken into account by this method.
It do not consider other factors that may affect the project.
Accounting Rate of Return
10
⊘ This is a preview!⊘
Do you want full access?
Subscribe today to unlock all pages.
Trusted by 1+ million students worldwide
1 out of 17
Related Documents


Your All-in-One AI-Powered Toolkit for Academic Success.
+13062052269
info@desklib.com
Available 24*7 on WhatsApp / Email
![[object Object]](/_next/static/media/star-bottom.7253800d.svg)
Unlock your academic potential
Copyright © 2020–2026 A2Z Services. All Rights Reserved. Developed and managed by ZUCOL.