Comprehensive Energy Audit & Recommendations for Rocky Mines

Verified

Added on  2023/06/11

|17
|3125
|120
Report
AI Summary
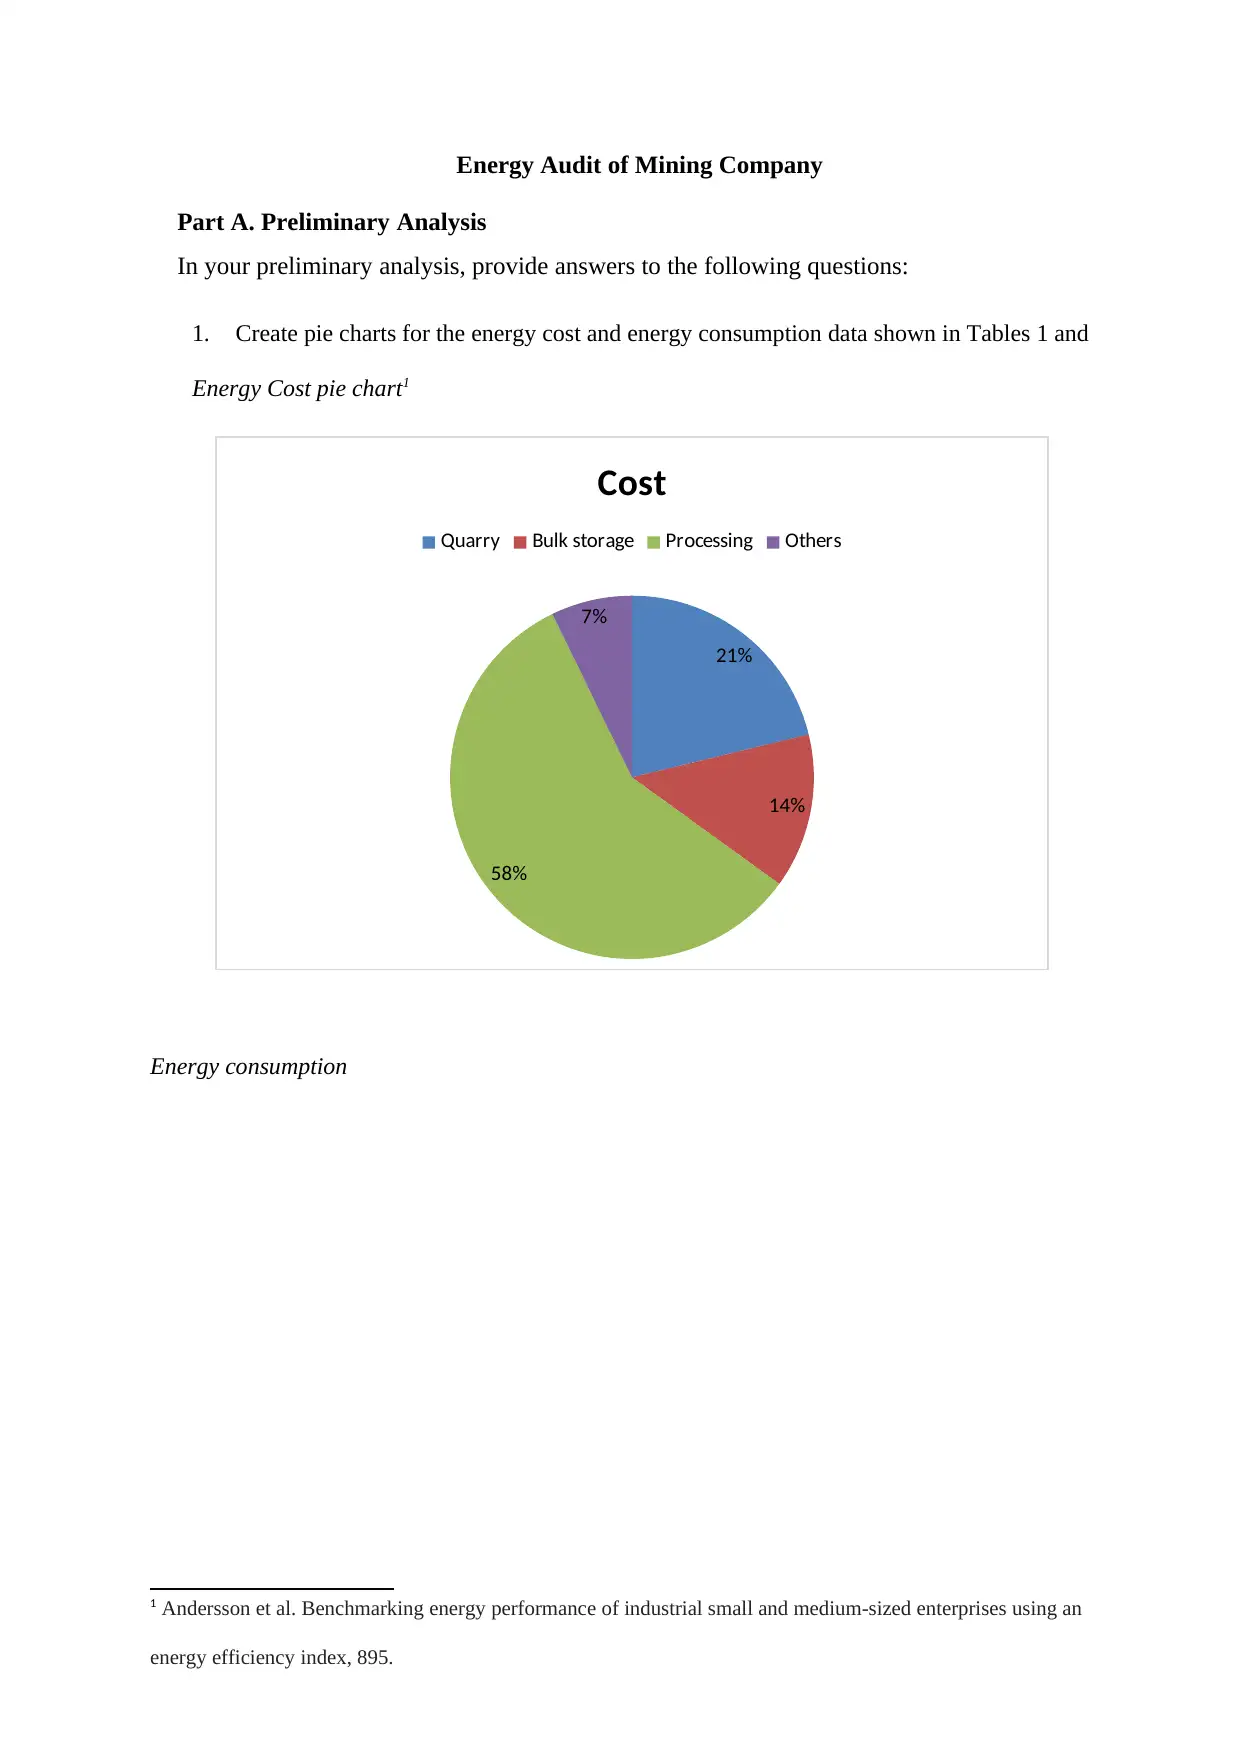
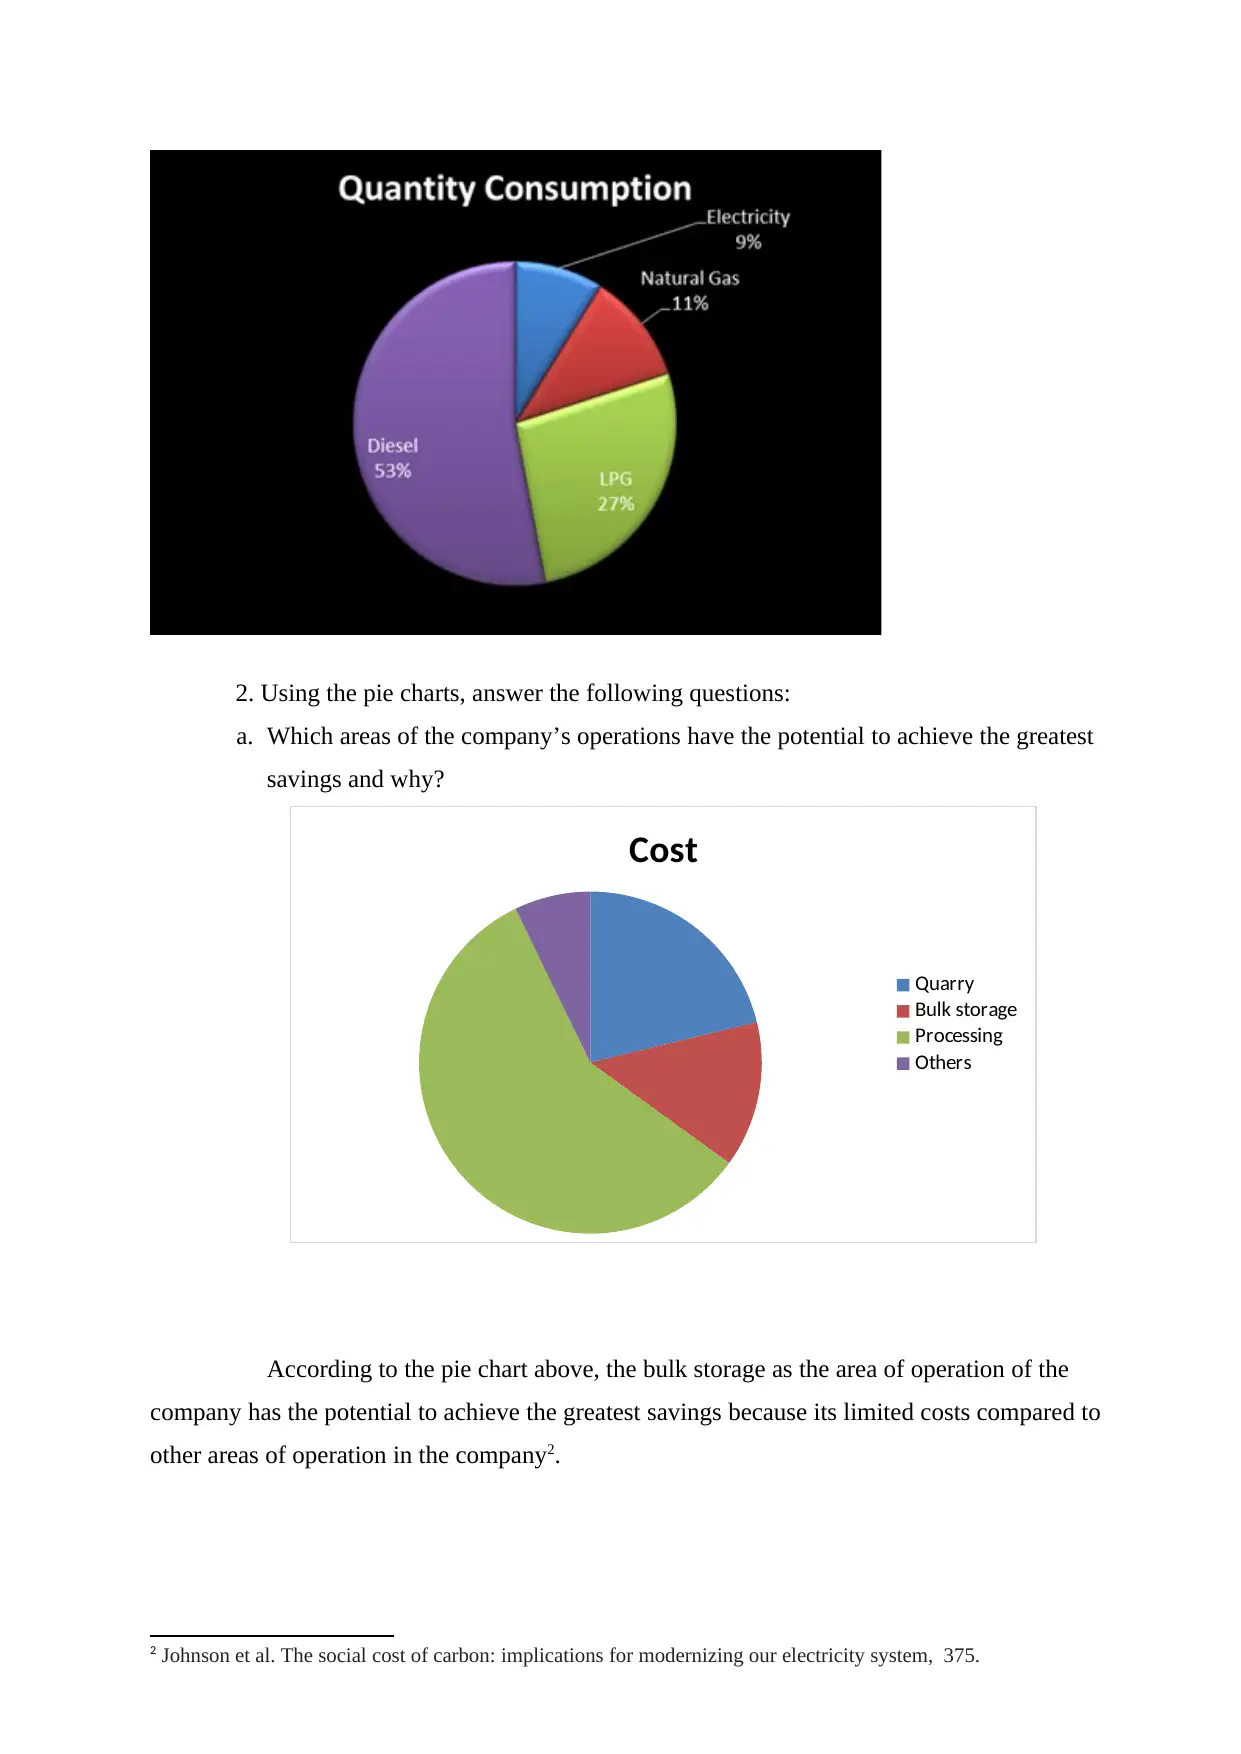
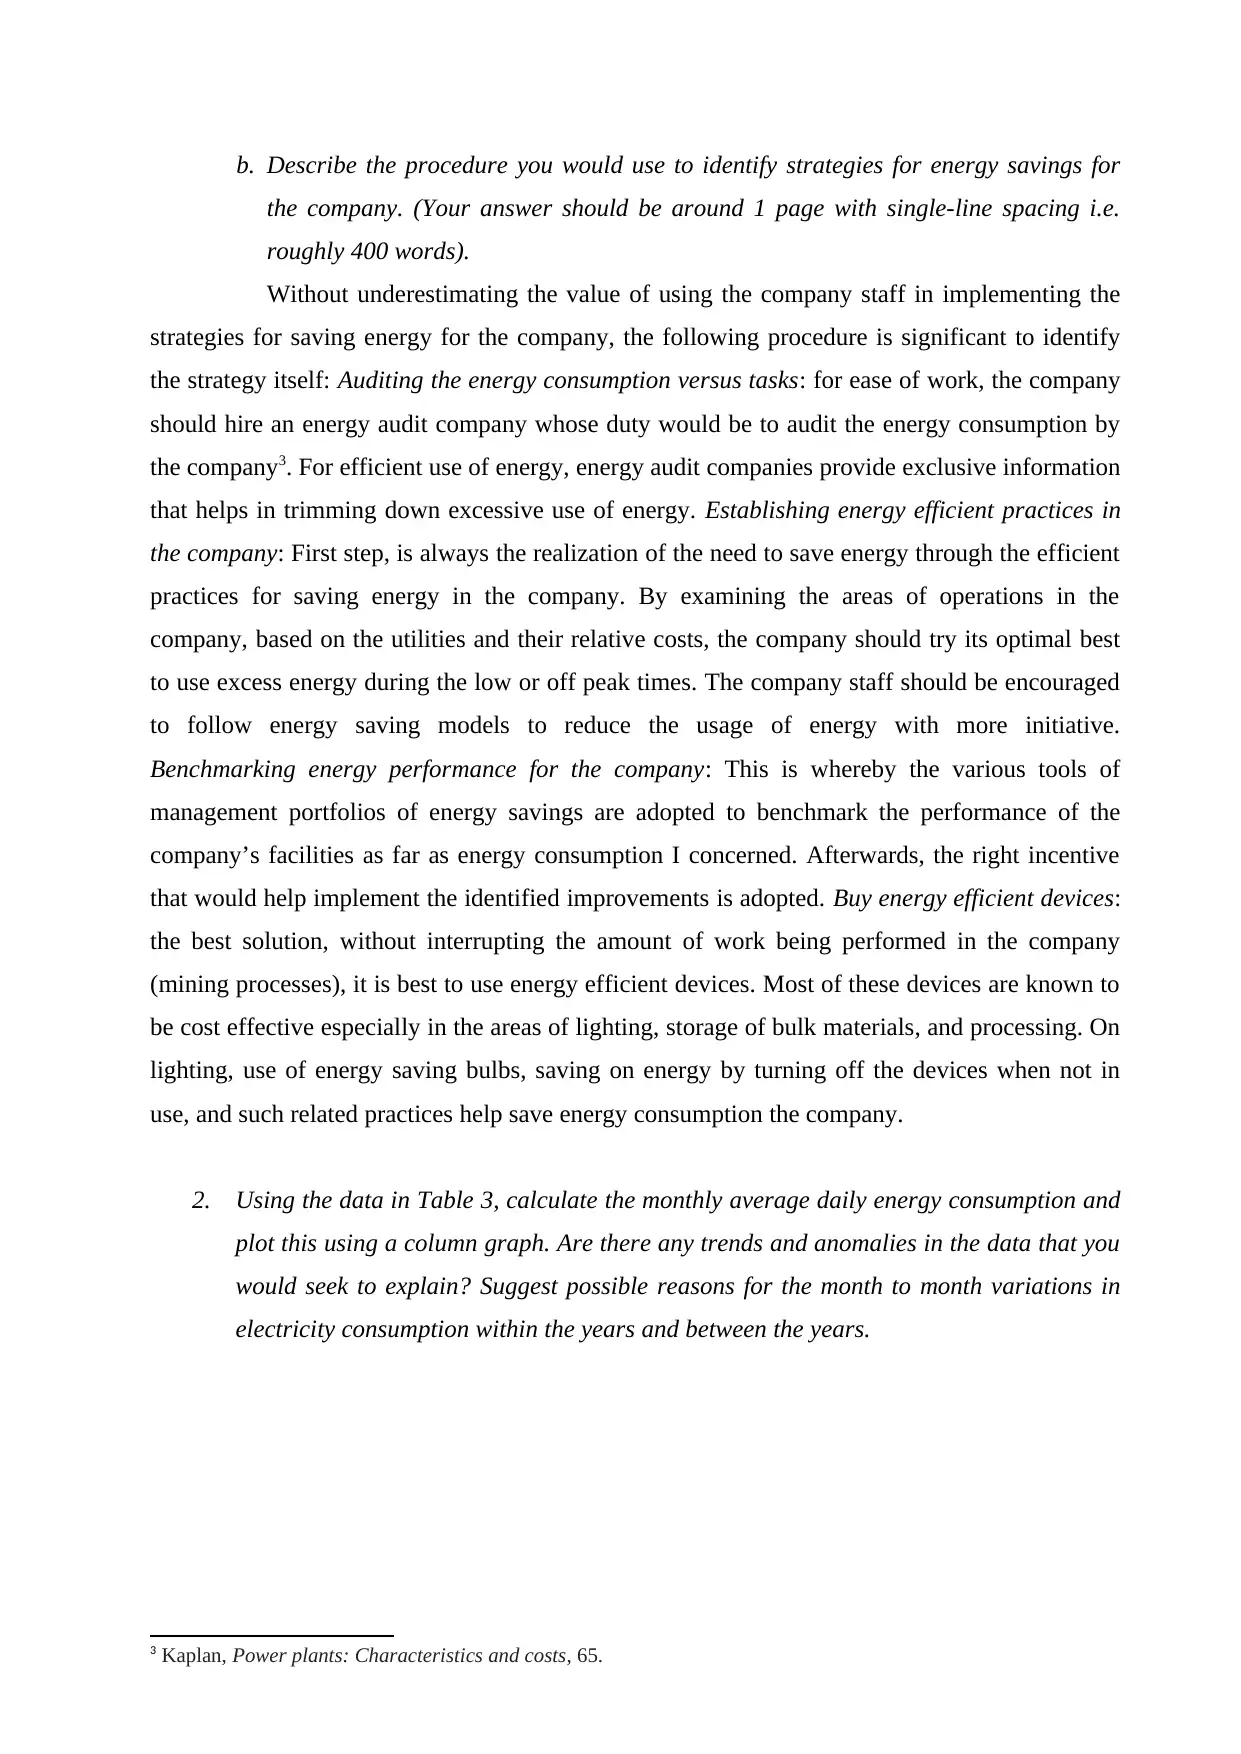
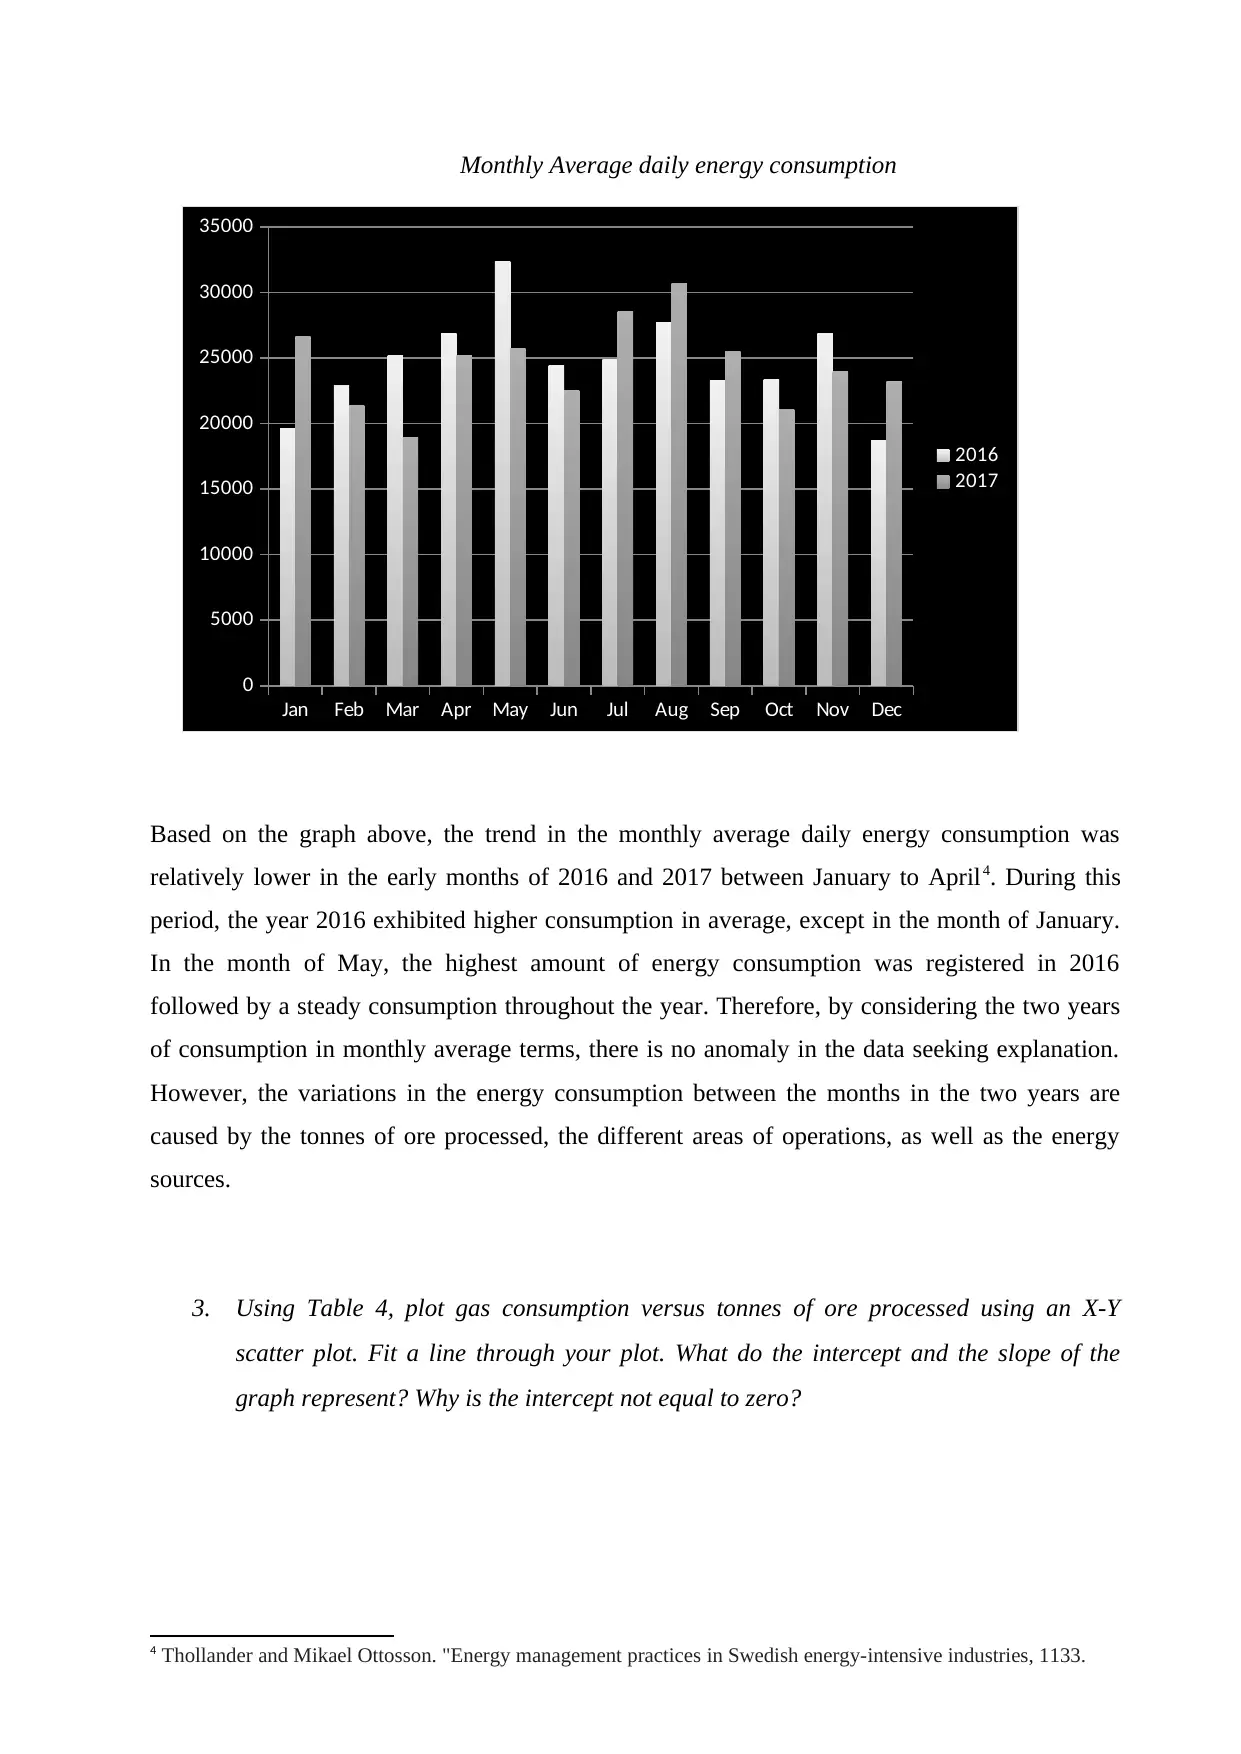
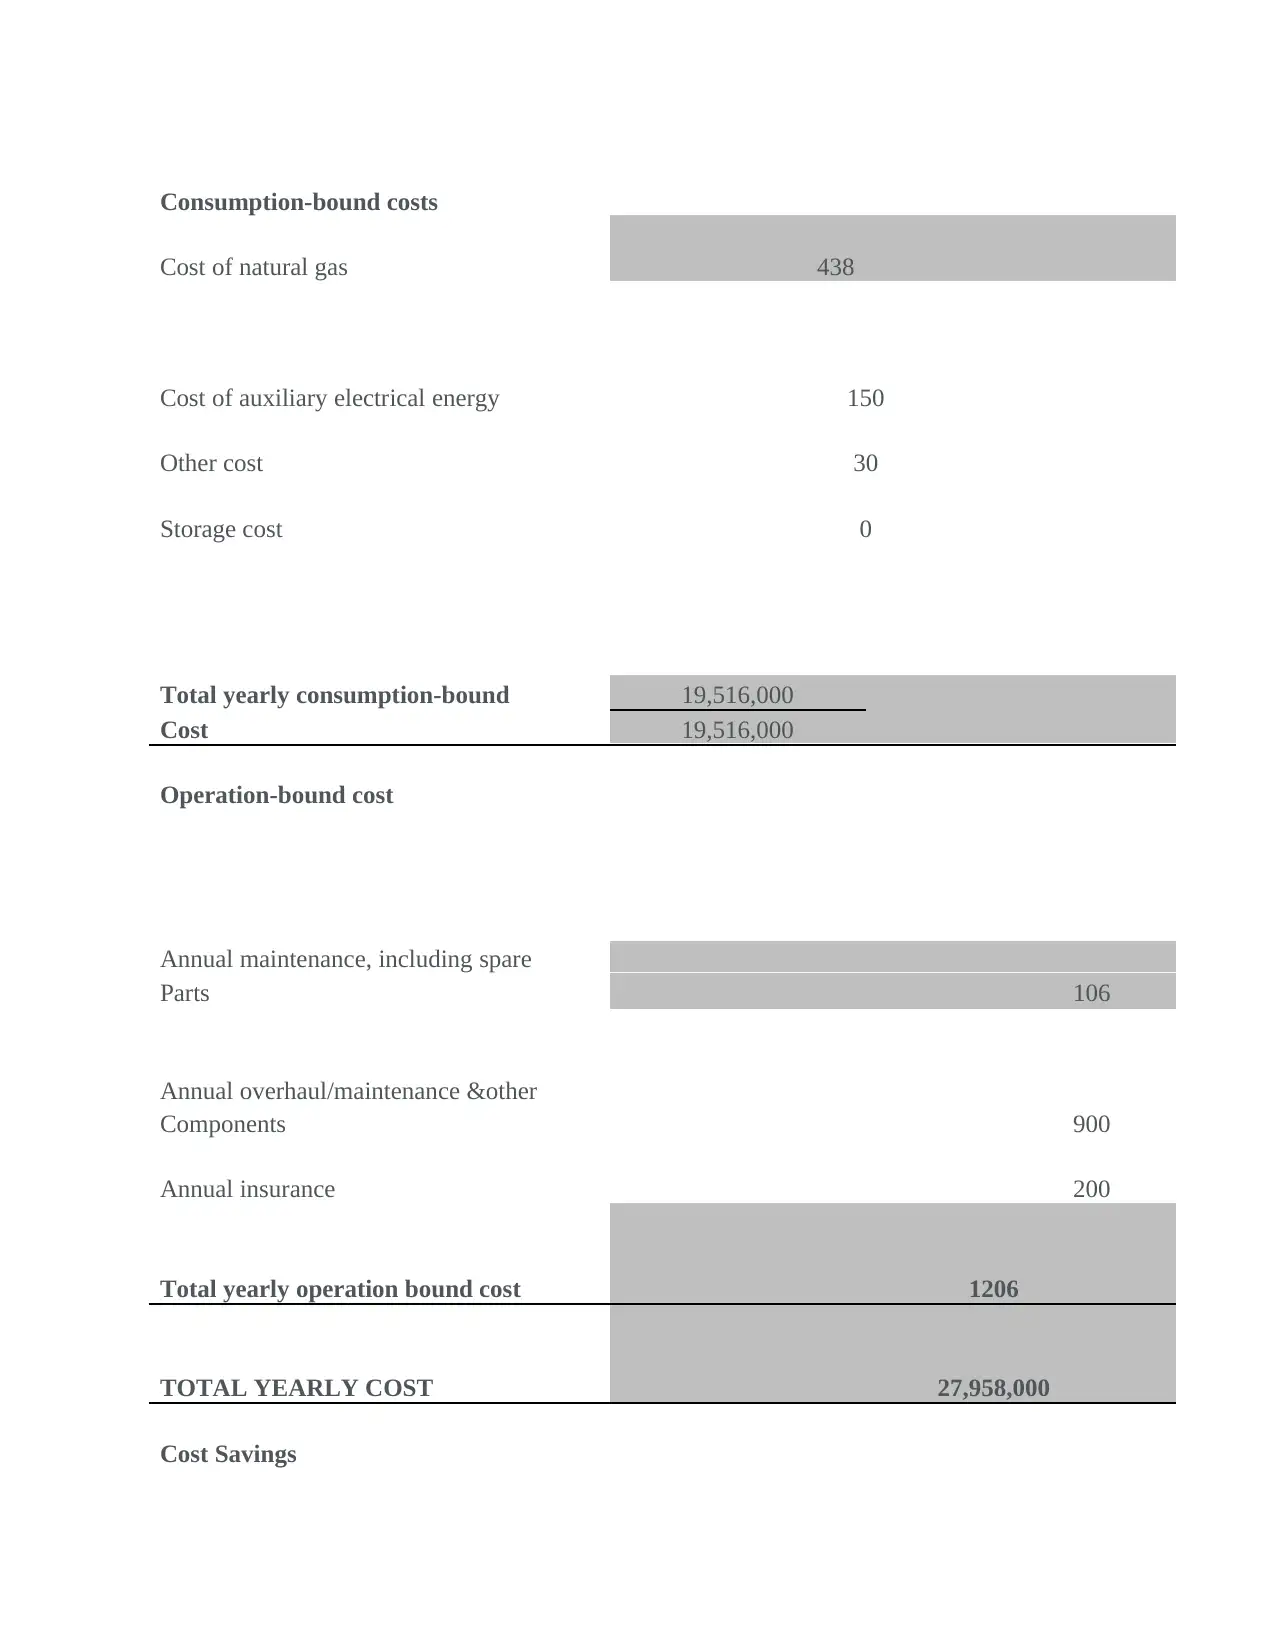
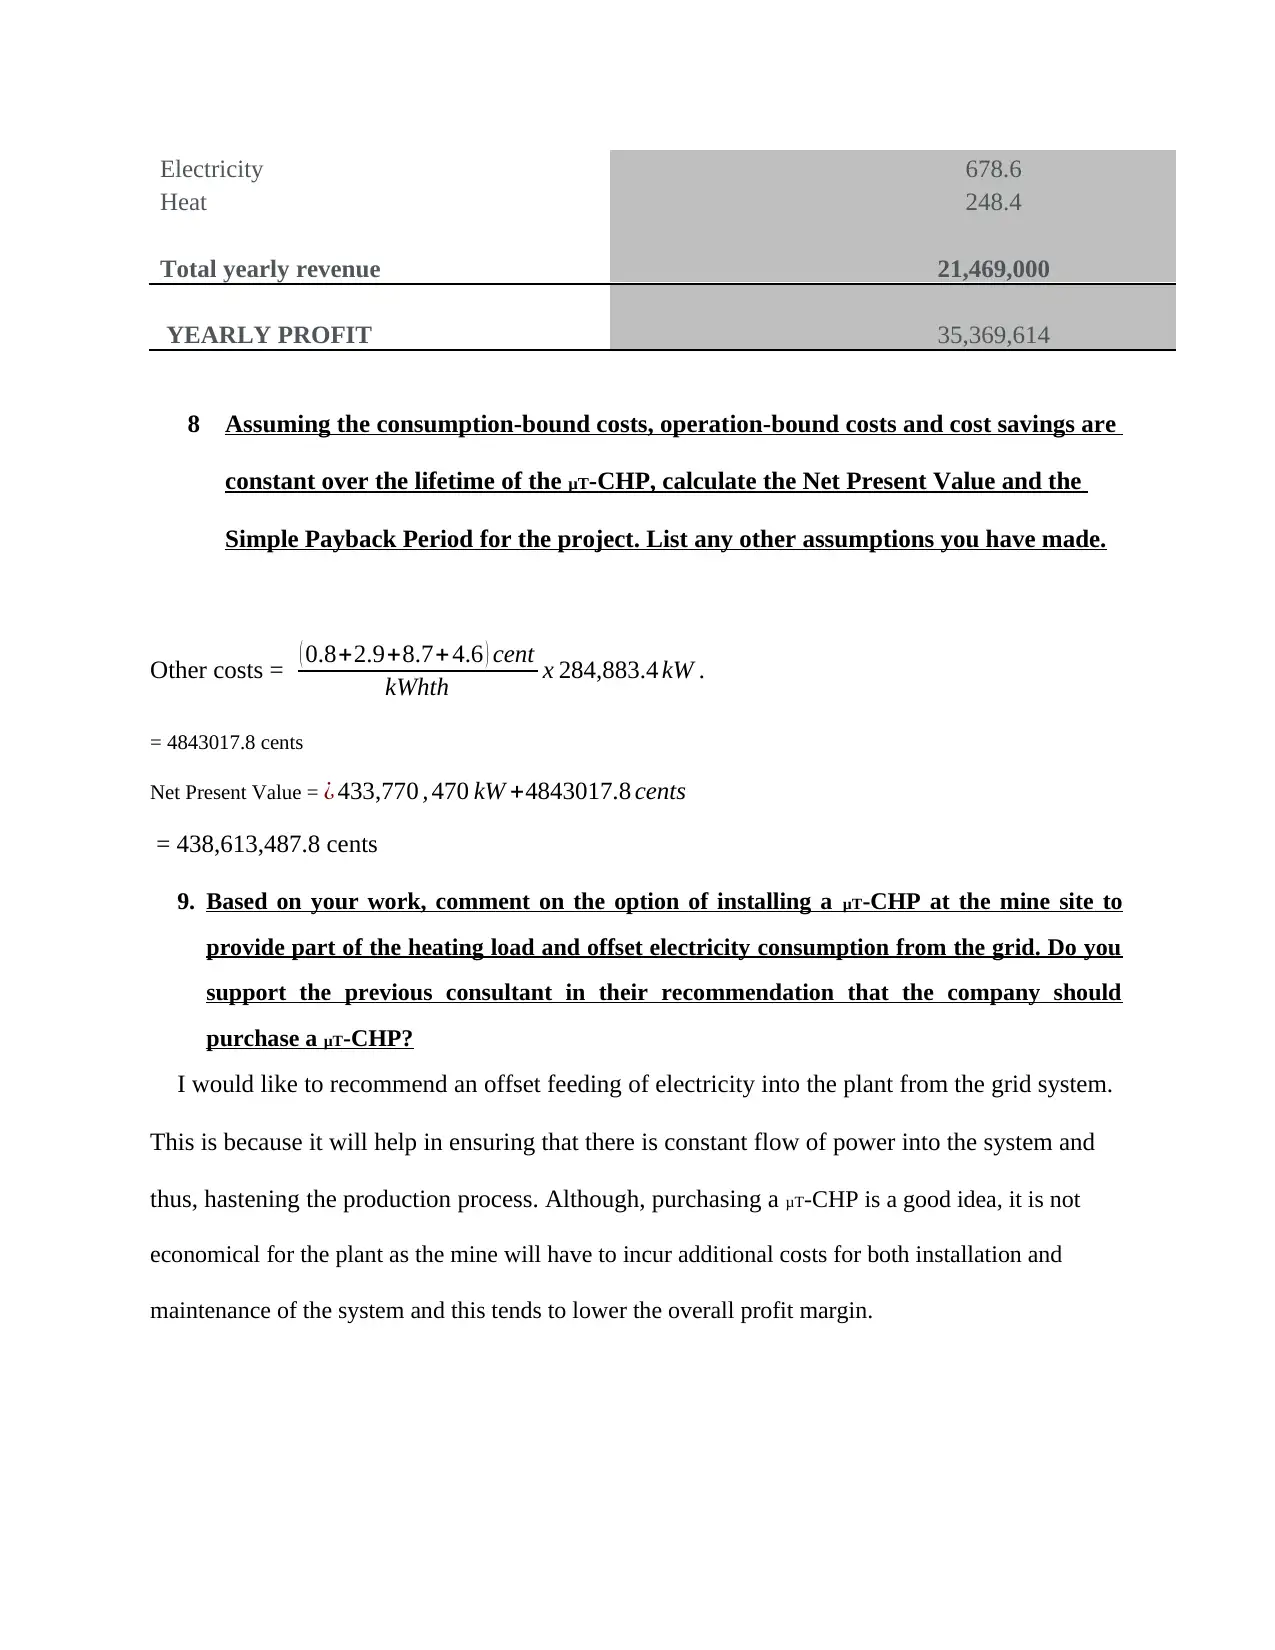
This report presents an energy audit conducted for Rocky Mines, an Australian-based mining company, focusing on its Western Australia site. The audit includes a preliminary analysis of energy costs and consumption using pie charts, identifying bulk storage as an area for potential savings. It details procedures for identifying energy-saving strategies, such as auditing energy consumption, establishing energy-efficient practices, benchmarking energy performance, and using energy-efficient devices. The report calculates monthly average daily energy consumption, analyzes trends, and explains variations in electricity consumption. It also examines gas consumption versus ore processed using a scatter plot. Furthermore, the report includes energy consumption calculations related to a micro-CHP system, determining electrical power capacity, annual electricity and heat production, and fuel energy needs. A cost-benefit analysis of the micro-CHP system is presented, including capital costs, yearly profits, net present value, and simple payback period. The report concludes with a recommendation for offsetting electricity consumption from the grid and discusses the economic viability of purchasing a micro-CHP system. Finally, it addresses mass balances for biofuel production and tabulates thermal and electrical energy requirements for each step in the process.
Document Page
Energy Audit of Mining Company
Name
Course
College
Tutor
Date
tabler-icon-diamond-filled.svg

Paraphrase This Document

Need a fresh take? Get an instant paraphrase of this document with our AI Paraphraser
Document Page
Energy Audit of Mining Company
Part A. Preliminary Analysis
In your preliminary analysis, provide answers to the following questions:
1. Create pie charts for the energy cost and energy consumption data shown in Tables 1 and
Energy Cost pie chart1
Energy consumption
1 Andersson et al. Benchmarking energy performance of industrial small and medium-sized enterprises using an
energy efficiency index, 895.
21%
14%
58%
7%
Cost
Quarry Bulk storage Processing Others
Document Page
2. Using the pie charts, answer the following questions:
a. Which areas of the company’s operations have the potential to achieve the greatest
savings and why?
According to the pie chart above, the bulk storage as the area of operation of the
company has the potential to achieve the greatest savings because its limited costs compared to
other areas of operation in the company2.
2 Johnson et al. The social cost of carbon: implications for modernizing our electricity system, 375.
Cost
Quarry
Bulk storage
Processing
Others
Document Page
b. Describe the procedure you would use to identify strategies for energy savings for
the company. (Your answer should be around 1 page with single-line spacing i.e.
roughly 400 words).
Without underestimating the value of using the company staff in implementing the
strategies for saving energy for the company, the following procedure is significant to identify
the strategy itself: Auditing the energy consumption versus tasks: for ease of work, the company
should hire an energy audit company whose duty would be to audit the energy consumption by
the company3. For efficient use of energy, energy audit companies provide exclusive information
that helps in trimming down excessive use of energy. Establishing energy efficient practices in
the company: First step, is always the realization of the need to save energy through the efficient
practices for saving energy in the company. By examining the areas of operations in the
company, based on the utilities and their relative costs, the company should try its optimal best
to use excess energy during the low or off peak times. The company staff should be encouraged
to follow energy saving models to reduce the usage of energy with more initiative.
Benchmarking energy performance for the company: This is whereby the various tools of
management portfolios of energy savings are adopted to benchmark the performance of the
company’s facilities as far as energy consumption I concerned. Afterwards, the right incentive
that would help implement the identified improvements is adopted. Buy energy efficient devices:
the best solution, without interrupting the amount of work being performed in the company
(mining processes), it is best to use energy efficient devices. Most of these devices are known to
be cost effective especially in the areas of lighting, storage of bulk materials, and processing. On
lighting, use of energy saving bulbs, saving on energy by turning off the devices when not in
use, and such related practices help save energy consumption the company.
2. Using the data in Table 3, calculate the monthly average daily energy consumption and
plot this using a column graph. Are there any trends and anomalies in the data that you
would seek to explain? Suggest possible reasons for the month to month variations in
electricity consumption within the years and between the years.
3 Kaplan, Power plants: Characteristics and costs, 65.
tabler-icon-diamond-filled.svg

Paraphrase This Document

Need a fresh take? Get an instant paraphrase of this document with our AI Paraphraser
Document Page
Monthly Average daily energy consumption
Based on the graph above, the trend in the monthly average daily energy consumption was
relatively lower in the early months of 2016 and 2017 between January to April4. During this
period, the year 2016 exhibited higher consumption in average, except in the month of January.
In the month of May, the highest amount of energy consumption was registered in 2016
followed by a steady consumption throughout the year. Therefore, by considering the two years
of consumption in monthly average terms, there is no anomaly in the data seeking explanation.
However, the variations in the energy consumption between the months in the two years are
caused by the tonnes of ore processed, the different areas of operations, as well as the energy
sources.
3. Using Table 4, plot gas consumption versus tonnes of ore processed using an X-Y
scatter plot. Fit a line through your plot. What do the intercept and the slope of the
graph represent? Why is the intercept not equal to zero?
4 Thollander and Mikael Ottosson. "Energy management practices in Swedish energy-intensive industries, 1133.
Jan Feb Mar Apr May Jun Jul Aug Sep Oct Nov Dec
0
5000
10000
15000
20000
25000
30000
35000
2016
2017
Document Page
Document Page
According to the scatter graph below of gas consumption against tonnes of ore processed,
the slope of the graph is 2.95 which represent the degree to which tonnes of ore processed affect
the amount of gas consumed during mining, and vice versa. The y-x intercepts represent the
value of the various variables that are constant in causing the change. Therefore, the intercepts
are not equal to zero because they are real numbers that actually causes the effects between the
two variables5.
os
Part B: Energy
Consumption Calculations
1 . Using the electrical power output to heat power output ratio, and the heat output of
the μT-CHP, determine the electrical power capacity, Ec of the μT-CHP.
5 Lu et al. "An assessment of alternative carbon mitigation policies for achieving the emissions reduction of the
Clean Power Plan, 672.
Y=2.95x+ 0.009
CHP efficiency= ratio of net electrical output
net fuel consumption ,
tabler-icon-diamond-filled.svg

Paraphrase This Document

Need a fresh take? Get an instant paraphrase of this document with our AI Paraphraser
Document Page
CHP efficiency= ratio of net electrical output
net fuel consumption ,
Therefore, μT CHP=EFF FERC =
P+ Q
2
F
But
Ratio of electrical power output ¿ fuel power input , Ec /Qo = 25.5%
Also, Ratio of electrical power output ¿ heat power output , Ec /Qc = 51.85%
Hence,
CHP efficiency= 51.85
25.5 = 2.033
2 If the μT-CHP runs at full load when operating, what is the annual amount of
electricity it will produce? What is the annual amount of heat it will produce?
The amount of electricity to be produced is given by
Annual Energy heat Demand for Electricity6 = Coefficient Performance x heating
Cod=COPab x Thi
= 25.5
51.85 x 54 kWh .
=26.55737705kwh.
Amount of electricity produced annually = 6.55737705 kwh x 7000
6 Moya et al. "Analysis of the Ecuadorian energy audit practices: A review of energy efficiency promotion, 296.
Document Page
= 185,901.63kW.
Amount of heat produced = 2.033 x 54 kWh
= 109. 782kWh
Amount of heat produced annually = 109. 782kWh x 7000 hours =
= 768,474kW.
3 How much heat will remain to be produced by the boiler?
Total Energy produced annually = 455,814.7 kWh x 185,901.63 kW
= 641,716.34kW.
But Annual total demand = 926,600 kW
Hence, amount that will be produced by the turbines= 926,600 kW 641,716.34 kW
= 284,883.4kW.
4 Using the electrical power output to fuel power input ratio, and the electrical power
capacity of the μT-CHP , calculate the fuel power input of the μT-CHP in kW?
Electrical Power Capacity CSHP=(C¿¿ f x Fb ).( Eld + El1)¿
= 2.9 cents
kWh x 185,901.63 kW
= 539114.727 cents
But it is assumed that the overall input electricity amount is equivalent to fuel power input
Hence, fuel capacity7 = 539114.727 cents
8.7 cent /kWh el
= 61,967.21 kWh.
5 How much fuel energy (in kWh) is needed to run the μT-CHP for a whole year?
7 Bawua and Richmond Owusu. "Analyzing the effect of Akoben programme on the environmental performance of
mining in Ghana, 19.
Document Page
Fuel required per hour is 61,967.21 kWh
Fuel Energy Required = 61,967.21 x 7000 = 433,770, 470kW.
6 Calculate the yearly capital cost of the μT-CHP assuming a life time of 20 years and
discount rate of 5.25%, using the annuity formula, which converts capital cost, C
into an equivalent annual payment, A using a Capital Recovery Factor, CRF. Ignore
the effects of inflation.
CSHPCCHP .Ceq F x 8760Crf ( l , i ) . CeqCHP . Eld+ Ceqab .Cod ¿ 0
Where
C eq CHP thecapital costs of CHP unit ( EUR /kW e)
C eq ab( EUR /kW c )the capital costs of absorption chiller
crf ( ) the capital recovery factor used ¿ convert a present value into a stream of equal annual payments
a specified tim
But assuming that Crf ( l , i ) . CeqCHP . Eld +Ceqab .Cod ¿ is negligible = 0
Then, the equation can be written as
CSHPCCHP .Ceq F x 8760
= (26.55737702.033) x $ 2150
kW e x 8760
= 461,364,842.3 cents
7 Determine the yearly profit of the μT-CHP by completing the table below
Cost components of μT_CHP Yearly costs ($)
Total Yearly Capital cost 2150
tabler-icon-diamond-filled.svg

Paraphrase This Document

Need a fresh take? Get an instant paraphrase of this document with our AI Paraphraser
Document Page
Consumption-bound costs
Cost of natural gas 438
Cost of auxiliary electrical energy 150
Other cost 30
Storage cost 0
Total yearly consumption-bound 19,516,000
Cost 19,516,000
Operation-bound cost
Annual maintenance, including spare
Parts 106
Annual overhaul/maintenance &other
Components 900
Annual insurance 200
Total yearly operation bound cost 1206
TOTAL YEARLY COST 27,958,000
Cost Savings
Document Page
Electricity 678.6
Heat 248.4
Total yearly revenue 21,469,000
YEARLY PROFIT 35,369,614
8 Assuming the consumption-bound costs, operation-bound costs and cost savings are
constant over the lifetime of the μT-CHP, calculate the Net Present Value and the
Simple Payback Period for the project. List any other assumptions you have made.
Other costs = ( 0.8+2.9+8.7+4.6 ) cent
kWhth x 284,883.4 kW .
= 4843017.8 cents
Net Present Value = ¿ 433,770 , 470 kW +4843017.8 cents
= 438,613,487.8 cents
9. Based on your work, comment on the option of installing a μT-CHP at the mine site to
provide part of the heating load and offset electricity consumption from the grid. Do you
support the previous consultant in their recommendation that the company should
purchase a μT-CHP?
I would like to recommend an offset feeding of electricity into the plant from the grid system.
This is because it will help in ensuring that there is constant flow of power into the system and
thus, hastening the production process. Although, purchasing a μT-CHP is a good idea, it is not
economical for the plant as the mine will have to incur additional costs for both installation and
maintenance of the system and this tends to lower the overall profit margin.
chevron_up_icon
1 out of 17
circle_padding
hide_on_mobile
zoom_out_icon
[object Object]