Analyzing Financial Ratios: Rogers Communication and Benchmarking
VerifiedAdded on 2023/06/03
|17
|4524
|301
Report
AI Summary
This report provides a comprehensive financial analysis of Rogers Wireless, a subsidiary of Rogers Communications, and benchmarks its performance against competitors such as Bell Canada, Telus Corporation, and Bell MTS. The analysis covers current business conditions, emphasizing the importance of wireless networks in Canada and the industry's contribution to the economy. Key financial ratios, including current ratio, return on assets, net profit ratio, return on equity, and earnings per share, are calculated and compared across the companies for the years 2016 and 2017. The report interprets these ratios to assess the financial health and efficiency of Rogers Wireless, highlighting its liquidity, profitability, and ability to generate returns for shareholders. The benchmarking exercise reveals Rogers Wireless's relative strengths and weaknesses compared to its peers in the Canadian telecommunications industry. Desklib provides this and many other solved assignments for students.

ACCOUNTING 1
ACCOUNTING
ACCOUNTING
Paraphrase This Document
Need a fresh take? Get an instant paraphrase of this document with our AI Paraphraser
ACCOUNTING 2
Contents
About the companies chosen: 3
Current business conditions: 3
Financial health of the companies: 4
Industry sector and financial health of the companies and benchmarking: 10
Application of other financial techniques: 13
Conclusion and recommendations: 15
References 18
Contents
About the companies chosen: 3
Current business conditions: 3
Financial health of the companies: 4
Industry sector and financial health of the companies and benchmarking: 10
Application of other financial techniques: 13
Conclusion and recommendations: 15
References 18
ACCOUNTING 3
About the companies chosen:
4 companies have been undertaken for review for the purposes of this assignment.
Rogers Wireless being the primary company which is a Canadian wireless telephone company and
has it’s headquarter in Toronto. The company is the largest wireless carrier with about 10.482
million subscribers and with the revenue of an amount of $8.3 billion as per the annual report of the
year 2017. The company is the wholly owned subsidiary of Rogers Communications (Rogers
Communications, 2018).
The second company is Bell Canada which is also known as the Canadian Telecommunications
company and has its headquarters in Montreal, Canada. It is the local exchange carrier for telephone
and also provides in the DSL services in the majority part of Canada. It has the major advantage of
being the local exchange carrier for the enterprise customers in the western provinces (BCE Bell
Canada Enterprises, 2018).
The third company is Telus Corporation which is again a Canadian national telecommunications
company which provides services in British Columbia (Telus, 2018).
The fourth company is Bell MTS Inc which is again a wholly owned subsidiary of BCE Inc which
operates in the telecommunication services in the Canadian province of Manitoba. The company has
its head office located in Downtown Winnipeg, Manitoba (Bell MTS, 2018).
All of these stated companies belong to the sector of mobile operating.
Current business conditions:
As far as the current business conditions are concerned, the industry is one of the greatest
innovations made by the Canadians. The city has revolved in and around many of its efforts when it
comes to the catering of needs of the customers along with many of such vertical industries. Each
and every sector of the city needs the wireless networks in order to function (Communications
Monitoring Report, 2018).
The industry employs about 138,000 people and adds on a great amount of money of investment
into the various different communities of the city each and every year. The demand for such of the
wireless network is immense and it has a record demand of about 500% (Roger communications,
2018).
The industry adopts the wireless services and entails a high penetration of the rates for all of the
latest version of the wireless devices and also caters in to the demand for the mobile network which
drives in the success story of the city. The leadership of the wireless did not happen overnight. It has
taken place due to a sustained investment and also due to innovation which was deployed in by the
use of an advanced wireless network.
Also, the industry witnesses a very stable regulatory environment which counts in the importance of
the facilities which is based on the competition which has made way for many of the investments so
that the city could be developed in terms of the wireless networks (Global news, 2018).
The company Rogers Canada is the largest wireless communication service provider along with the
largest publishing company of Canada (Femfort university, 2018). The company’s financial
performance has improved over the year and it also a huge base when it comes to the operations
and the customers. The company also undertakes many of the strategic activities such as the
introduction of the new services, diversification etc. it is also considered to be the topmost company
⊘ This is a preview!⊘
Do you want full access?
Subscribe today to unlock all pages.
Trusted by 1+ million students worldwide
ACCOUNTING 4
which is based in Canada and which has over 9 million mobile and 4 million TV subscribers, which is
indeed commendable (Broad cast technology, 2018).
The company does have many release such s the sister o other team payers in the market. The
company is also dependent upon the Canadian market which is a peaking saturation (Market line,
2018). The opportunities of the company includes in the growth in the services pertaining with the
telecommunication all across the various different regions.
The company is exposed to threats from regulatory changes. The company also has wireless number
portability execution which causes in the customer flow. The company is exposed to rapid changes in
the technology with respect to the wireless telephones and also there is a high amount of pressure
from its competitors.
The competitors of the company include BCE-Bell Canada Enterprises, Telus and MTS.
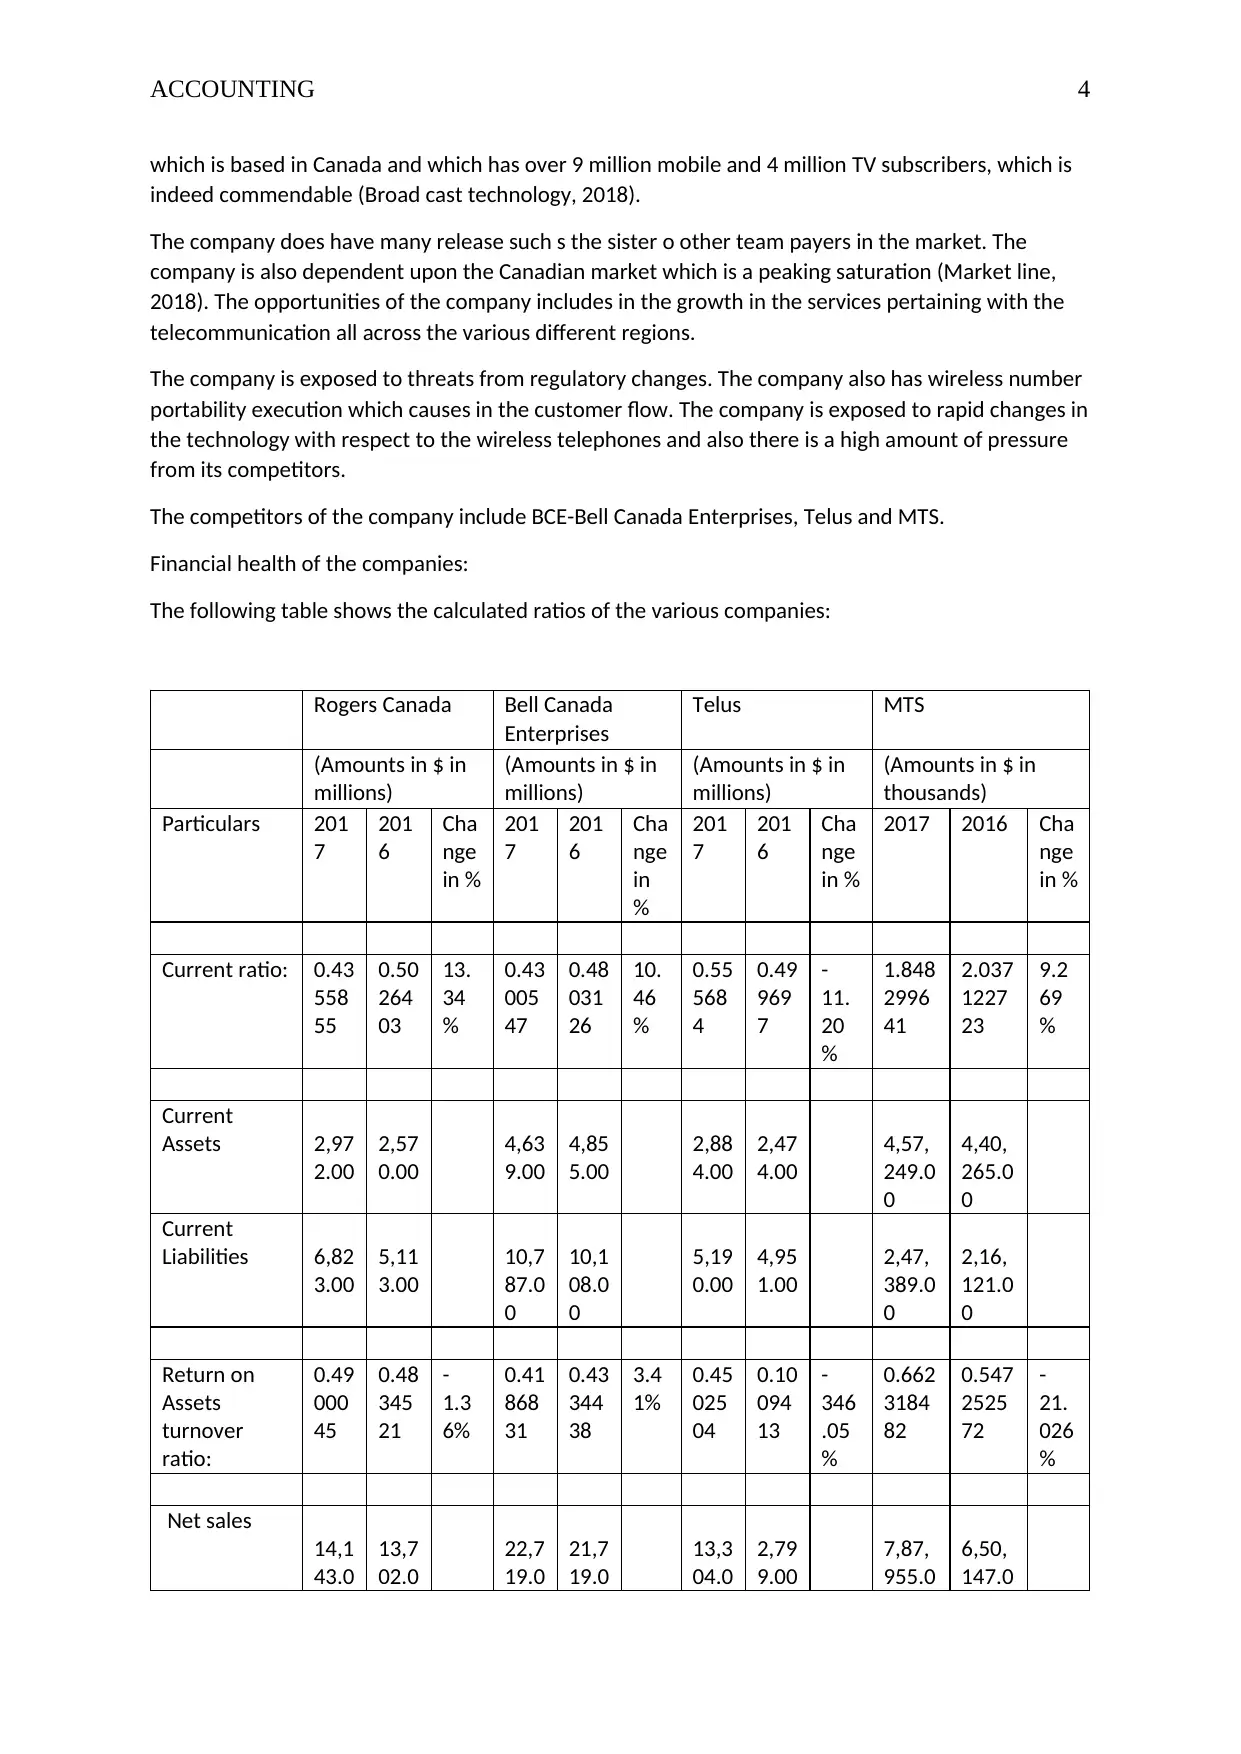
Financial health of the companies:
The following table shows the calculated ratios of the various companies:
Rogers Canada Bell Canada
Enterprises
Telus MTS
(Amounts in $ in
millions)
(Amounts in $ in
millions)
(Amounts in $ in
millions)
(Amounts in $ in
thousands)
Particulars 201
7
201
6
Cha
nge
in %
201
7
201
6
Cha
nge
in
%
201
7
201
6
Cha
nge
in %
2017 2016 Cha
nge
in %
Current ratio: 0.43
558
55
0.50
264
03
13.
34
%
0.43
005
47
0.48
031
26
10.
46
%
0.55
568
4
0.49
969
7
-
11.
20
%
1.848
2996
41
2.037
1227
23
9.2
69
%
Current
Assets 2,97
2.00
2,57
0.00
4,63
9.00
4,85
5.00
2,88
4.00
2,47
4.00
4,57,
249.0
0
4,40,
265.0
0
Current
Liabilities 6,82
3.00
5,11
3.00
10,7
87.0
0
10,1
08.0
0
5,19
0.00
4,95
1.00
2,47,
389.0
0
2,16,
121.0
0
Return on
Assets
turnover
ratio:
0.49
000
45
0.48
345
21
-
1.3
6%
0.41
868
31
0.43
344
38
3.4
1%
0.45
025
04
0.10
094
13
-
346
.05
%
0.662
3184
82
0.547
2525
72
-
21.
026
%
Net sales
14,1
43.0
13,7
02.0
22,7
19.0
21,7
19.0
13,3
04.0
2,79
9.00
7,87,
955.0
6,50,
147.0
which is based in Canada and which has over 9 million mobile and 4 million TV subscribers, which is
indeed commendable (Broad cast technology, 2018).
The company does have many release such s the sister o other team payers in the market. The
company is also dependent upon the Canadian market which is a peaking saturation (Market line,
2018). The opportunities of the company includes in the growth in the services pertaining with the
telecommunication all across the various different regions.
The company is exposed to threats from regulatory changes. The company also has wireless number
portability execution which causes in the customer flow. The company is exposed to rapid changes in
the technology with respect to the wireless telephones and also there is a high amount of pressure
from its competitors.
The competitors of the company include BCE-Bell Canada Enterprises, Telus and MTS.
Financial health of the companies:
The following table shows the calculated ratios of the various companies:
Rogers Canada Bell Canada
Enterprises
Telus MTS
(Amounts in $ in
millions)
(Amounts in $ in
millions)
(Amounts in $ in
millions)
(Amounts in $ in
thousands)
Particulars 201
7
201
6
Cha
nge
in %
201
7
201
6
Cha
nge
in
%
201
7
201
6
Cha
nge
in %
2017 2016 Cha
nge
in %
Current ratio: 0.43
558
55
0.50
264
03
13.
34
%
0.43
005
47
0.48
031
26
10.
46
%
0.55
568
4
0.49
969
7
-
11.
20
%
1.848
2996
41
2.037
1227
23
9.2
69
%
Current
Assets 2,97
2.00
2,57
0.00
4,63
9.00
4,85
5.00
2,88
4.00
2,47
4.00
4,57,
249.0
0
4,40,
265.0
0
Current
Liabilities 6,82
3.00
5,11
3.00
10,7
87.0
0
10,1
08.0
0
5,19
0.00
4,95
1.00
2,47,
389.0
0
2,16,
121.0
0
Return on
Assets
turnover
ratio:
0.49
000
45
0.48
345
21
-
1.3
6%
0.41
868
31
0.43
344
38
3.4
1%
0.45
025
04
0.10
094
13
-
346
.05
%
0.662
3184
82
0.547
2525
72
-
21.
026
%
Net sales
14,1
43.0
13,7
02.0
22,7
19.0
21,7
19.0
13,3
04.0
2,79
9.00
7,87,
955.0
6,50,
147.0
Paraphrase This Document
Need a fresh take? Get an instant paraphrase of this document with our AI Paraphraser
ACCOUNTING 5
0 0 0 0 0 0 0
Total Assets
28,8
63.0
0
28,3
42.0
0
54,2
63.0
0
50,1
08.0
0
29,5
48.0
0
27,7
29.0
0
11,89
,692.
00
11,88
,020.
00
Net profit
ratio:
0.12
097
86
0.06
094
-
98.
52
%
0.13
072
76
0.14
213
36
8.0
2%
0.11
116
96
0.44
158
63
74.
82
%
0.031
8343
05
0.042
2888
98
24.
722
%
Net profit
1,71
1.00
835.
00
2,97
0.00
3,08
7.00
1,47
9.00
1,23
6.00
25,08
4.00
27,49
4.00
Net Sales
14,1
43.0
0
13,7
02.0
0
22,7
19.0
0
21,7
19.0
0
13,3
04.0
0
2,79
9.00
7,87,
955.0
0
6,50,
147.0
0
Return on
equity:
0.26
957
62
0.15
847
41
-
70.
11
%
0.15
244
06
0.17
290
24
11.
83
%
0.17
899
07
0.15
574
6
-
14.
92
%
0.058
5012
72
0.067
8428
66
13.
769
%
Net profit
1,71
1.00
835.
00
2,97
0.00
3,08
7.00
1,47
9.00
1,23
6.00
25,08
4.00
27,49
4.00
Shareholders
equity 6,34
7.00
5,26
9.00
19,4
83.0
0
17,8
54.0
0
8,26
3.00
7,93
6.00
4,28,
777.0
0
4,05,
260.0
0
Earnings per
share
3.32 1.62 -
104
.94
%
3.12 3.33 6.3
1%
593 592 -
0.1
7%
1.32 1.72 23.
256
%
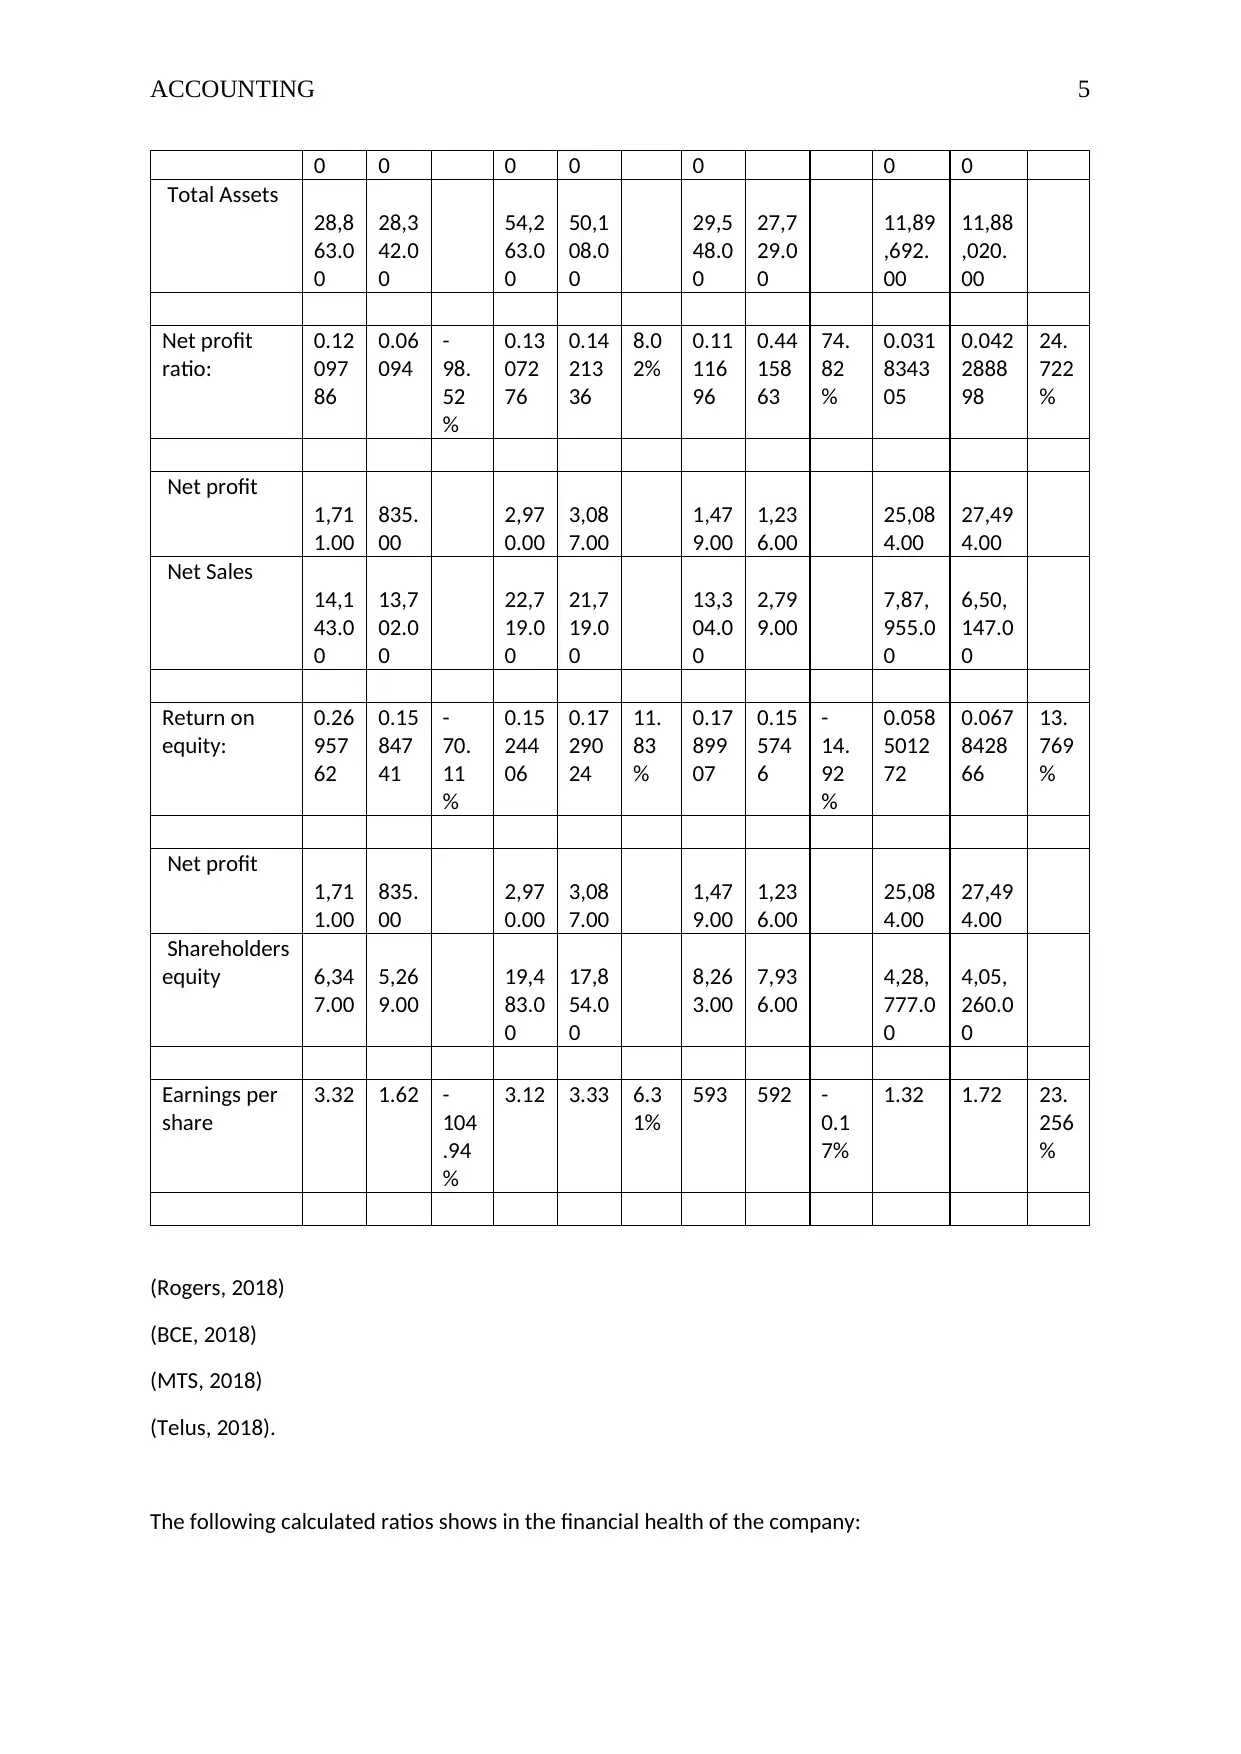
(Rogers, 2018)
(BCE, 2018)
(MTS, 2018)
(Telus, 2018).
The following calculated ratios shows in the financial health of the company:
0 0 0 0 0 0 0
Total Assets
28,8
63.0
0
28,3
42.0
0
54,2
63.0
0
50,1
08.0
0
29,5
48.0
0
27,7
29.0
0
11,89
,692.
00
11,88
,020.
00
Net profit
ratio:
0.12
097
86
0.06
094
-
98.
52
%
0.13
072
76
0.14
213
36
8.0
2%
0.11
116
96
0.44
158
63
74.
82
%
0.031
8343
05
0.042
2888
98
24.
722
%
Net profit
1,71
1.00
835.
00
2,97
0.00
3,08
7.00
1,47
9.00
1,23
6.00
25,08
4.00
27,49
4.00
Net Sales
14,1
43.0
0
13,7
02.0
0
22,7
19.0
0
21,7
19.0
0
13,3
04.0
0
2,79
9.00
7,87,
955.0
0
6,50,
147.0
0
Return on
equity:
0.26
957
62
0.15
847
41
-
70.
11
%
0.15
244
06
0.17
290
24
11.
83
%
0.17
899
07
0.15
574
6
-
14.
92
%
0.058
5012
72
0.067
8428
66
13.
769
%
Net profit
1,71
1.00
835.
00
2,97
0.00
3,08
7.00
1,47
9.00
1,23
6.00
25,08
4.00
27,49
4.00
Shareholders
equity 6,34
7.00
5,26
9.00
19,4
83.0
0
17,8
54.0
0
8,26
3.00
7,93
6.00
4,28,
777.0
0
4,05,
260.0
0
Earnings per
share
3.32 1.62 -
104
.94
%
3.12 3.33 6.3
1%
593 592 -
0.1
7%
1.32 1.72 23.
256
%
(Rogers, 2018)
(BCE, 2018)
(MTS, 2018)
(Telus, 2018).
The following calculated ratios shows in the financial health of the company:
ACCOUNTING 6
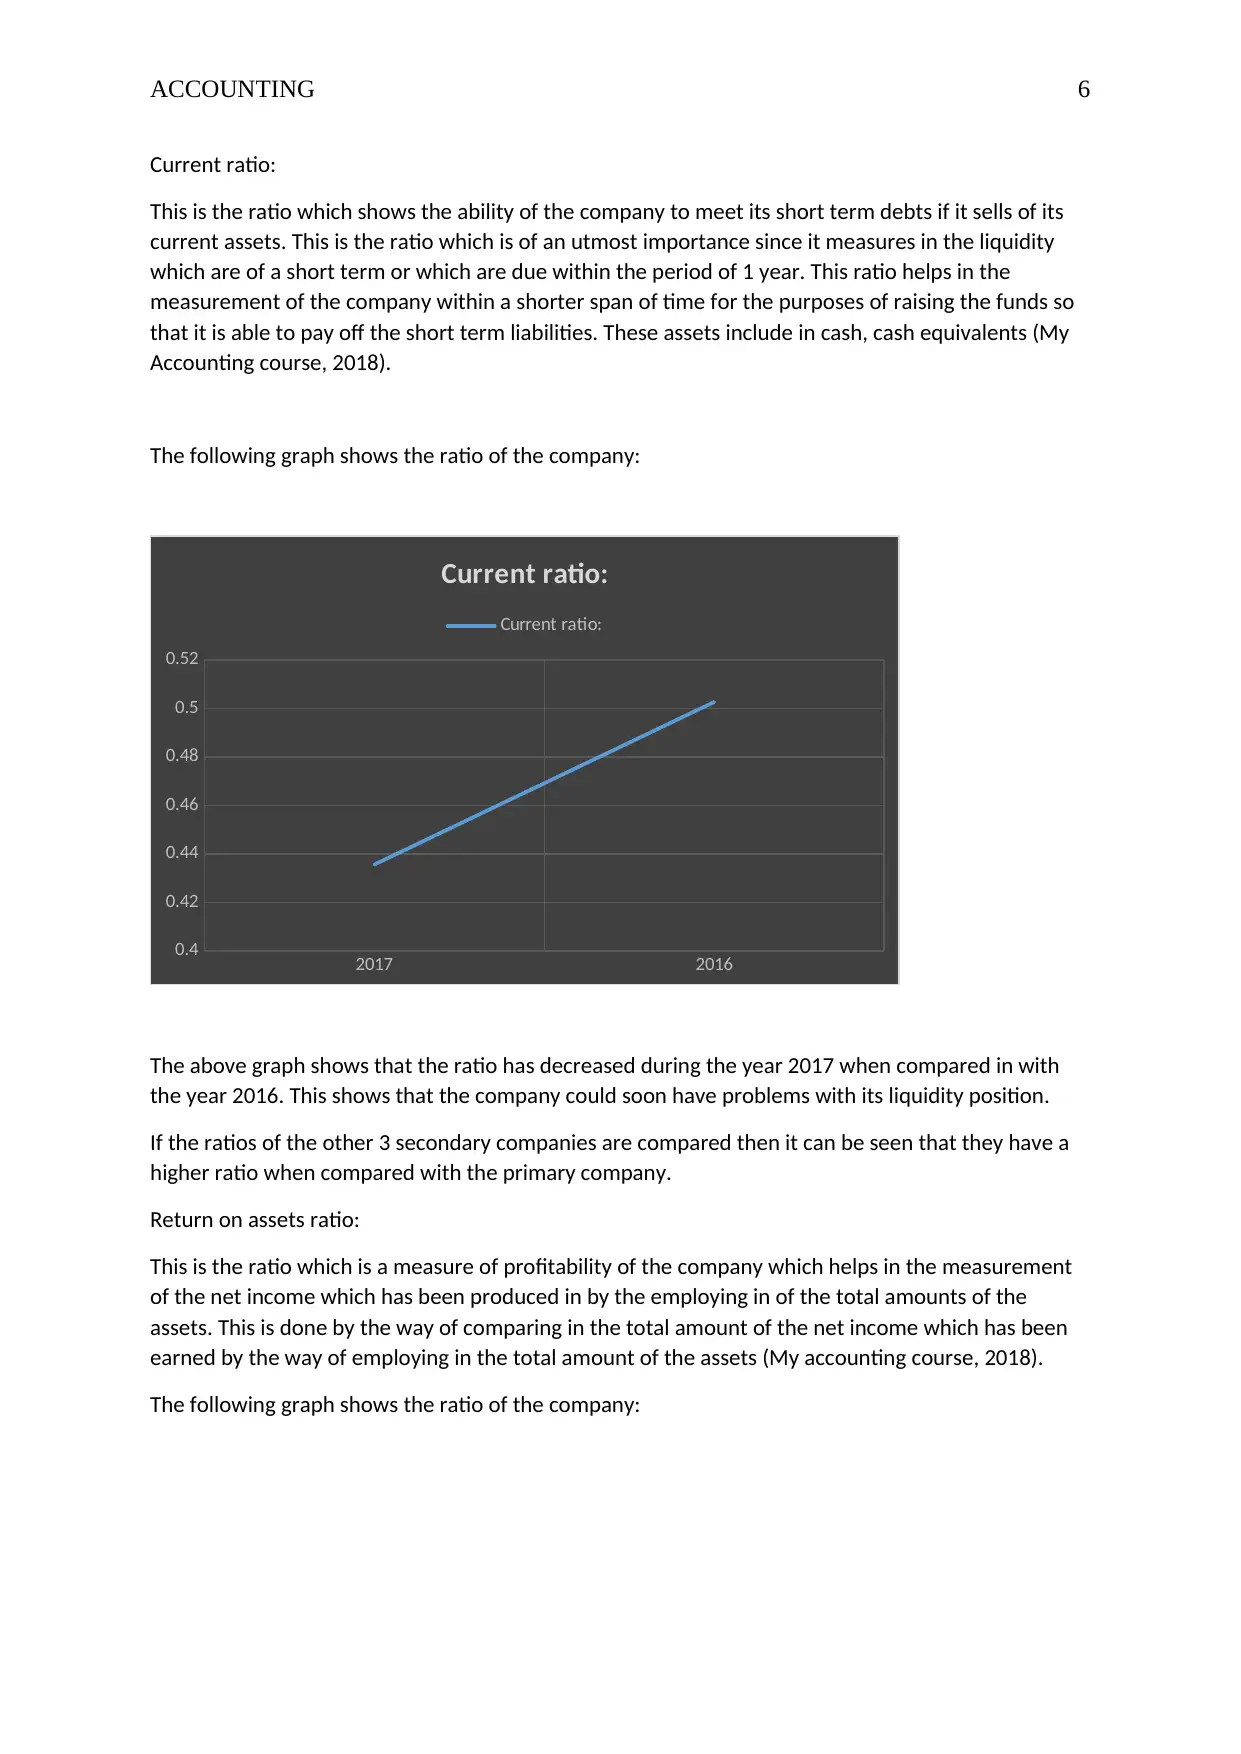
Current ratio:
This is the ratio which shows the ability of the company to meet its short term debts if it sells of its
current assets. This is the ratio which is of an utmost importance since it measures in the liquidity
which are of a short term or which are due within the period of 1 year. This ratio helps in the
measurement of the company within a shorter span of time for the purposes of raising the funds so
that it is able to pay off the short term liabilities. These assets include in cash, cash equivalents (My
Accounting course, 2018).
The following graph shows the ratio of the company:
2017 2016
0.4
0.42
0.44
0.46
0.48
0.5
0.52
Current ratio:
Current ratio:
The above graph shows that the ratio has decreased during the year 2017 when compared in with
the year 2016. This shows that the company could soon have problems with its liquidity position.
If the ratios of the other 3 secondary companies are compared then it can be seen that they have a
higher ratio when compared with the primary company.
Return on assets ratio:
This is the ratio which is a measure of profitability of the company which helps in the measurement
of the net income which has been produced in by the employing in of the total amounts of the
assets. This is done by the way of comparing in the total amount of the net income which has been
earned by the way of employing in the total amount of the assets (My accounting course, 2018).
The following graph shows the ratio of the company:
Current ratio:
This is the ratio which shows the ability of the company to meet its short term debts if it sells of its
current assets. This is the ratio which is of an utmost importance since it measures in the liquidity
which are of a short term or which are due within the period of 1 year. This ratio helps in the
measurement of the company within a shorter span of time for the purposes of raising the funds so
that it is able to pay off the short term liabilities. These assets include in cash, cash equivalents (My
Accounting course, 2018).
The following graph shows the ratio of the company:
2017 2016
0.4
0.42
0.44
0.46
0.48
0.5
0.52
Current ratio:
Current ratio:
The above graph shows that the ratio has decreased during the year 2017 when compared in with
the year 2016. This shows that the company could soon have problems with its liquidity position.
If the ratios of the other 3 secondary companies are compared then it can be seen that they have a
higher ratio when compared with the primary company.
Return on assets ratio:
This is the ratio which is a measure of profitability of the company which helps in the measurement
of the net income which has been produced in by the employing in of the total amounts of the
assets. This is done by the way of comparing in the total amount of the net income which has been
earned by the way of employing in the total amount of the assets (My accounting course, 2018).
The following graph shows the ratio of the company:
⊘ This is a preview!⊘
Do you want full access?
Subscribe today to unlock all pages.
Trusted by 1+ million students worldwide
ACCOUNTING 7
2017 2016
0.48
0.482
0.484
0.486
0.488
0.49
0.492
Return on Assets turnover ratio:
Return on Assets turnover ratio:
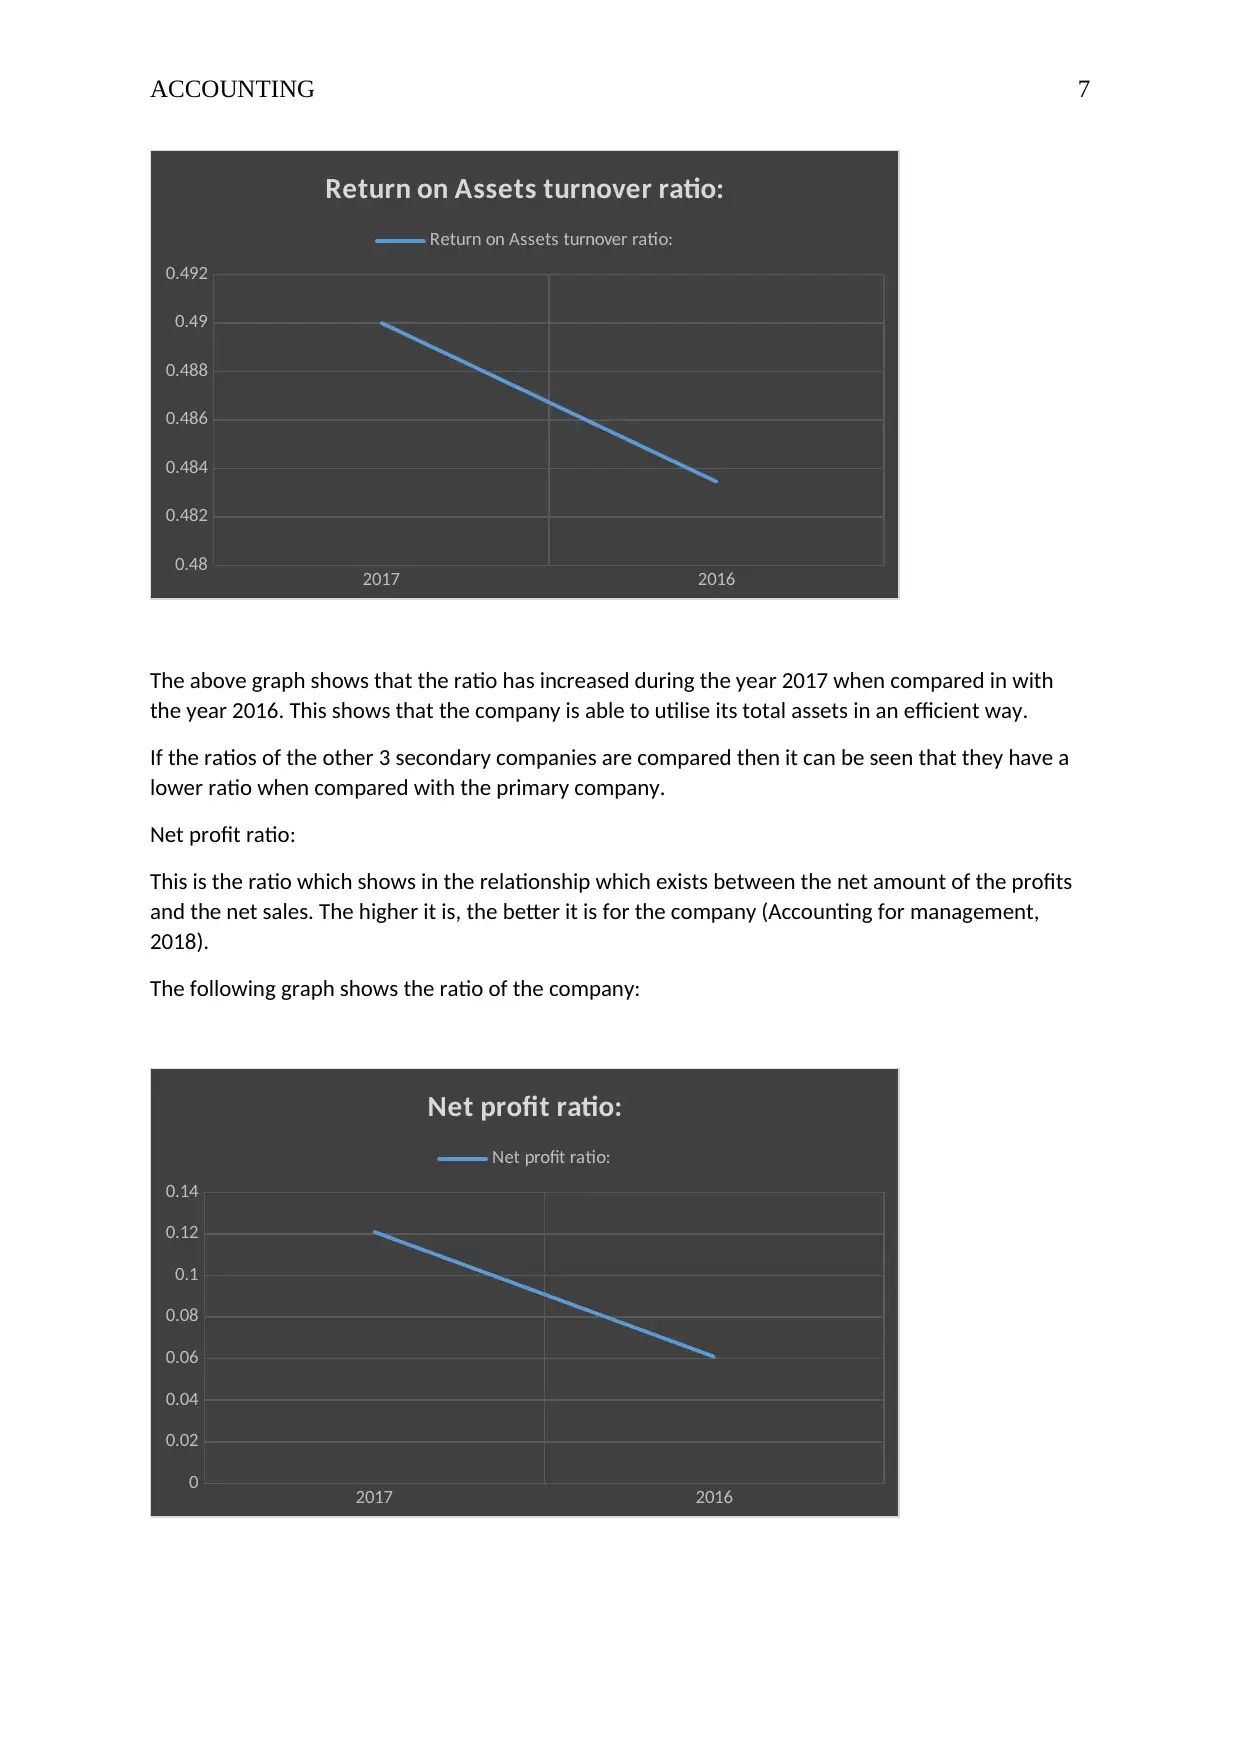
The above graph shows that the ratio has increased during the year 2017 when compared in with
the year 2016. This shows that the company is able to utilise its total assets in an efficient way.
If the ratios of the other 3 secondary companies are compared then it can be seen that they have a
lower ratio when compared with the primary company.
Net profit ratio:
This is the ratio which shows in the relationship which exists between the net amount of the profits
and the net sales. The higher it is, the better it is for the company (Accounting for management,
2018).
The following graph shows the ratio of the company:
2017 2016
0
0.02
0.04
0.06
0.08
0.1
0.12
0.14
Net profit ratio:
Net profit ratio:
2017 2016
0.48
0.482
0.484
0.486
0.488
0.49
0.492
Return on Assets turnover ratio:
Return on Assets turnover ratio:
The above graph shows that the ratio has increased during the year 2017 when compared in with
the year 2016. This shows that the company is able to utilise its total assets in an efficient way.
If the ratios of the other 3 secondary companies are compared then it can be seen that they have a
lower ratio when compared with the primary company.
Net profit ratio:
This is the ratio which shows in the relationship which exists between the net amount of the profits
and the net sales. The higher it is, the better it is for the company (Accounting for management,
2018).
The following graph shows the ratio of the company:
2017 2016
0
0.02
0.04
0.06
0.08
0.1
0.12
0.14
Net profit ratio:
Net profit ratio:
Paraphrase This Document
Need a fresh take? Get an instant paraphrase of this document with our AI Paraphraser
ACCOUNTING 8
The above graph shows that the ratio has increased during the year 2017 when compared in with
the year 2016. This shows that the company is able to utilise its total amounts of the assets in an
efficient manner.
If the ratios of the other 3 secondary companies are compared then it can be seen that the primary
company has the highest ratio as compared with the secondary companies.
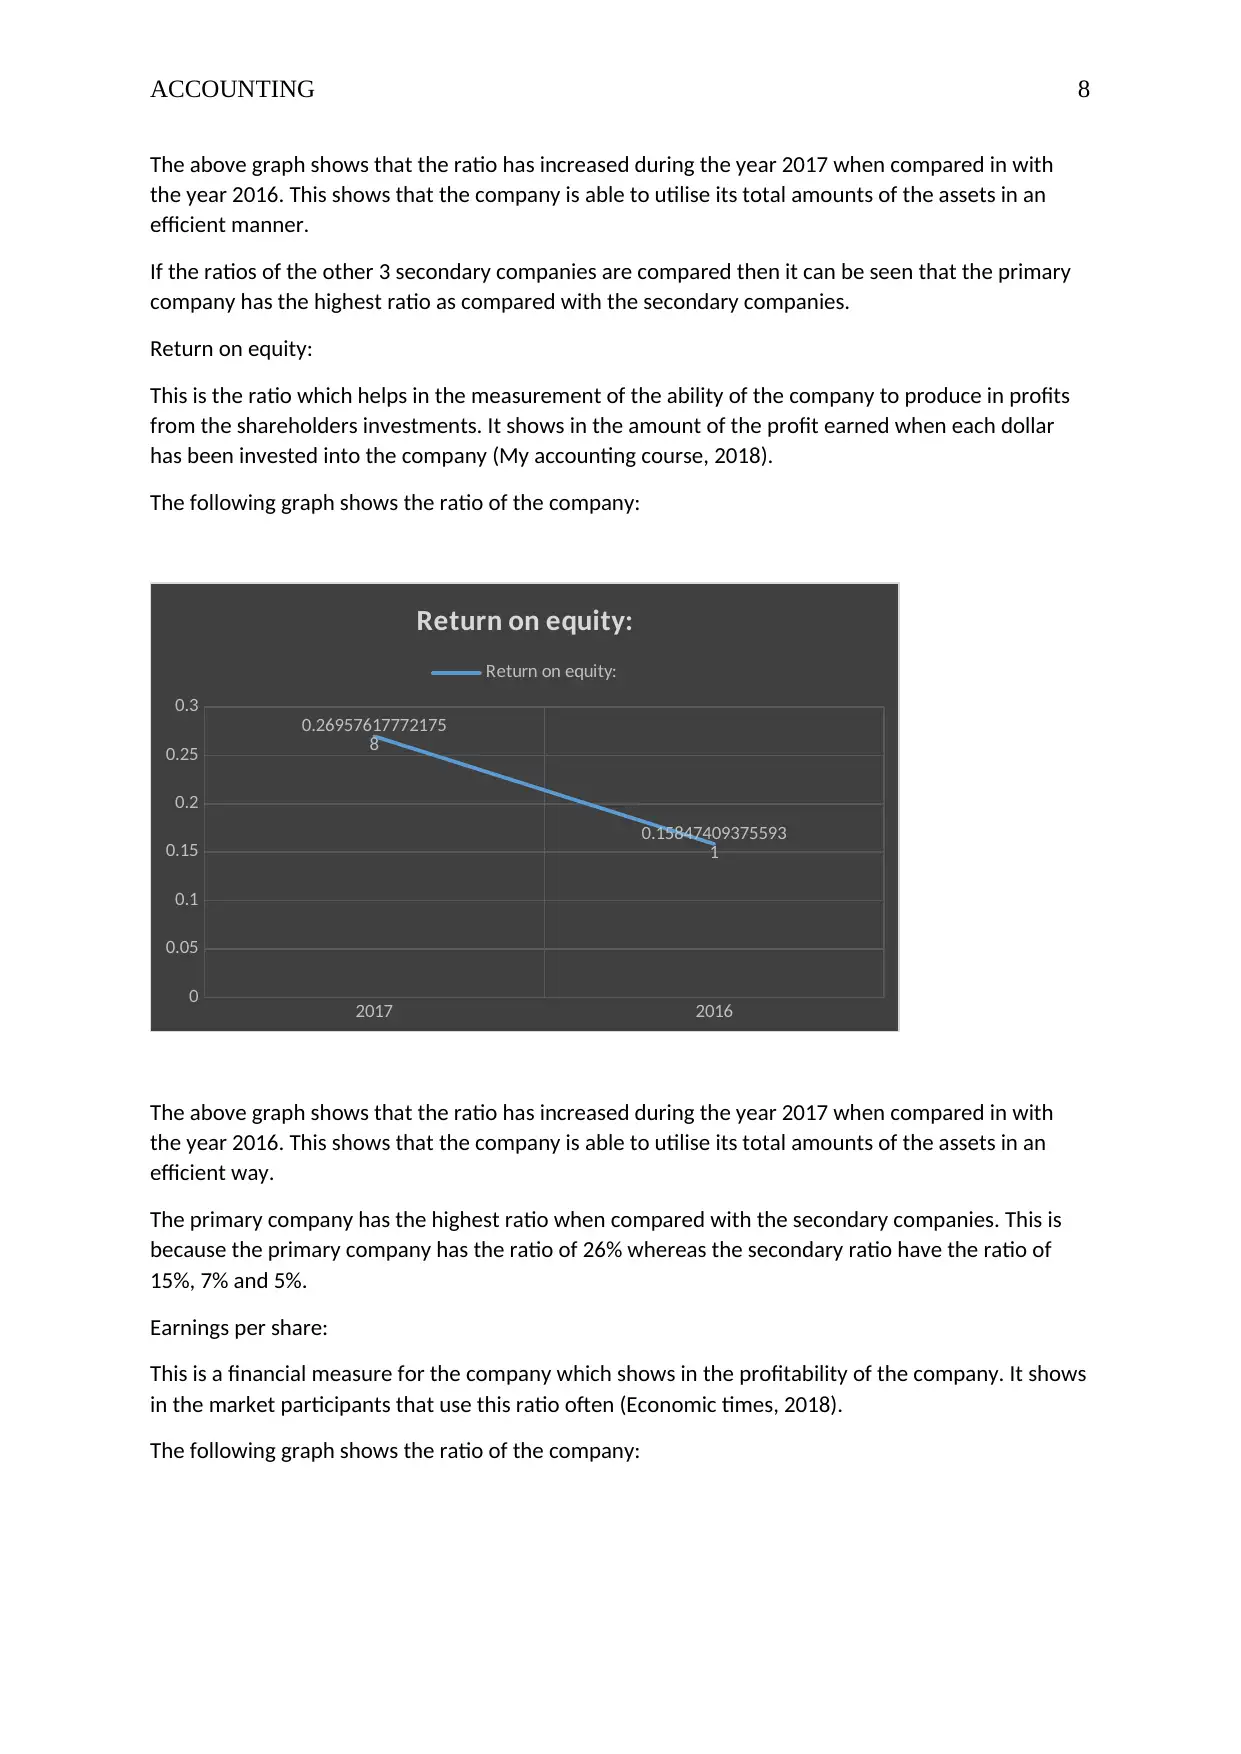
Return on equity:
This is the ratio which helps in the measurement of the ability of the company to produce in profits
from the shareholders investments. It shows in the amount of the profit earned when each dollar
has been invested into the company (My accounting course, 2018).
The following graph shows the ratio of the company:
2017 2016
0
0.05
0.1
0.15
0.2
0.25
0.3
0.26957617772175
8
0.15847409375593
1
Return on equity:
Return on equity:
The above graph shows that the ratio has increased during the year 2017 when compared in with
the year 2016. This shows that the company is able to utilise its total amounts of the assets in an
efficient way.
The primary company has the highest ratio when compared with the secondary companies. This is
because the primary company has the ratio of 26% whereas the secondary ratio have the ratio of
15%, 7% and 5%.
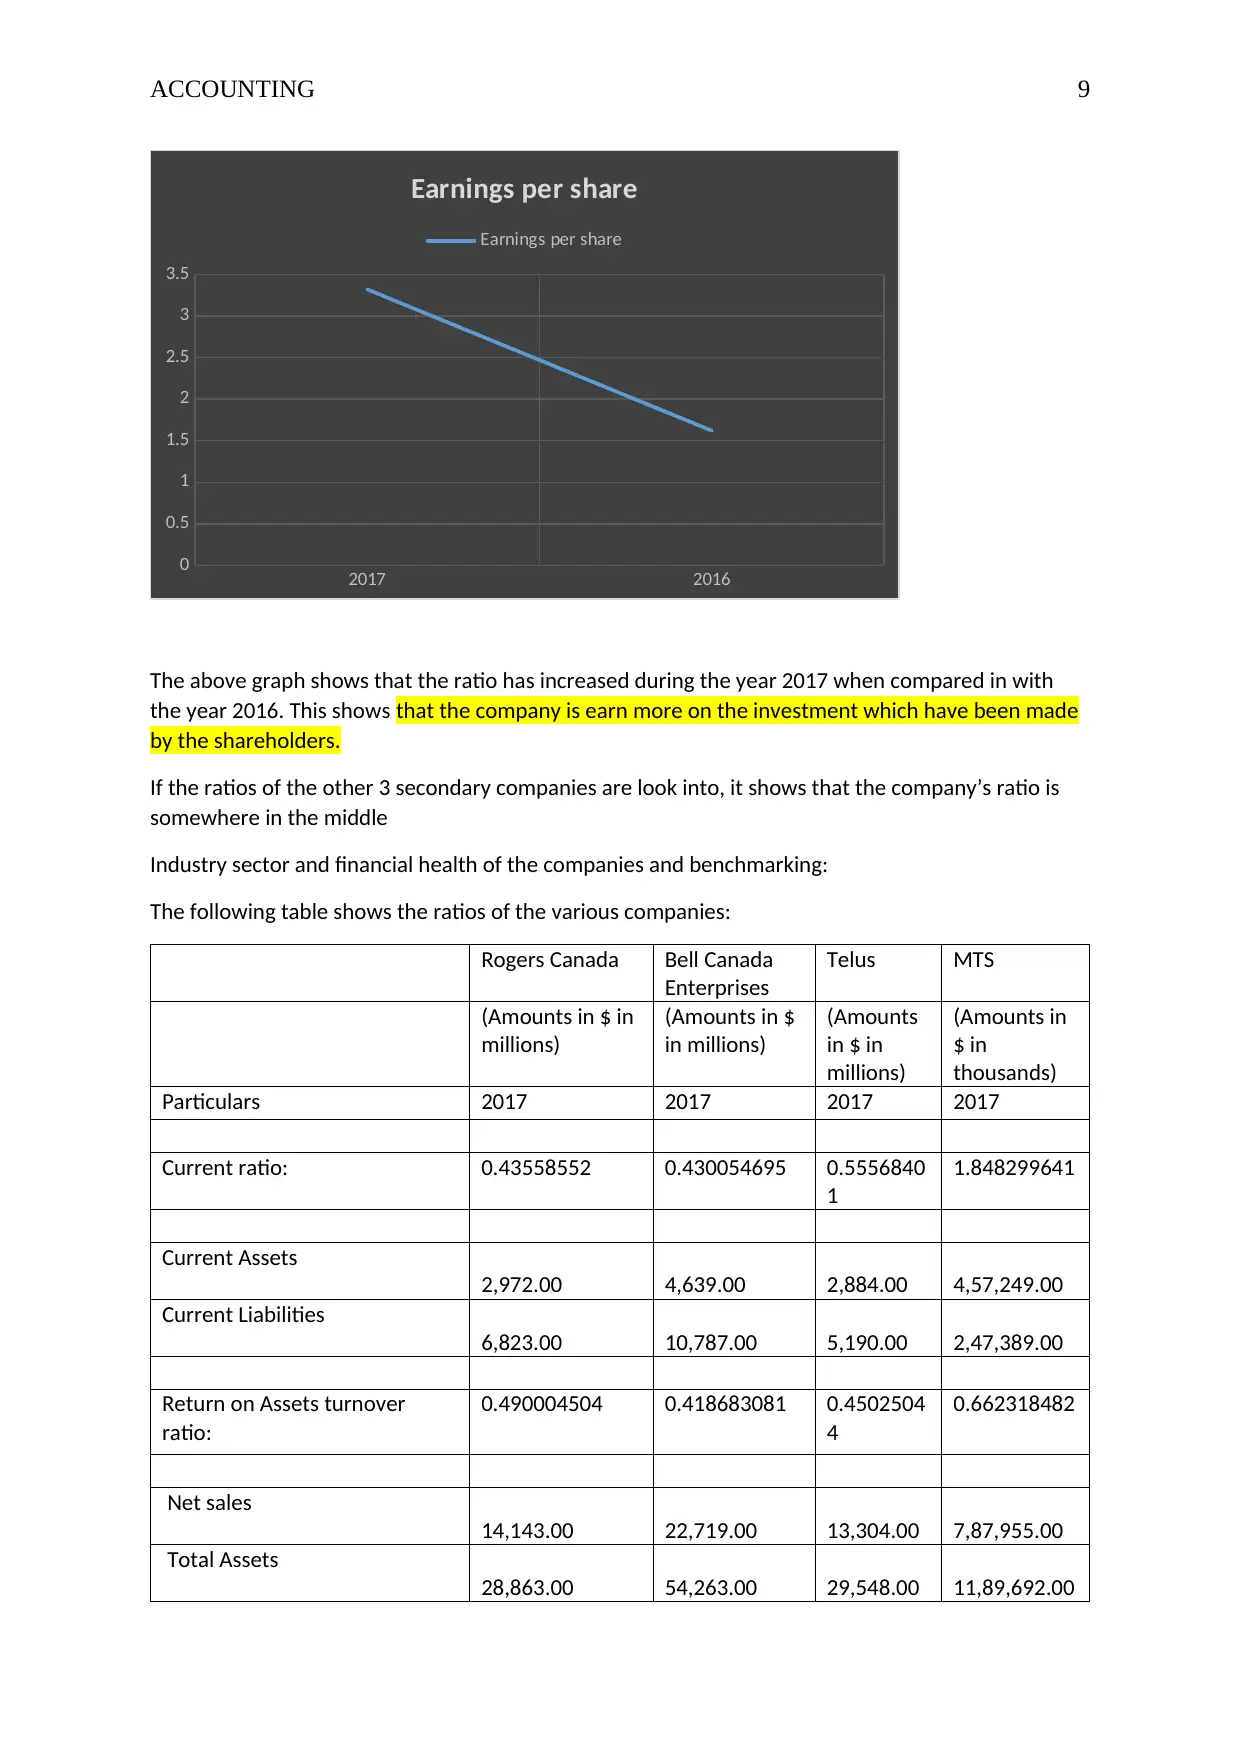
Earnings per share:
This is a financial measure for the company which shows in the profitability of the company. It shows
in the market participants that use this ratio often (Economic times, 2018).
The following graph shows the ratio of the company:
The above graph shows that the ratio has increased during the year 2017 when compared in with
the year 2016. This shows that the company is able to utilise its total amounts of the assets in an
efficient manner.
If the ratios of the other 3 secondary companies are compared then it can be seen that the primary
company has the highest ratio as compared with the secondary companies.
Return on equity:
This is the ratio which helps in the measurement of the ability of the company to produce in profits
from the shareholders investments. It shows in the amount of the profit earned when each dollar
has been invested into the company (My accounting course, 2018).
The following graph shows the ratio of the company:
2017 2016
0
0.05
0.1
0.15
0.2
0.25
0.3
0.26957617772175
8
0.15847409375593
1
Return on equity:
Return on equity:
The above graph shows that the ratio has increased during the year 2017 when compared in with
the year 2016. This shows that the company is able to utilise its total amounts of the assets in an
efficient way.
The primary company has the highest ratio when compared with the secondary companies. This is
because the primary company has the ratio of 26% whereas the secondary ratio have the ratio of
15%, 7% and 5%.
Earnings per share:
This is a financial measure for the company which shows in the profitability of the company. It shows
in the market participants that use this ratio often (Economic times, 2018).
The following graph shows the ratio of the company:
ACCOUNTING 9
2017 2016
0
0.5
1
1.5
2
2.5
3
3.5
Earnings per share
Earnings per share
The above graph shows that the ratio has increased during the year 2017 when compared in with
the year 2016. This shows that the company is earn more on the investment which have been made
by the shareholders.
If the ratios of the other 3 secondary companies are look into, it shows that the company’s ratio is
somewhere in the middle
Industry sector and financial health of the companies and benchmarking:
The following table shows the ratios of the various companies:
Rogers Canada Bell Canada
Enterprises
Telus MTS
(Amounts in $ in
millions)
(Amounts in $
in millions)
(Amounts
in $ in
millions)
(Amounts in
$ in
thousands)
Particulars 2017 2017 2017 2017
Current ratio: 0.43558552 0.430054695 0.5556840
1
1.848299641
Current Assets
2,972.00 4,639.00 2,884.00 4,57,249.00
Current Liabilities
6,823.00 10,787.00 5,190.00 2,47,389.00
Return on Assets turnover
ratio:
0.490004504 0.418683081 0.4502504
4
0.662318482
Net sales
14,143.00 22,719.00 13,304.00 7,87,955.00
Total Assets
28,863.00 54,263.00 29,548.00 11,89,692.00
⊘ This is a preview!⊘
Do you want full access?
Subscribe today to unlock all pages.
Trusted by 1+ million students worldwide
ACCOUNTING 10
Net profit ratio: 0.120978576 0.130727585 0.1111695
7
0.031834305
Net profit
1,711.00 2,970.00 1,479.00 25,084.00
Net Sales
14,143.00 22,719.00 13,304.00 7,87,955.00
Return on equity: 0.269576178 0.152440589 0.1789906
8
0.058501272
Net profit
1,711.00 2,970.00 1,479.00 25,084.00
Shareholders’ equity
6,347.00 19,483.00 8,263.00 4,28,777.00
Earnings per share 3.32 3.12 593 1.32
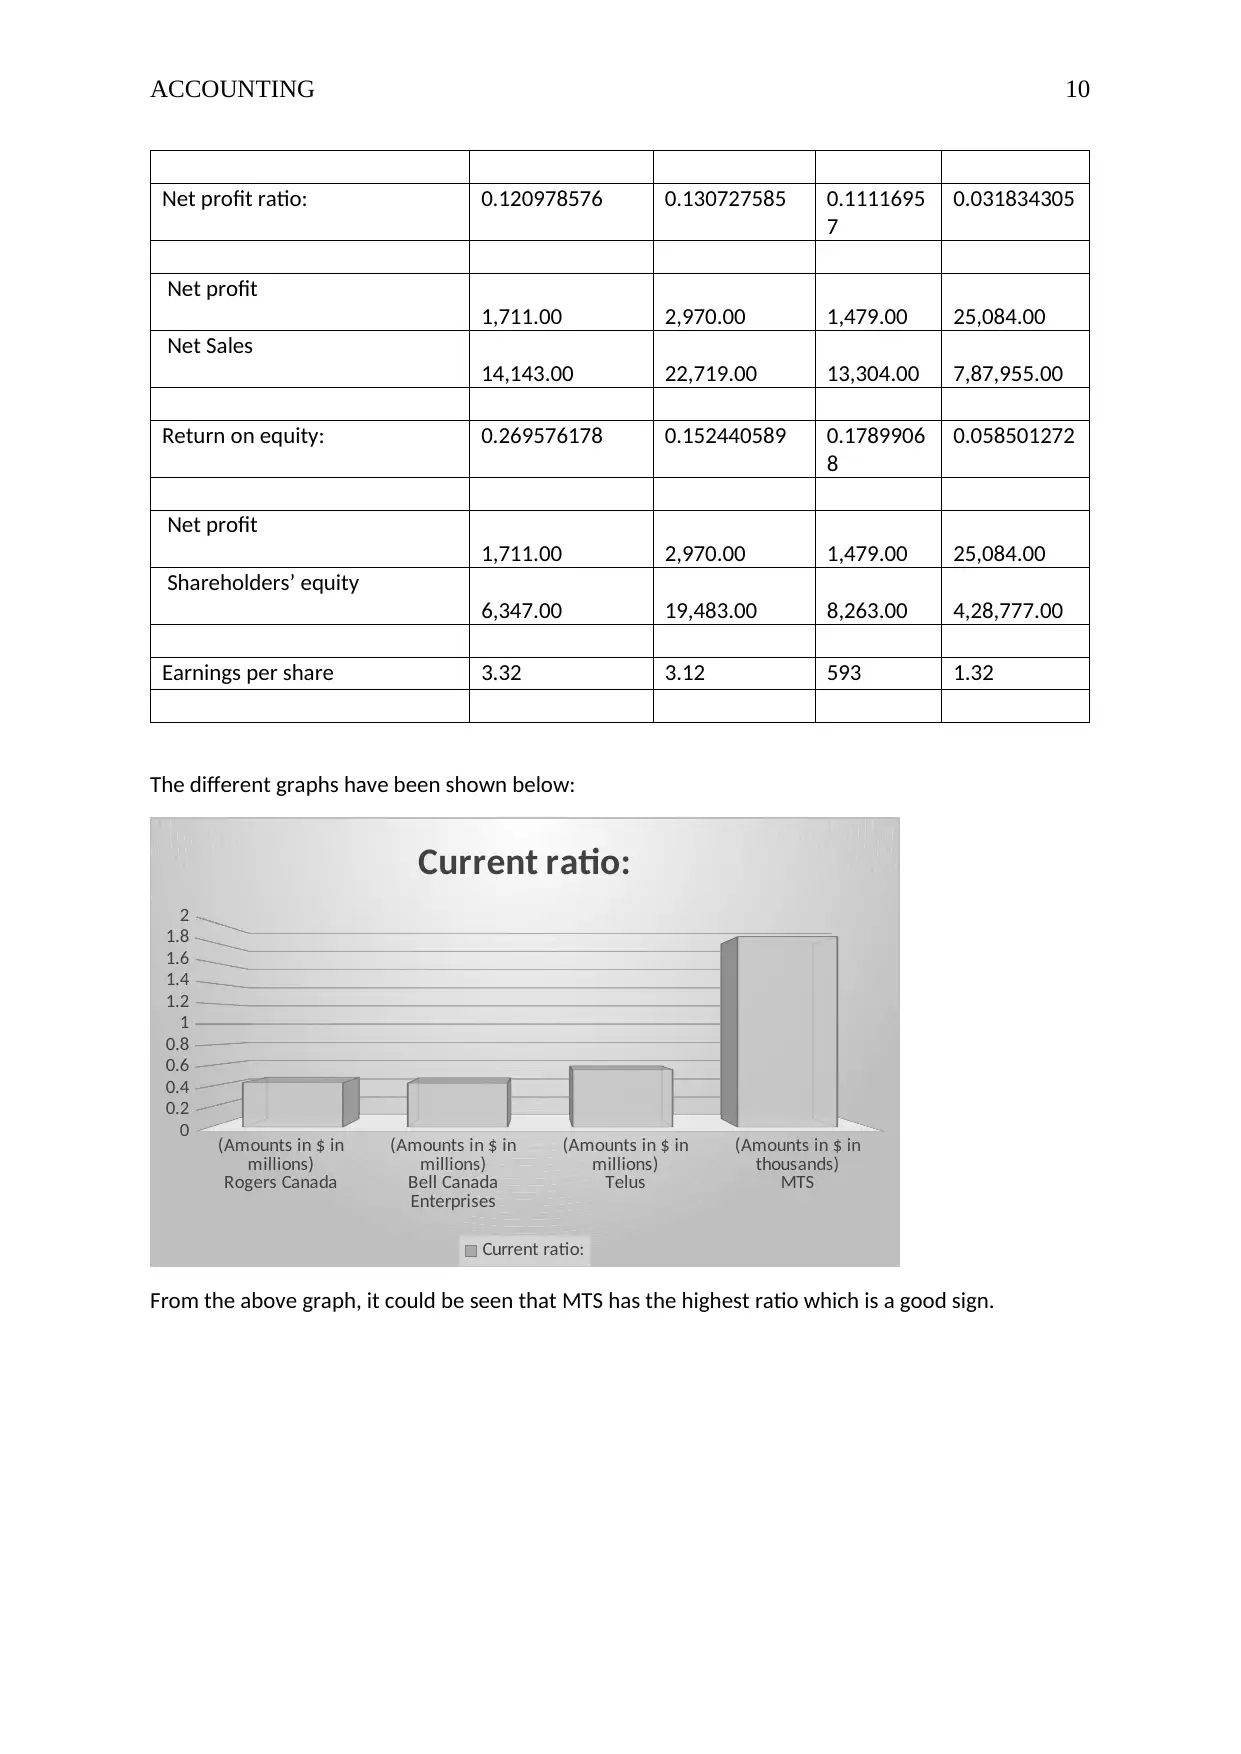
The different graphs have been shown below:
(Amounts in $ in
millions) (Amounts in $ in
millions) (Amounts in $ in
millions) (Amounts in $ in
thousands)
Rogers Canada Bell Canada
Enterprises Telus MTS
0
0.2
0.4
0.6
0.8
1
1.2
1.4
1.6
1.8
2
Current ratio:
Current ratio:
From the above graph, it could be seen that MTS has the highest ratio which is a good sign.
Net profit ratio: 0.120978576 0.130727585 0.1111695
7
0.031834305
Net profit
1,711.00 2,970.00 1,479.00 25,084.00
Net Sales
14,143.00 22,719.00 13,304.00 7,87,955.00
Return on equity: 0.269576178 0.152440589 0.1789906
8
0.058501272
Net profit
1,711.00 2,970.00 1,479.00 25,084.00
Shareholders’ equity
6,347.00 19,483.00 8,263.00 4,28,777.00
Earnings per share 3.32 3.12 593 1.32
The different graphs have been shown below:
(Amounts in $ in
millions) (Amounts in $ in
millions) (Amounts in $ in
millions) (Amounts in $ in
thousands)
Rogers Canada Bell Canada
Enterprises Telus MTS
0
0.2
0.4
0.6
0.8
1
1.2
1.4
1.6
1.8
2
Current ratio:
Current ratio:
From the above graph, it could be seen that MTS has the highest ratio which is a good sign.
Paraphrase This Document
Need a fresh take? Get an instant paraphrase of this document with our AI Paraphraser
ACCOUNTING 11
(Amounts in $ in
millions) (Amounts in $ in
millions) (Amounts in $ in
millions) (Amounts in $ in
thousands)
Rogers Canada Bell Canada
Enterprises Telus MTS
0
100
200
300
400
500
600
Earnings per share
Earnings per share
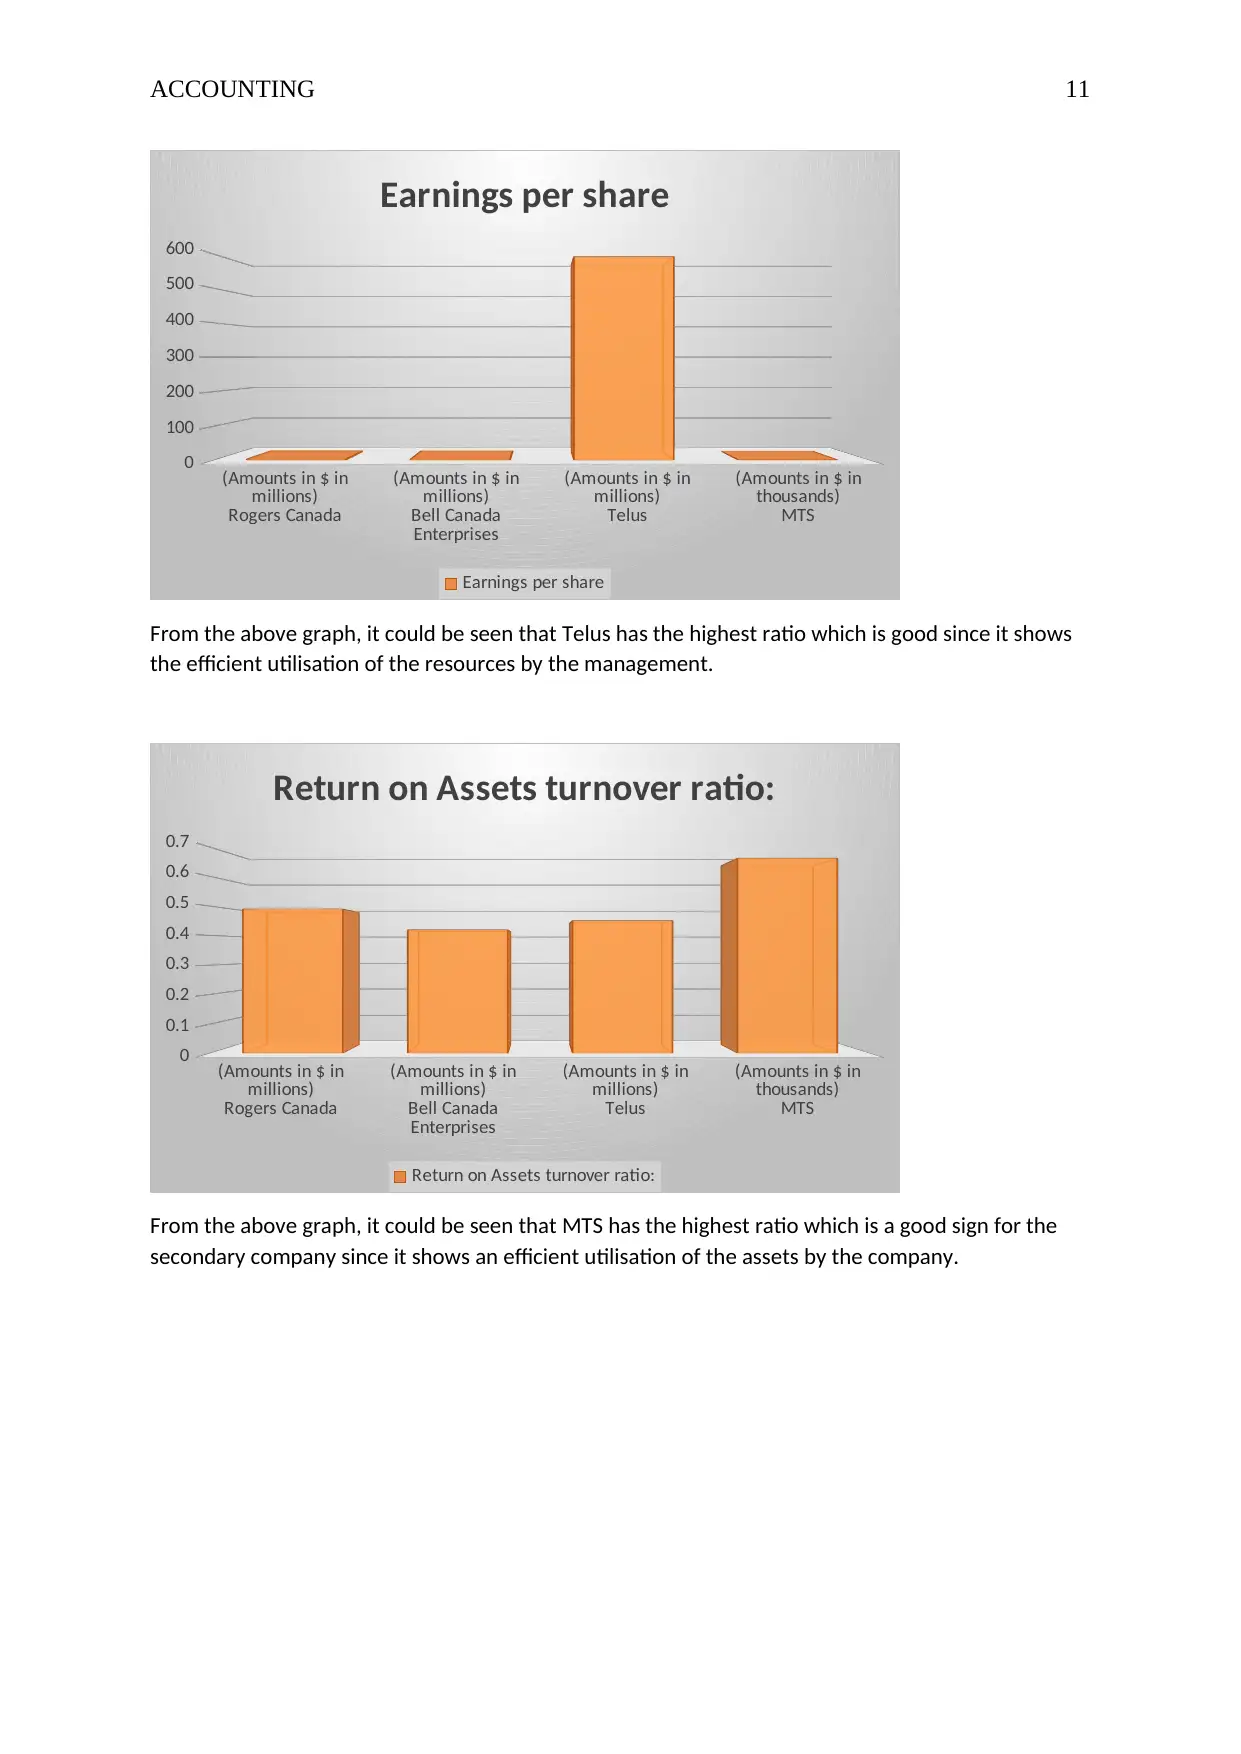
From the above graph, it could be seen that Telus has the highest ratio which is good since it shows
the efficient utilisation of the resources by the management.
(Amounts in $ in
millions) (Amounts in $ in
millions) (Amounts in $ in
millions) (Amounts in $ in
thousands)
Rogers Canada Bell Canada
Enterprises Telus MTS
0
0.1
0.2
0.3
0.4
0.5
0.6
0.7
Return on Assets turnover ratio:
Return on Assets turnover ratio:
From the above graph, it could be seen that MTS has the highest ratio which is a good sign for the
secondary company since it shows an efficient utilisation of the assets by the company.
(Amounts in $ in
millions) (Amounts in $ in
millions) (Amounts in $ in
millions) (Amounts in $ in
thousands)
Rogers Canada Bell Canada
Enterprises Telus MTS
0
100
200
300
400
500
600
Earnings per share
Earnings per share
From the above graph, it could be seen that Telus has the highest ratio which is good since it shows
the efficient utilisation of the resources by the management.
(Amounts in $ in
millions) (Amounts in $ in
millions) (Amounts in $ in
millions) (Amounts in $ in
thousands)
Rogers Canada Bell Canada
Enterprises Telus MTS
0
0.1
0.2
0.3
0.4
0.5
0.6
0.7
Return on Assets turnover ratio:
Return on Assets turnover ratio:
From the above graph, it could be seen that MTS has the highest ratio which is a good sign for the
secondary company since it shows an efficient utilisation of the assets by the company.
ACCOUNTING 12
(Amounts in $ in
millions) (Amounts in $ in
millions) (Amounts in $ in
millions) (Amounts in $ in
thousands)
Rogers Canada Bell Canada
Enterprises Telus MTS
0
0.05
0.1
0.15
0.2
0.25
0.3
Return on equity:
Return on equity:
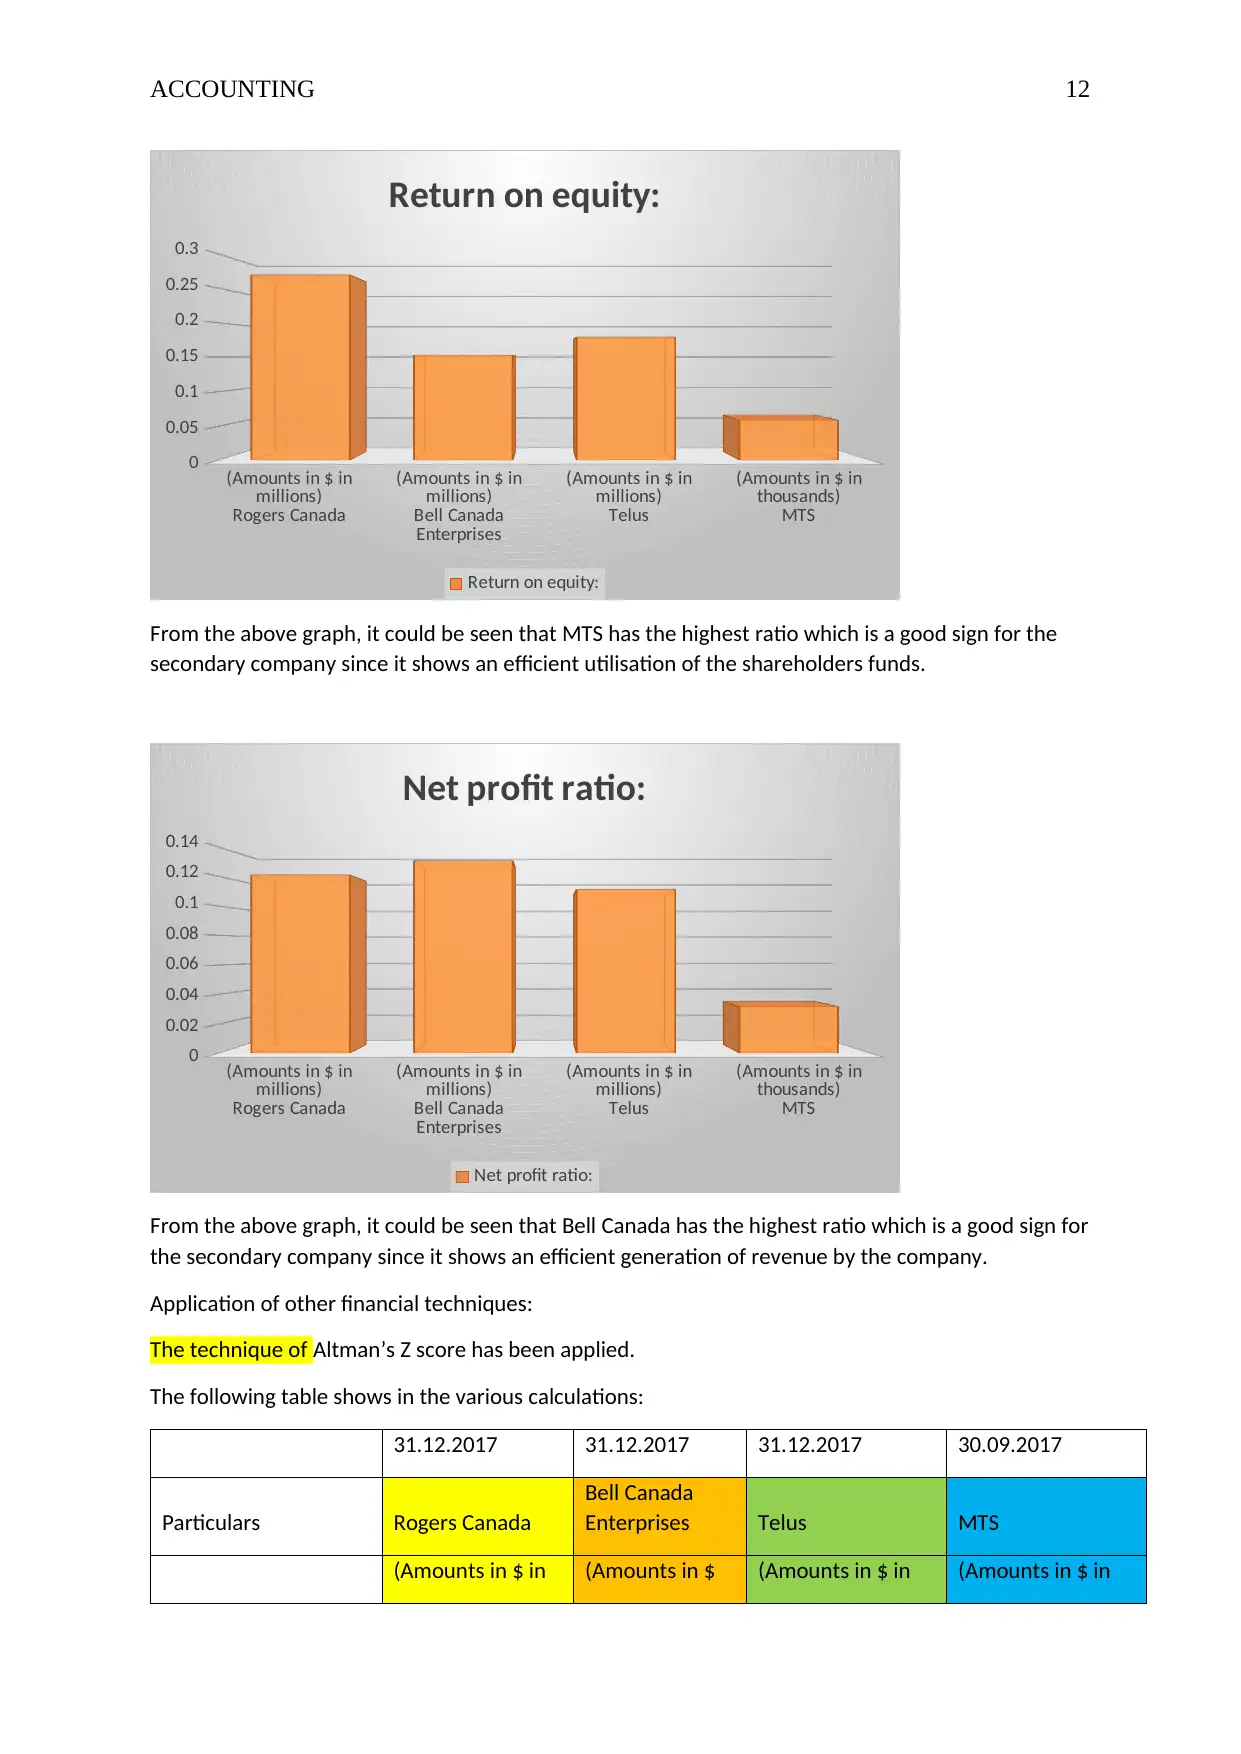
From the above graph, it could be seen that MTS has the highest ratio which is a good sign for the
secondary company since it shows an efficient utilisation of the shareholders funds.
(Amounts in $ in
millions) (Amounts in $ in
millions) (Amounts in $ in
millions) (Amounts in $ in
thousands)
Rogers Canada Bell Canada
Enterprises Telus MTS
0
0.02
0.04
0.06
0.08
0.1
0.12
0.14
Net profit ratio:
Net profit ratio:
From the above graph, it could be seen that Bell Canada has the highest ratio which is a good sign for
the secondary company since it shows an efficient generation of revenue by the company.
Application of other financial techniques:
The technique of Altman’s Z score has been applied.
The following table shows in the various calculations:
31.12.2017 31.12.2017 31.12.2017 30.09.2017
Particulars Rogers Canada
Bell Canada
Enterprises Telus MTS
(Amounts in $ in (Amounts in $ (Amounts in $ in (Amounts in $ in
(Amounts in $ in
millions) (Amounts in $ in
millions) (Amounts in $ in
millions) (Amounts in $ in
thousands)
Rogers Canada Bell Canada
Enterprises Telus MTS
0
0.05
0.1
0.15
0.2
0.25
0.3
Return on equity:
Return on equity:
From the above graph, it could be seen that MTS has the highest ratio which is a good sign for the
secondary company since it shows an efficient utilisation of the shareholders funds.
(Amounts in $ in
millions) (Amounts in $ in
millions) (Amounts in $ in
millions) (Amounts in $ in
thousands)
Rogers Canada Bell Canada
Enterprises Telus MTS
0
0.02
0.04
0.06
0.08
0.1
0.12
0.14
Net profit ratio:
Net profit ratio:
From the above graph, it could be seen that Bell Canada has the highest ratio which is a good sign for
the secondary company since it shows an efficient generation of revenue by the company.
Application of other financial techniques:
The technique of Altman’s Z score has been applied.
The following table shows in the various calculations:
31.12.2017 31.12.2017 31.12.2017 30.09.2017
Particulars Rogers Canada
Bell Canada
Enterprises Telus MTS
(Amounts in $ in (Amounts in $ (Amounts in $ in (Amounts in $ in
⊘ This is a preview!⊘
Do you want full access?
Subscribe today to unlock all pages.
Trusted by 1+ million students worldwide
1 out of 17
Related Documents


Your All-in-One AI-Powered Toolkit for Academic Success.
+13062052269
info@desklib.com
Available 24*7 on WhatsApp / Email
![[object Object]](/_next/static/media/star-bottom.7253800d.svg)
Unlock your academic potential
Copyright © 2020–2026 A2Z Services. All Rights Reserved. Developed and managed by ZUCOL.