Comprehensive Community Assessment Report: Roma, Queensland, Australia
VerifiedAdded on 2021/04/17
|12
|2794
|259
Report
AI Summary
This report presents a comprehensive community assessment of the Roma community in Queensland, Australia. It begins with an overview of the community's characteristics, including gender, age, marital status, education, country of birth, religious affiliation, language, and employment status. The assessment utilizes data from the 2016 census to analyze these factors and their relationship to community health. The study identifies key community needs and assets, focusing on education levels, unemployment, homelessness, family processes, and religious affiliation. The report discusses the significant trends obtained from the data collected, highlighting the socioeconomic factors and their impact on health outcomes. The findings reveal that while the Roma community has a high level of education and income, it is at risk for lifestyle diseases due to potential behavioral factors like poor nutrition, lack of exercise, and stress. The report then outlines a six-step community assessment process, including defining the scope, gathering data, determining key findings, setting priorities, and creating an action plan. The action plan aims to address human, process, structural, and institutional problems to prevent lifestyle illnesses within the community by promoting healthier eating habits, stress coping mechanisms, cessation of substance use, and increased physical exercise. The report emphasizes the importance of community engagement and strategic planning to improve the quality of life for Roma residents.
RUNNING HEADER: ROMA COMMUNITY ASSESSMENT 1
Roma Community Assessment.
Students name
Institutional Affiliation
Roma Community Assessment.
Students name
Institutional Affiliation
Paraphrase This Document
Need a fresh take? Get an instant paraphrase of this document with our AI Paraphraser
COMMUNITY ASSESSMENT 2
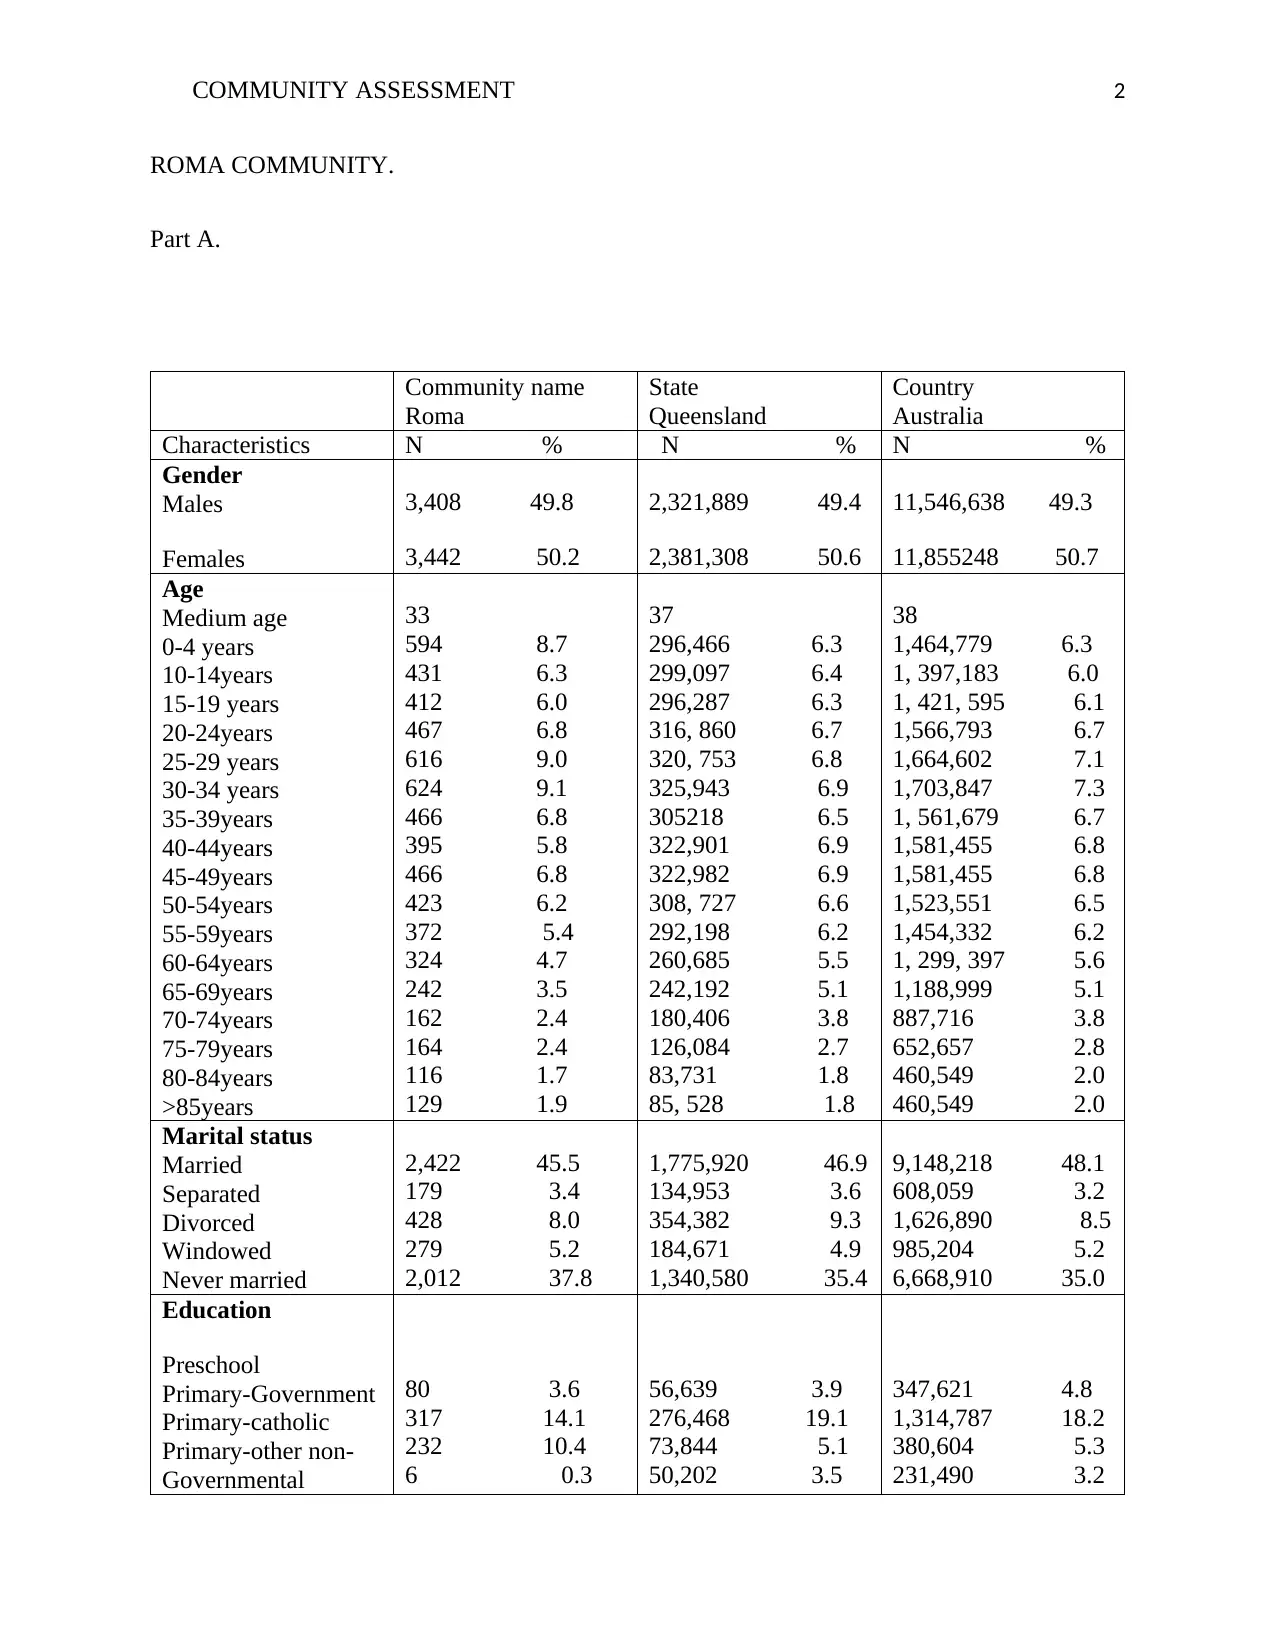
ROMA COMMUNITY.
Part A.
Community name
Roma
State
Queensland
Country
Australia
Characteristics N % N % N %
Gender
Males
Females
3,408 49.8
3,442 50.2
2,321,889 49.4
2,381,308 50.6
11,546,638 49.3
11,855248 50.7
Age
Medium age
0-4 years
10-14years
15-19 years
20-24years
25-29 years
30-34 years
35-39years
40-44years
45-49years
50-54years
55-59years
60-64years
65-69years
70-74years
75-79years
80-84years
>85years
33
594 8.7
431 6.3
412 6.0
467 6.8
616 9.0
624 9.1
466 6.8
395 5.8
466 6.8
423 6.2
372 5.4
324 4.7
242 3.5
162 2.4
164 2.4
116 1.7
129 1.9
37
296,466 6.3
299,097 6.4
296,287 6.3
316, 860 6.7
320, 753 6.8
325,943 6.9
305218 6.5
322,901 6.9
322,982 6.9
308, 727 6.6
292,198 6.2
260,685 5.5
242,192 5.1
180,406 3.8
126,084 2.7
83,731 1.8
85, 528 1.8
38
1,464,779 6.3
1, 397,183 6.0
1, 421, 595 6.1
1,566,793 6.7
1,664,602 7.1
1,703,847 7.3
1, 561,679 6.7
1,581,455 6.8
1,581,455 6.8
1,523,551 6.5
1,454,332 6.2
1, 299, 397 5.6
1,188,999 5.1
887,716 3.8
652,657 2.8
460,549 2.0
460,549 2.0
Marital status
Married
Separated
Divorced
Windowed
Never married
2,422 45.5
179 3.4
428 8.0
279 5.2
2,012 37.8
1,775,920 46.9
134,953 3.6
354,382 9.3
184,671 4.9
1,340,580 35.4
9,148,218 48.1
608,059 3.2
1,626,890 8.5
985,204 5.2
6,668,910 35.0
Education
Preschool
Primary-Government
Primary-catholic
Primary-other non-
Governmental
80 3.6
317 14.1
232 10.4
6 0.3
56,639 3.9
276,468 19.1
73,844 5.1
50,202 3.5
347,621 4.8
1,314,787 18.2
380,604 5.3
231,490 3.2
COMMUNITY ASSESSMENT 3
Secondary-
Government
Secondary-catholic
Secondary-other non-
Government
Technical or further
education institution.
University or tertiary
institution.
Others
230 10.3
164 7.3
14 0.6
136 6.1
144 6.4
39 1.7
176,138 12.2
63,080 4.4
58,927 4.1
76,992 5.3
213,221 14.8
37,517 2.6
827,505 11.5
338,384 4.7
280,618 3.9
424,869 5.9
1,160,626 16.1
198,383 2.8
Level of the highest
education
attainment
Bachelor Degree
level and above
Advanced Diploma
and Diploma level
Certificate level IV
Certificate level III
Year 12
Year 10
Year 9 or below
No education
attainment
714 13.4
383 7.2
188 3.5
898 16.9
704 13.3
806 15.2
443 8.3
23 0.4
693,412 18.3
330619 8.7
111,975 3.0
576,295 15.2
625,959 16.5
488,554 12.9
275,376 7.3
15,700 0.4
4,1818,406 22.0
1,687,893 8.9
551,767 2.9
2,994,097 15.7
2,442,203 12.8
2,054,331 10.8
1,529,897 8.0
145,844 0.8
Country of birth
Australia
Philippines
New Zealand
England
India
South AFrica
5,347 78.2
164 2.4
107 1.6
72 1.1
72 1.1
34 0.5
3,343,657 71.1
39,661 0.8
201, 206 4.3
180,775 3.8
49,145 1.0
40,131 0.9
15,614,835 66.7
232,382 1.0
518,466 2.2
907,570 3.9
455,389 1.9
162,449 0.7
Religious affiliation
Catholic
Anglican
No religion
1,870 27.3
1,489 21.8
1,260 18.4
1,022,514 21.7
719,718 15.3
1,374,427 29.2
5,291,834 22.6
3,101,185 13.3
6,933,708 29.6
Language
English
Tagalog
Filipino
Punjabi
Mandarin
Afrikaans
5,687 83.1
99 1.4
49 0.7
47 0.7
26 0.4
16 0.2
3,820,632 81.2
16,999 0.4
11,371 0.2
17,991 0.4
69,474 1.5
12,525 0.3
17,020,417 72.7
111,275 0.5
71,220 0.3
132, 496 0.6
596,711 2.5
43,741 0.2
⊘ This is a preview!⊘
Do you want full access?
Subscribe today to unlock all pages.
Trusted by 1+ million students worldwide
COMMUNITY ASSESSMENT 4
Employment
Work full time
Work part-time
Away from work
unemployed
2,370 67.4
805 22.9
196 5.6
144 4.1
1,33,333,193 57.7
691,751 29.9
111,509 4.8
175,665 7.6
6,623,065 57.7
3,491,503 30.4
569,276 5.0
787,452 6.9
Family composition
Couple family
without children.
Couple family with
children
One parent family
Other family
642 39.4
726 44.5
247 15.2
15 0.9
481,451 39.4
518,494 42.5
201,308 16.5
19,898 1.6
2,291,987 27.8
2,716,224 44.7
959, 543 15.8
102,559 1.7
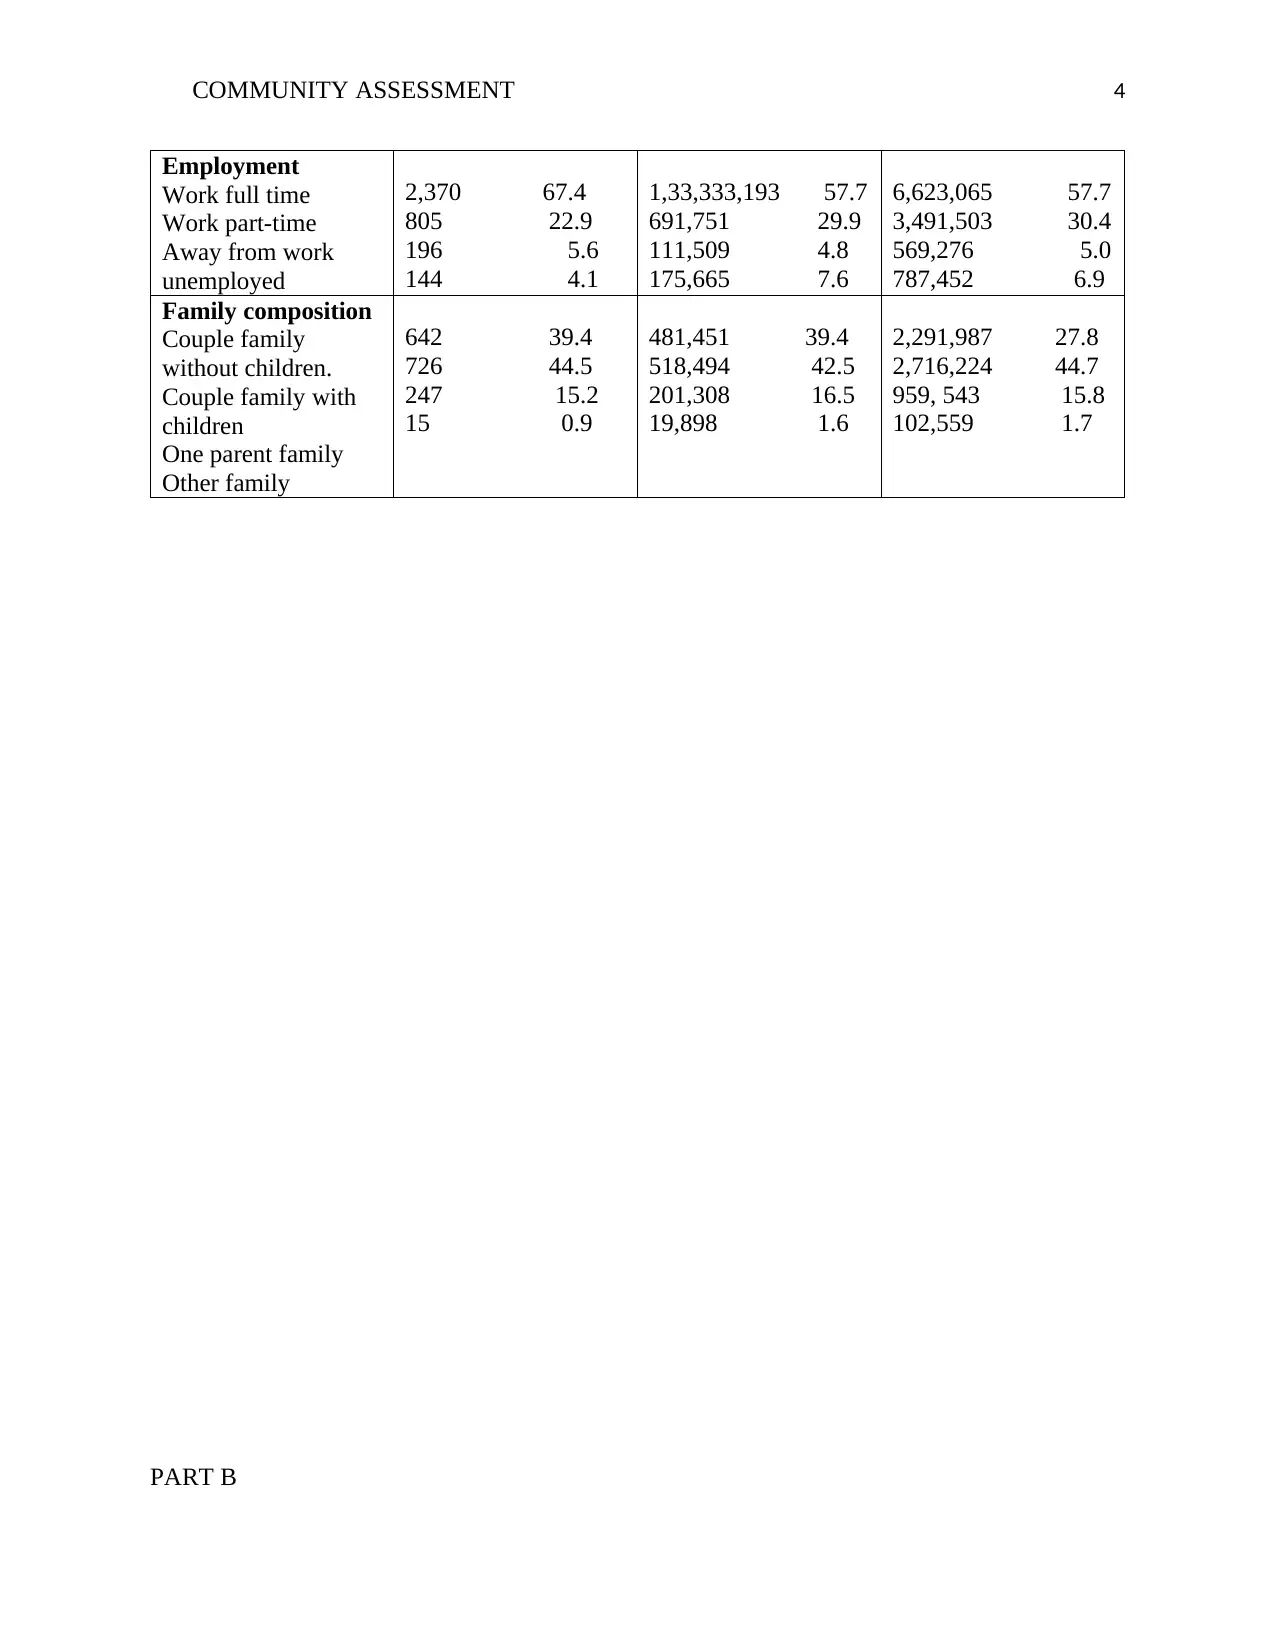
PART B
Employment
Work full time
Work part-time
Away from work
unemployed
2,370 67.4
805 22.9
196 5.6
144 4.1
1,33,333,193 57.7
691,751 29.9
111,509 4.8
175,665 7.6
6,623,065 57.7
3,491,503 30.4
569,276 5.0
787,452 6.9
Family composition
Couple family
without children.
Couple family with
children
One parent family
Other family
642 39.4
726 44.5
247 15.2
15 0.9
481,451 39.4
518,494 42.5
201,308 16.5
19,898 1.6
2,291,987 27.8
2,716,224 44.7
959, 543 15.8
102,559 1.7
PART B
Paraphrase This Document
Need a fresh take? Get an instant paraphrase of this document with our AI Paraphraser
COMMUNITY ASSESSMENT 5
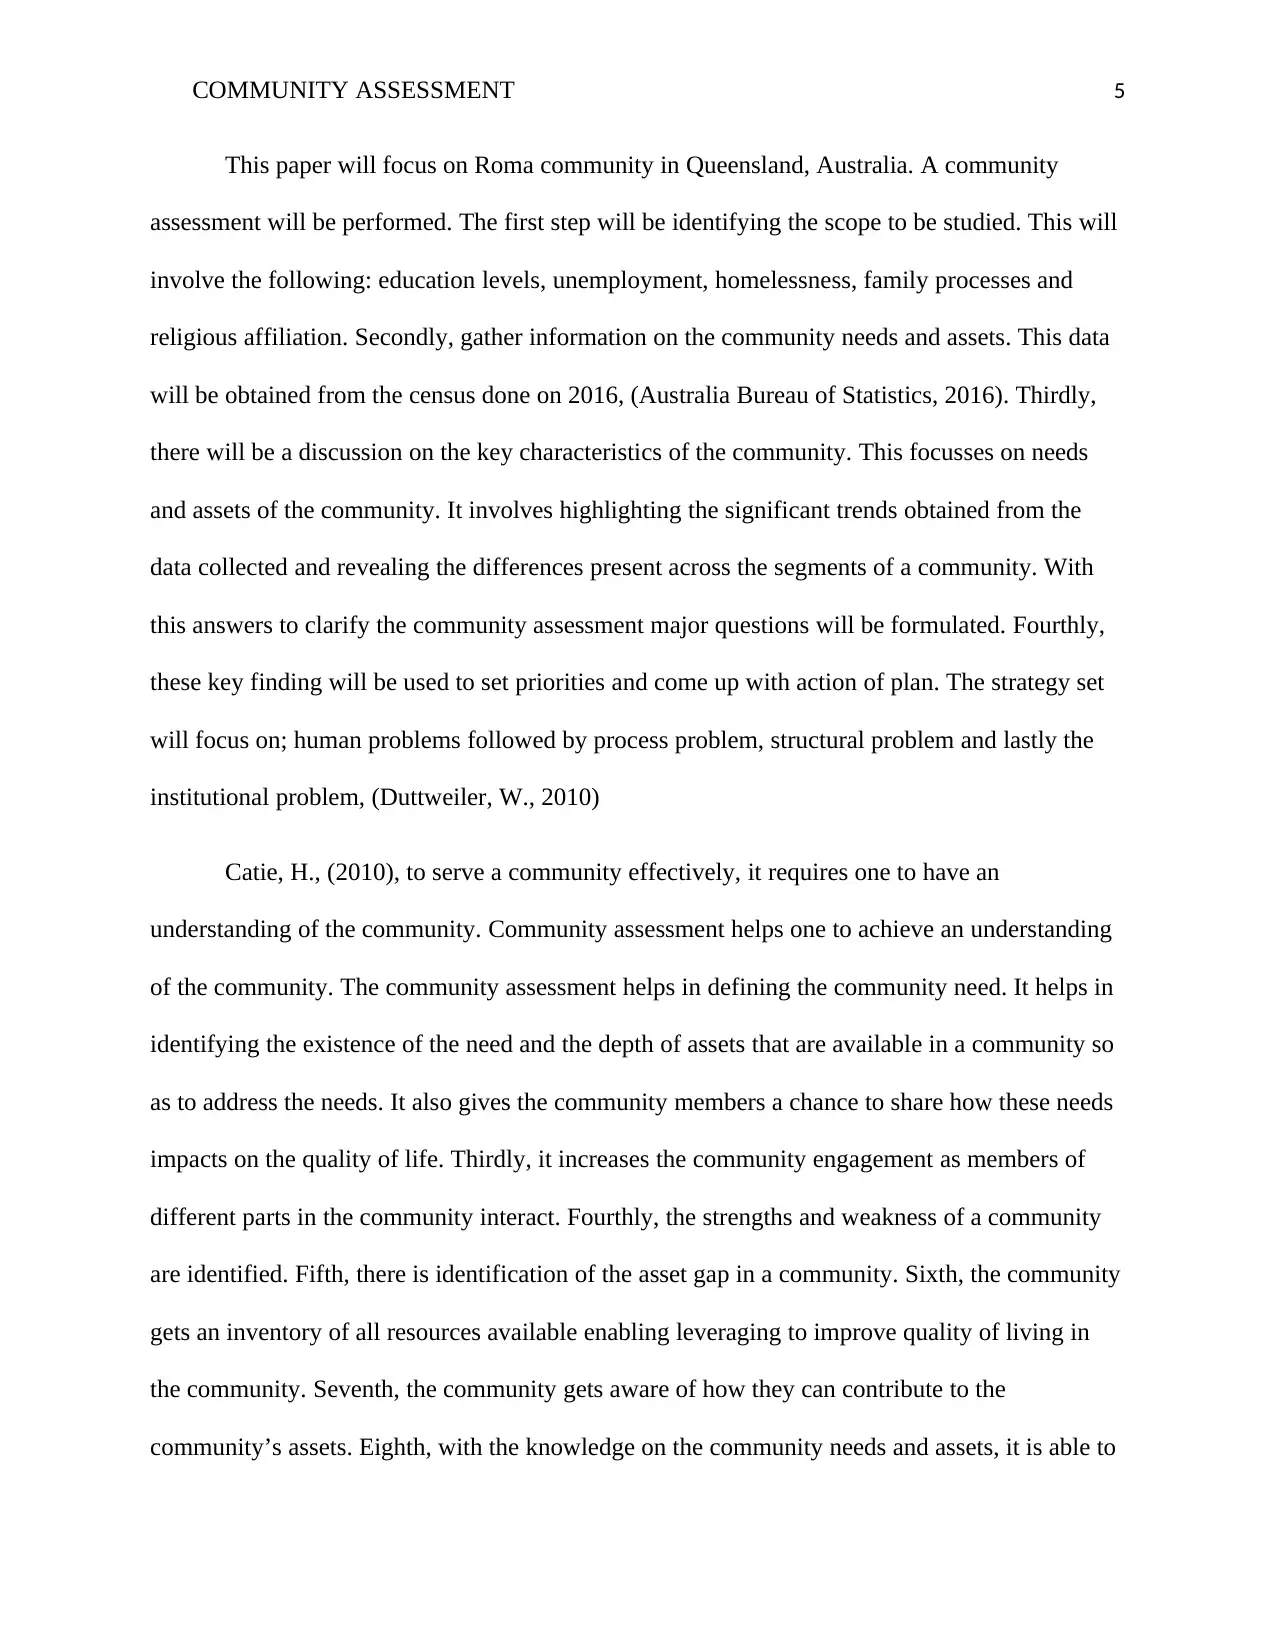
This paper will focus on Roma community in Queensland, Australia. A community
assessment will be performed. The first step will be identifying the scope to be studied. This will
involve the following: education levels, unemployment, homelessness, family processes and
religious affiliation. Secondly, gather information on the community needs and assets. This data
will be obtained from the census done on 2016, (Australia Bureau of Statistics, 2016). Thirdly,
there will be a discussion on the key characteristics of the community. This focusses on needs
and assets of the community. It involves highlighting the significant trends obtained from the
data collected and revealing the differences present across the segments of a community. With
this answers to clarify the community assessment major questions will be formulated. Fourthly,
these key finding will be used to set priorities and come up with action of plan. The strategy set
will focus on; human problems followed by process problem, structural problem and lastly the
institutional problem, (Duttweiler, W., 2010)
Catie, H., (2010), to serve a community effectively, it requires one to have an
understanding of the community. Community assessment helps one to achieve an understanding
of the community. The community assessment helps in defining the community need. It helps in
identifying the existence of the need and the depth of assets that are available in a community so
as to address the needs. It also gives the community members a chance to share how these needs
impacts on the quality of life. Thirdly, it increases the community engagement as members of
different parts in the community interact. Fourthly, the strengths and weakness of a community
are identified. Fifth, there is identification of the asset gap in a community. Sixth, the community
gets an inventory of all resources available enabling leveraging to improve quality of living in
the community. Seventh, the community gets aware of how they can contribute to the
community’s assets. Eighth, with the knowledge on the community needs and assets, it is able to
COMMUNITY ASSESSMENT 6
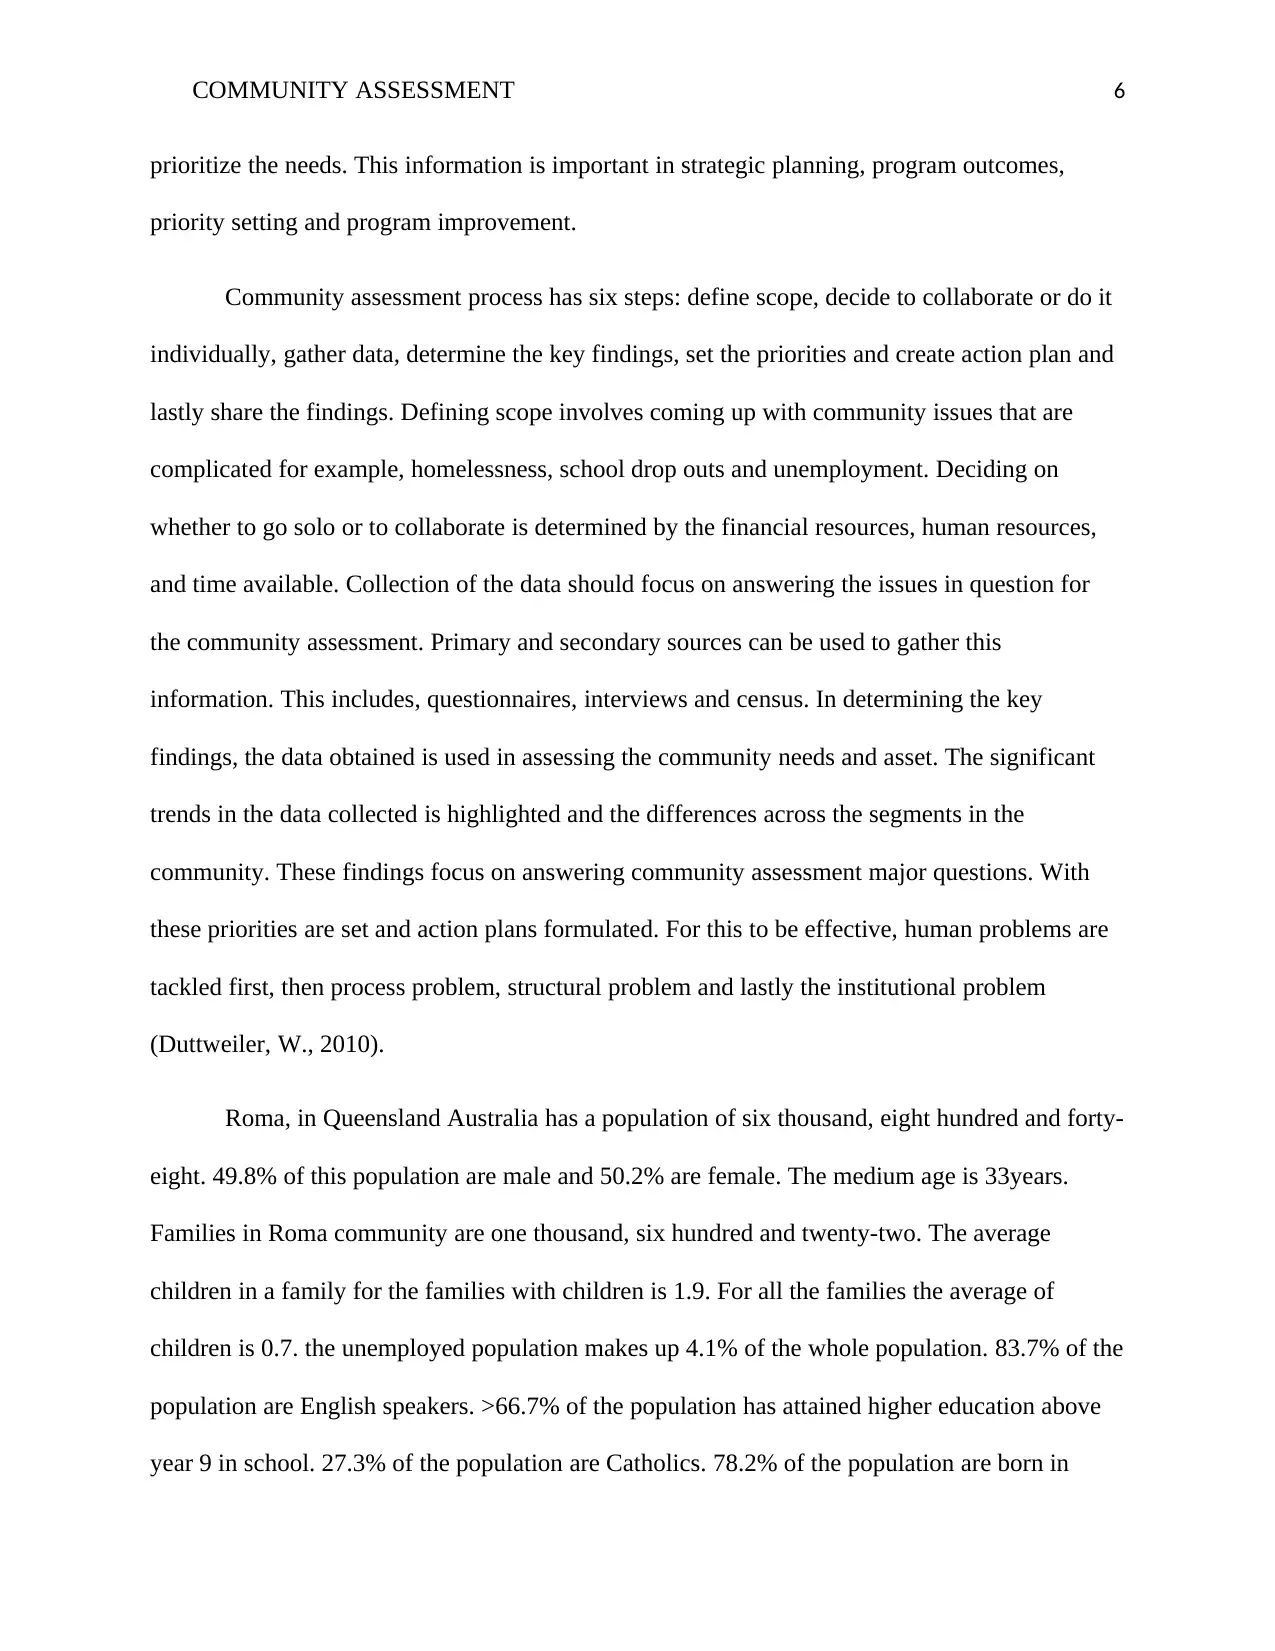
prioritize the needs. This information is important in strategic planning, program outcomes,
priority setting and program improvement.
Community assessment process has six steps: define scope, decide to collaborate or do it
individually, gather data, determine the key findings, set the priorities and create action plan and
lastly share the findings. Defining scope involves coming up with community issues that are
complicated for example, homelessness, school drop outs and unemployment. Deciding on
whether to go solo or to collaborate is determined by the financial resources, human resources,
and time available. Collection of the data should focus on answering the issues in question for
the community assessment. Primary and secondary sources can be used to gather this
information. This includes, questionnaires, interviews and census. In determining the key
findings, the data obtained is used in assessing the community needs and asset. The significant
trends in the data collected is highlighted and the differences across the segments in the
community. These findings focus on answering community assessment major questions. With
these priorities are set and action plans formulated. For this to be effective, human problems are
tackled first, then process problem, structural problem and lastly the institutional problem
(Duttweiler, W., 2010).
Roma, in Queensland Australia has a population of six thousand, eight hundred and forty-
eight. 49.8% of this population are male and 50.2% are female. The medium age is 33years.
Families in Roma community are one thousand, six hundred and twenty-two. The average
children in a family for the families with children is 1.9. For all the families the average of
children is 0.7. the unemployed population makes up 4.1% of the whole population. 83.7% of the
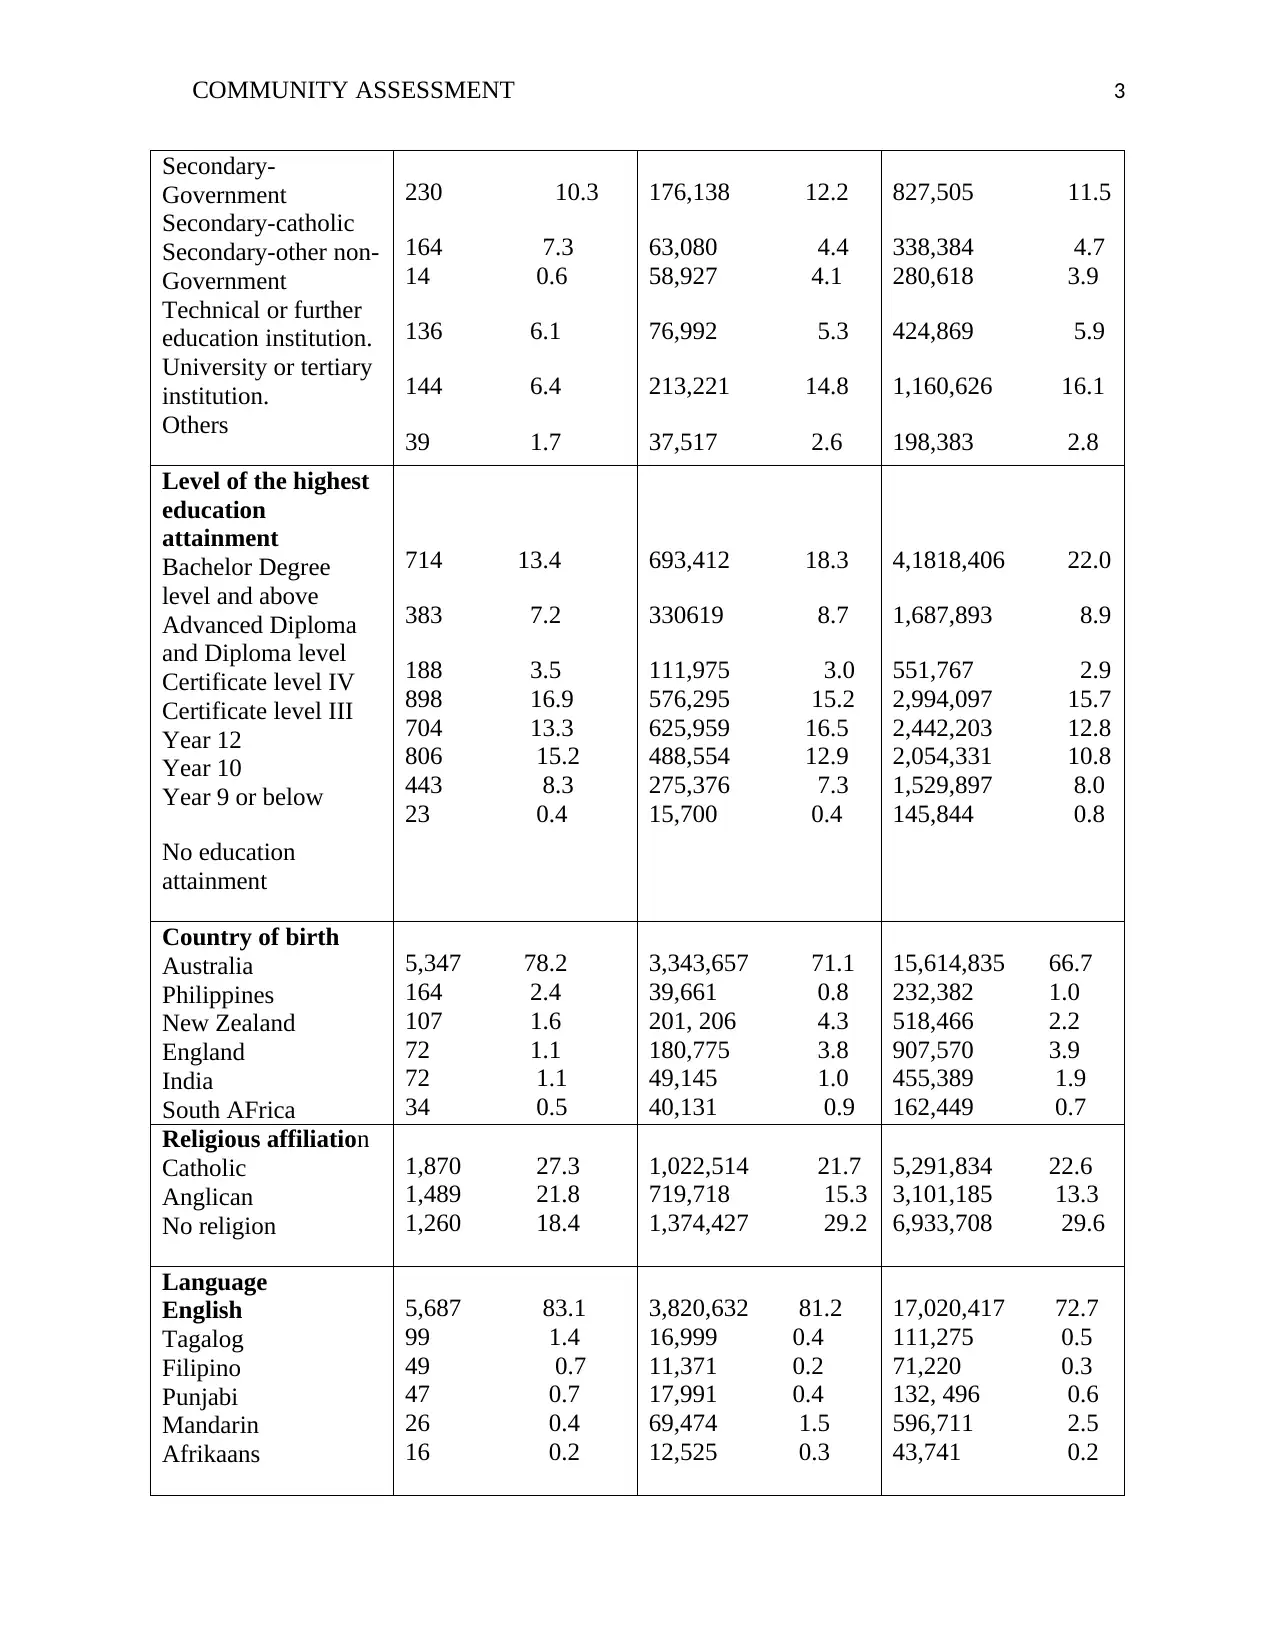
population are English speakers. >66.7% of the population has attained higher education above
year 9 in school. 27.3% of the population are Catholics. 78.2% of the population are born in
prioritize the needs. This information is important in strategic planning, program outcomes,
priority setting and program improvement.
Community assessment process has six steps: define scope, decide to collaborate or do it
individually, gather data, determine the key findings, set the priorities and create action plan and
lastly share the findings. Defining scope involves coming up with community issues that are
complicated for example, homelessness, school drop outs and unemployment. Deciding on
whether to go solo or to collaborate is determined by the financial resources, human resources,
and time available. Collection of the data should focus on answering the issues in question for
the community assessment. Primary and secondary sources can be used to gather this
information. This includes, questionnaires, interviews and census. In determining the key
findings, the data obtained is used in assessing the community needs and asset. The significant
trends in the data collected is highlighted and the differences across the segments in the
community. These findings focus on answering community assessment major questions. With
these priorities are set and action plans formulated. For this to be effective, human problems are
tackled first, then process problem, structural problem and lastly the institutional problem
(Duttweiler, W., 2010).
Roma, in Queensland Australia has a population of six thousand, eight hundred and forty-
eight. 49.8% of this population are male and 50.2% are female. The medium age is 33years.
Families in Roma community are one thousand, six hundred and twenty-two. The average
children in a family for the families with children is 1.9. For all the families the average of
children is 0.7. the unemployed population makes up 4.1% of the whole population. 83.7% of the
population are English speakers. >66.7% of the population has attained higher education above
year 9 in school. 27.3% of the population are Catholics. 78.2% of the population are born in
⊘ This is a preview!⊘
Do you want full access?
Subscribe today to unlock all pages.
Trusted by 1+ million students worldwide
COMMUNITY ASSESSMENT 7
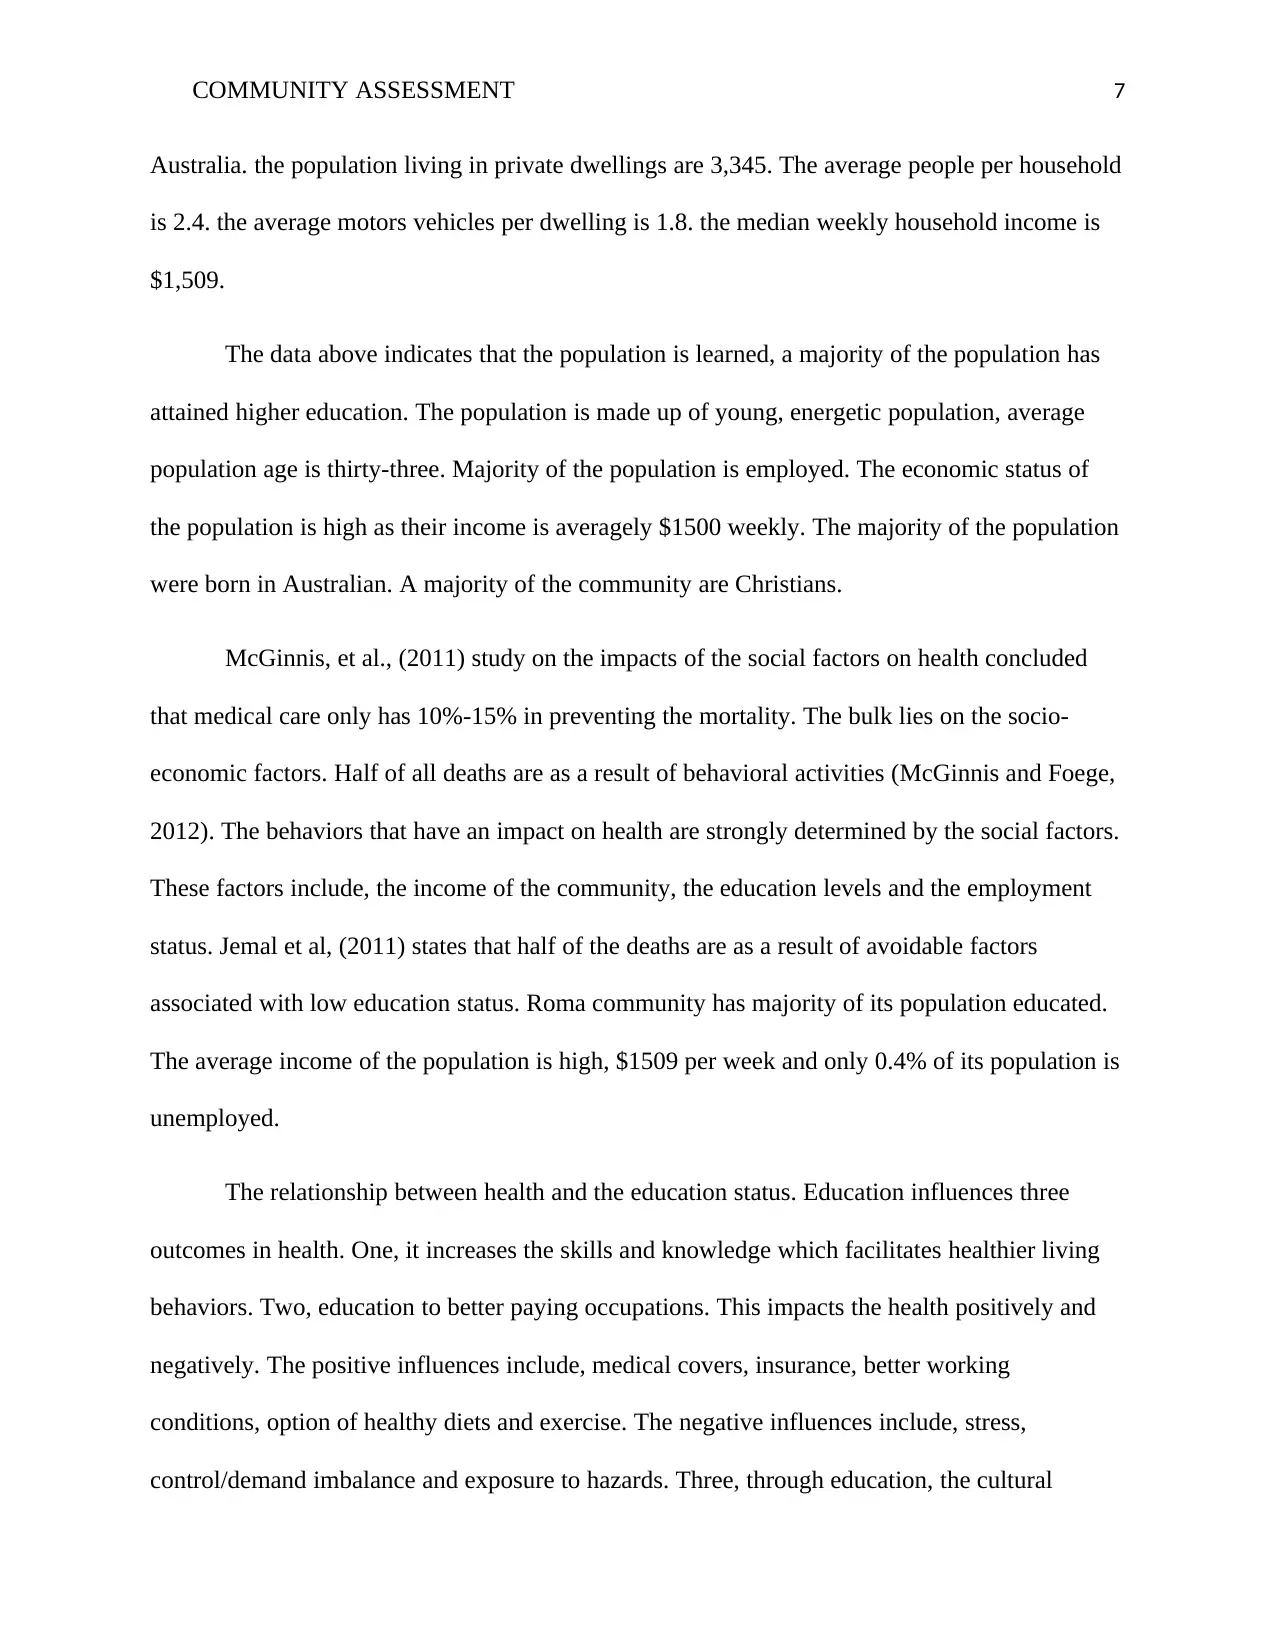
Australia. the population living in private dwellings are 3,345. The average people per household
is 2.4. the average motors vehicles per dwelling is 1.8. the median weekly household income is
$1,509.
The data above indicates that the population is learned, a majority of the population has
attained higher education. The population is made up of young, energetic population, average
population age is thirty-three. Majority of the population is employed. The economic status of
the population is high as their income is averagely $1500 weekly. The majority of the population
were born in Australian. A majority of the community are Christians.
McGinnis, et al., (2011) study on the impacts of the social factors on health concluded
that medical care only has 10%-15% in preventing the mortality. The bulk lies on the socio-
economic factors. Half of all deaths are as a result of behavioral activities (McGinnis and Foege,
2012). The behaviors that have an impact on health are strongly determined by the social factors.
These factors include, the income of the community, the education levels and the employment
status. Jemal et al, (2011) states that half of the deaths are as a result of avoidable factors
associated with low education status. Roma community has majority of its population educated.
The average income of the population is high, $1509 per week and only 0.4% of its population is
unemployed.
The relationship between health and the education status. Education influences three
outcomes in health. One, it increases the skills and knowledge which facilitates healthier living
behaviors. Two, education to better paying occupations. This impacts the health positively and
negatively. The positive influences include, medical covers, insurance, better working
conditions, option of healthy diets and exercise. The negative influences include, stress,
control/demand imbalance and exposure to hazards. Three, through education, the cultural
Paraphrase This Document
Need a fresh take? Get an instant paraphrase of this document with our AI Paraphraser
COMMUNITY ASSESSMENT 8
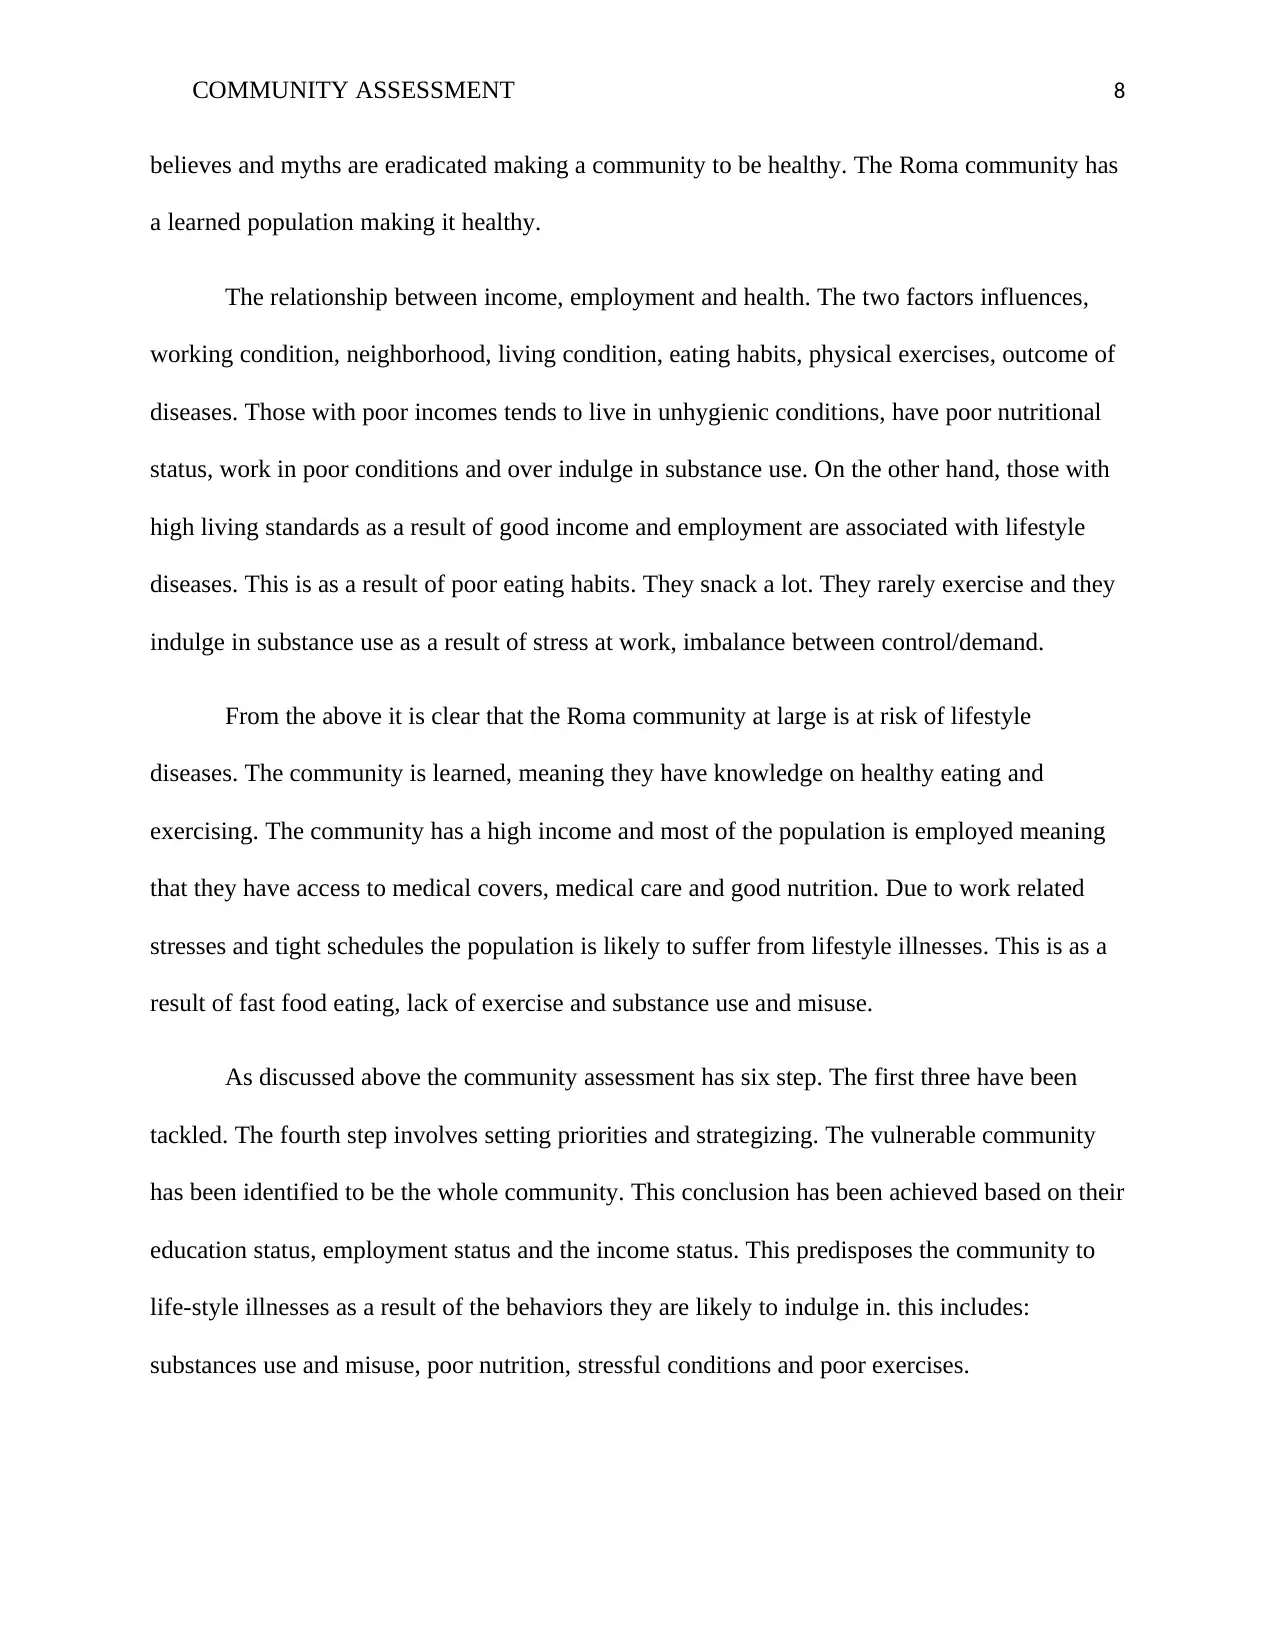
believes and myths are eradicated making a community to be healthy. The Roma community has
a learned population making it healthy.
The relationship between income, employment and health. The two factors influences,
working condition, neighborhood, living condition, eating habits, physical exercises, outcome of
diseases. Those with poor incomes tends to live in unhygienic conditions, have poor nutritional
status, work in poor conditions and over indulge in substance use. On the other hand, those with
high living standards as a result of good income and employment are associated with lifestyle
diseases. This is as a result of poor eating habits. They snack a lot. They rarely exercise and they
indulge in substance use as a result of stress at work, imbalance between control/demand.
From the above it is clear that the Roma community at large is at risk of lifestyle
diseases. The community is learned, meaning they have knowledge on healthy eating and
exercising. The community has a high income and most of the population is employed meaning
that they have access to medical covers, medical care and good nutrition. Due to work related
stresses and tight schedules the population is likely to suffer from lifestyle illnesses. This is as a
result of fast food eating, lack of exercise and substance use and misuse.
As discussed above the community assessment has six step. The first three have been
tackled. The fourth step involves setting priorities and strategizing. The vulnerable community
has been identified to be the whole community. This conclusion has been achieved based on their
education status, employment status and the income status. This predisposes the community to
life-style illnesses as a result of the behaviors they are likely to indulge in. this includes:
substances use and misuse, poor nutrition, stressful conditions and poor exercises.
COMMUNITY ASSESSMENT 9
The action plan aims at preventing the population from getting lifestyle illness. For this to
be achieved the following will be done. Firstly, the human problem will be eliminated by making
the community to see the issues and problem. The Roma community will have a discussion on
their lifestyles and possible negative impacts on their health.
Secondly, the process problem will be eliminated. This will be achieved by prioritizing
the need by urgency and importance. For the Roma community to achieve the objective of
healthy living they have to embrace healthier eating habits, get stress coping mechanisms, stop
substance use and lastly physical exercise. These activities have to be prioritized.
Thirdly, overcome the structural problem. This is achieved by having an open
communication in the community, nurturing a relationship throughout the planning process and
focusing on the current priorities. This will enable the community to communicate their
challenges during the process. Let the community come up with the solutions themselves.
Forth, involves overcoming the institutional problems. These includes those challenges
that impede translating these priorities into action. To achieve these objective, one has to build
on the existing strengths, ensure that the implementation plan is well defined and lastly ensuring
that those responsible to carry out given activities do so. For example, if they exercise once a
week, this can be increased to twice or thrice. If they see a psychologist once a week, they can
increase into two. if they have a tendency of eating fast food daily, they can try healthy meals
once a week.
In conclusion, the Roma population, male and female ratio is almost 1:1. Majority are
learned, they have higher education. Majority of the population has high income which translates
to better lives. The majority of the population is employed. This makes the population vulnerable
⊘ This is a preview!⊘
Do you want full access?
Subscribe today to unlock all pages.
Trusted by 1+ million students worldwide
COMMUNITY ASSESSMENT 10
to lifestyle illness. To prevent this the following has to be done: improve nutrition, physical
exercising, stop substance use and lastly improve coping mechanisms to stress. This is achieved
by making the population aware of the dangers of their habits to their health. New strategies can
be adopted so as to improve their health.
Paraphrase This Document
Need a fresh take? Get an instant paraphrase of this document with our AI Paraphraser
COMMUNITY ASSESSMENT 11
References
Australia Bureau of Statistic, (2016). Roma population. Australian census 2016.
Braveman, A., Egerter, A., Woolf, S., Marks, J., (2011). When do we know enough to
recommend action on the social determinants of health? Journal of Medicine. 40,58-66.
Braveman, P., Egerter S., Williams R., (2011) The social determinants of health: coming of age.
Annual Review of Public Health. 32:381-398.
Braveman, P., Egerter, S., (2013). Overcoming obstacles to health in 2013 and beyond. Robert
Wood Johnson Foundation Commission to Build a Healthier America.
Catie, H., (2010) Developing a plan for identifying local needs for resources. Community tool
box. http://ctb.ku.edu/en/tablecontents/sub_section_main_1019
Community development, Data information and analysis. Preparing for collaborative community
assessment. www.extension.iastate.edu/Publications/CRD334.pdf
Duttweiler, W, (2010) priority setting resources. Available online at Available online at
http://staff.cce.cornell.edu/administration/program
Egerter, S., Braveman, P., Sadegh, T., (2011) Education matters for health. Exploring the social
determinants of health. Robert Wood Johnson Foundation.
Kaplan, A., Shema S., Leite, M., (2010). Socioeconomic determinants of psychological well-
being: the role of income, income change, and income sources. 18:531-700.
McGinnis, M, Foege H., (2010) Actual causes of death in the United States. Journal of
American Medical Association. 270:2207-2212
COMMUNITY ASSESSMENT 12
Nobuko, M., Mia, L., Sandra, W., Maker, L., (2011) choosing your data collection methods. A
handbook for participatory community assessment. 33-39
Stanhope, M & Knollmueller, R (2011). Handbook of public and community nursing practice.
10; 76-77
World Health Organization, (2014). Commission on Social Determinants of Health. Closing the
gap in a generation: health equity through action on the social determinants of health.
CSDH final report.
⊘ This is a preview!⊘
Do you want full access?
Subscribe today to unlock all pages.
Trusted by 1+ million students worldwide
1 out of 12


Your All-in-One AI-Powered Toolkit for Academic Success.
+13062052269
info@desklib.com
Available 24*7 on WhatsApp / Email
![[object Object]](/_next/static/media/star-bottom.7253800d.svg)
Unlock your academic potential
Copyright © 2020–2026 A2Z Services. All Rights Reserved. Developed and managed by ZUCOL.