Roots Corporation Financial Analysis and Performance Evaluation
VerifiedAdded on 2022/09/18
|23
|7968
|21
Report
AI Summary
This report presents a financial analysis of Roots Corporation, based on the provided interim condensed consolidated financial statements for the 13 and 39 week periods ended November 3, 2018, and October 28, 2017, as well as the 13 and 39 week periods ended November 2, 2019 and November 3, 2018. The analysis includes a review of the statement of financial position, statement of net income (loss), statement of comprehensive income (loss), and statement of cash flows. The report assesses the company's performance by examining key financial ratios, identifying areas of concern and improvement, and offering insights into the company's financial health. The analysis aims to provide a comprehensive evaluation of Roots Corporation's financial standing and performance, to assist the Board of Directors in making informed decisions. The report considers factors such as sales, cost of goods sold, expenses, income, assets, liabilities, and shareholders' equity to evaluate the company's financial performance.
ROOTS CORPORATION
Interim Condensed Consolidated Financial Statements
For the 13 and 39 week periods ended November 3, 2018 and October 28, 2017
In Canadian dollars
(Unaudited)
Interim Condensed Consolidated Financial Statements
For the 13 and 39 week periods ended November 3, 2018 and October 28, 2017
In Canadian dollars
(Unaudited)
Paraphrase This Document
Need a fresh take? Get an instant paraphrase of this document with our AI Paraphraser
1
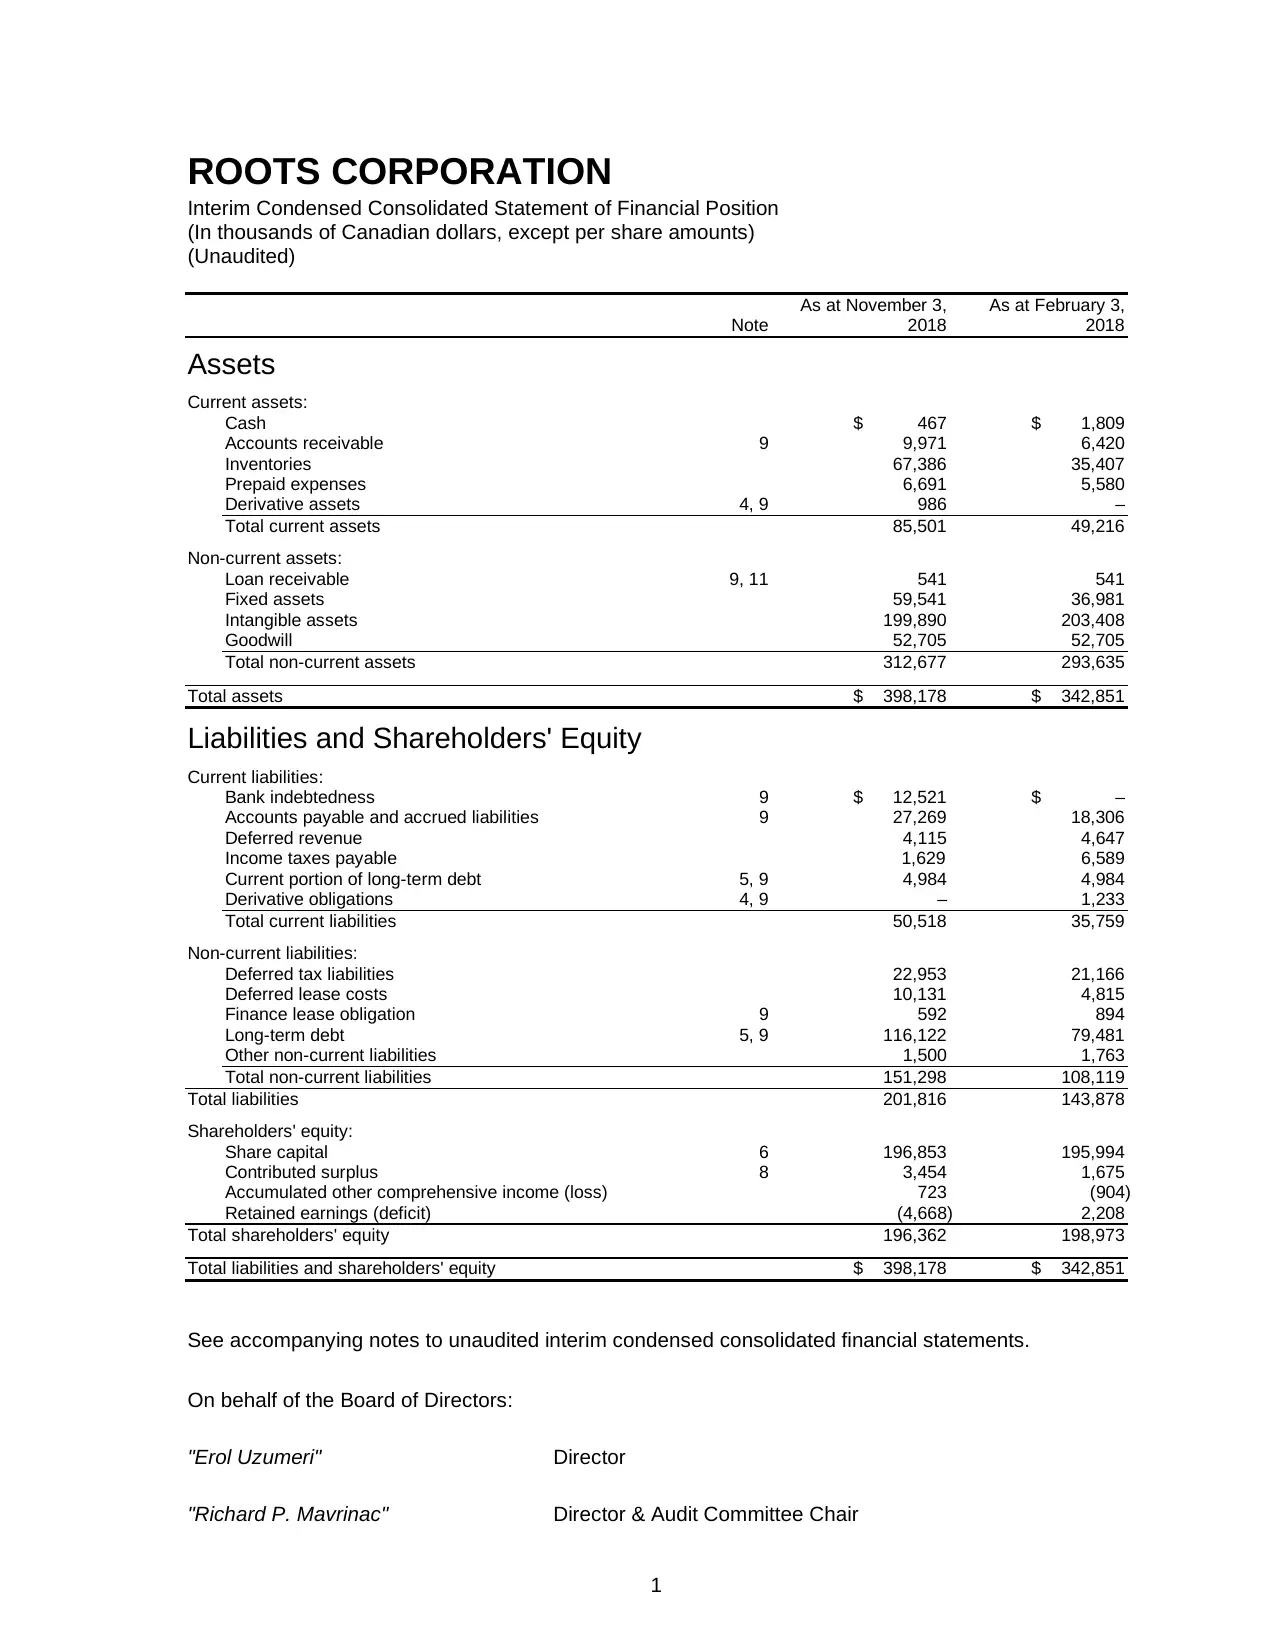
ROOTS CORPORATION
Interim Condensed Consolidated Statement of Financial Position
(In thousands of Canadian dollars, except per share amounts)
(Unaudited)
As at November 3, As at February 3,
Note 2018 2018
Assets
Current assets:
Cash $ 467 $ 1,809
Accounts receivable 9 9,971 6,420
Inventories 67,386 35,407
Prepaid expenses 6,691 5,580
Derivative assets 4, 9 986 –
Total current assets 85,501 49,216
Non-current assets:
Loan receivable 9, 11 541 541
Fixed assets 59,541 36,981
Intangible assets 199,890 203,408
Goodwill 52,705 52,705
Total non-current assets 312,677 293,635
Total assets $ 398,178 $ 342,851
Liabilities and Shareholders' Equity
Current liabilities:
Bank indebtedness 9 $ 12,521 $ –
Accounts payable and accrued liabilities 9 27,269 18,306
Deferred revenue 4,115 4,647
Income taxes payable 1,629 6,589
Current portion of long-term debt 5, 9 4,984 4,984
Derivative obligations 4, 9 – 1,233
Total current liabilities 50,518 35,759
Non-current liabilities:
Deferred tax liabilities 22,953 21,166
Deferred lease costs 10,131 4,815
Finance lease obligation 9 592 894
Long-term debt 5, 9 116,122 79,481
Other non-current liabilities 1,500 1,763
Total non-current liabilities 151,298 108,119
Total liabilities 201,816 143,878
Shareholders' equity:
Share capital 6 196,853 195,994
Contributed surplus 8 3,454 1,675
Accumulated other comprehensive income (loss) 723 (904)
Retained earnings (deficit) (4,668) 2,208
Total shareholders' equity 196,362 198,973
Total liabilities and shareholders' equity $ 398,178 $ 342,851
See accompanying notes to unaudited interim condensed consolidated financial statements.
On behalf of the Board of Directors:
"Erol Uzumeri" Director
"Richard P. Mavrinac" Director & Audit Committee Chair
2
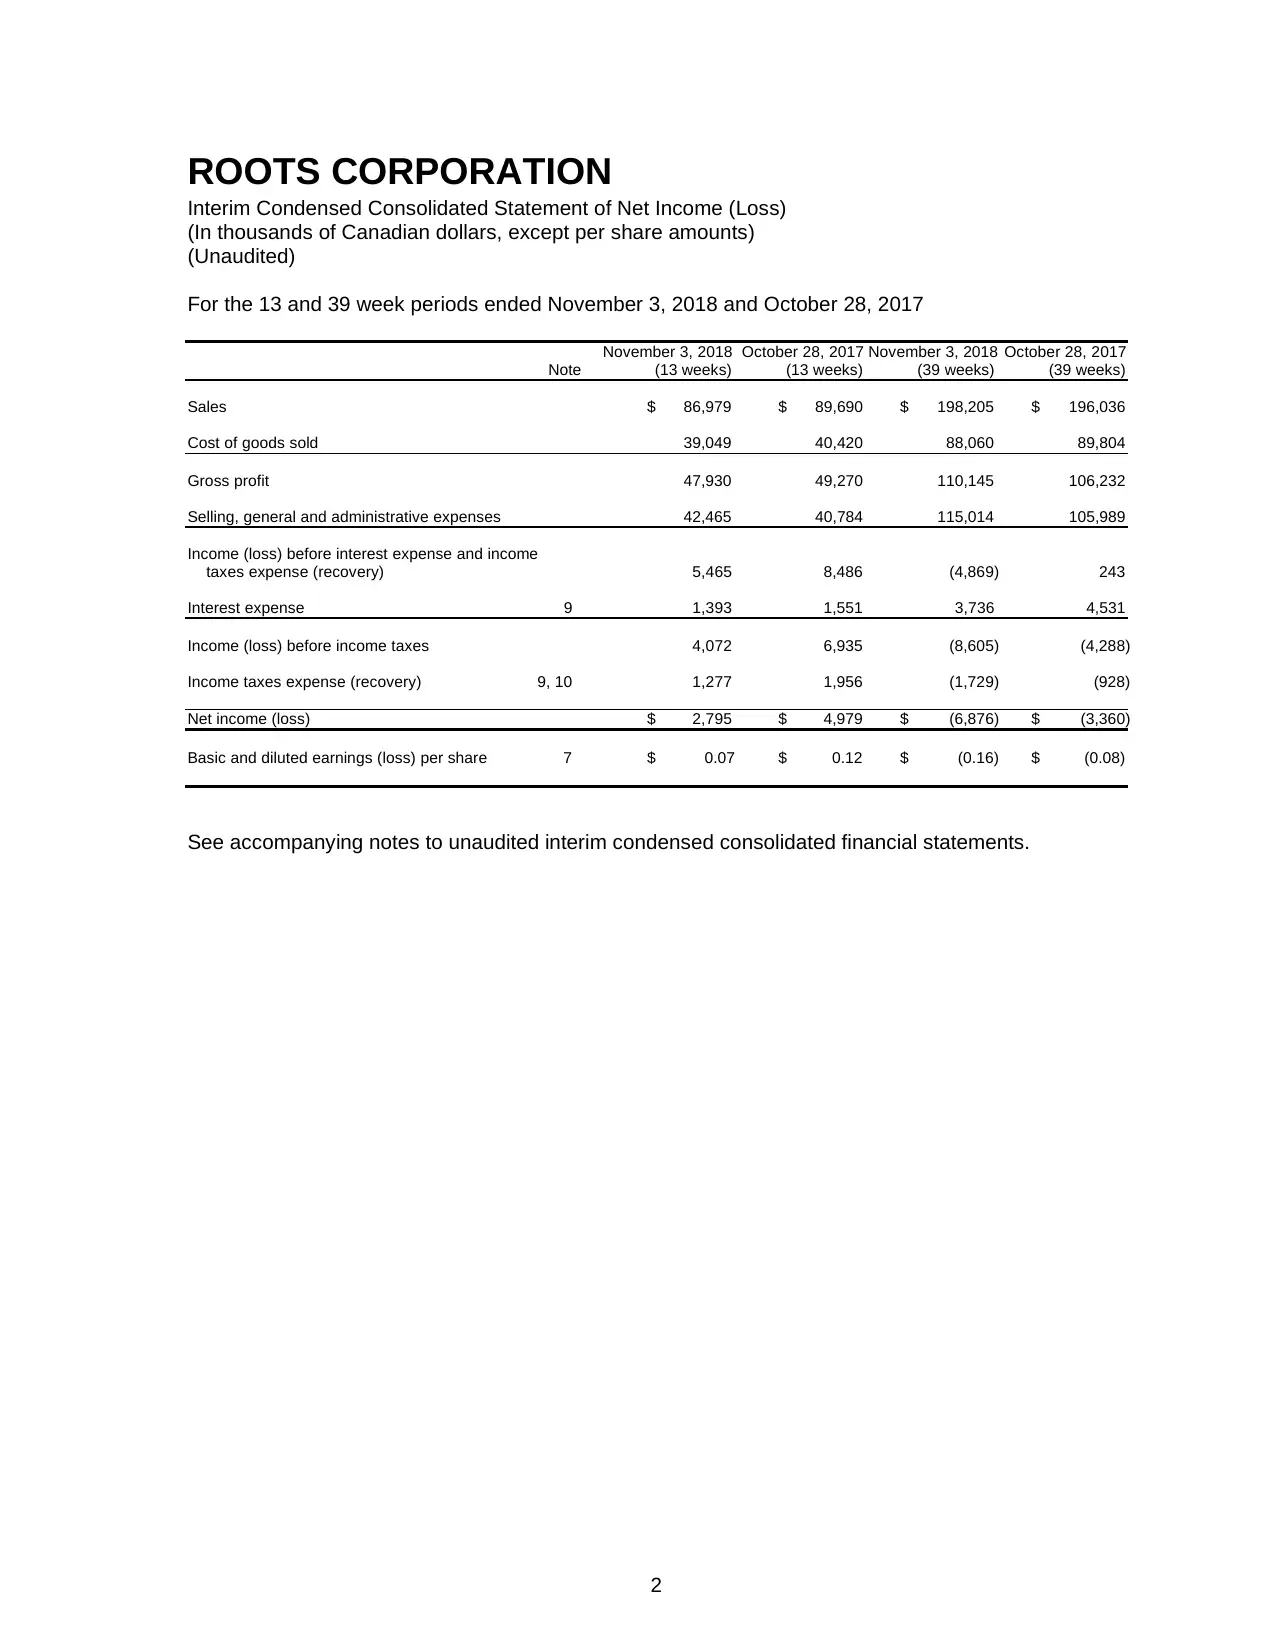
ROOTS CORPORATION
Interim Condensed Consolidated Statement of Net Income (Loss)
(In thousands of Canadian dollars, except per share amounts)
(Unaudited)
For the 13 and 39 week periods ended November 3, 2018 and October 28, 2017
November 3, 2018 October 28, 2017 November 3, 2018 October 28, 2017
Note (13 weeks) (13 weeks) (39 weeks) (39 weeks)
Sales $ 86,979 $ 89,690 $ 198,205 $ 196,036
Cost of goods sold 39,049 40,420 88,060 89,804
Gross profit 47,930 49,270 110,145 106,232
Selling, general and administrative expenses 42,465 40,784 115,014 105,989
Income (loss) before interest expense and income
taxes expense (recovery) 5,465 8,486 (4,869) 243
Interest expense 9 1,393 1,551 3,736 4,531
Income (loss) before income taxes 4,072 6,935 (8,605) (4,288)
Income taxes expense (recovery) 9, 10 1,277 1,956 (1,729) (928)
Net income (loss) $ 2,795 $ 4,979 $ (6,876) $ (3,360)
Basic and diluted earnings (loss) per share 7 $ 0.07 $ 0.12 $ (0.16) $ (0.08)
See accompanying notes to unaudited interim condensed consolidated financial statements.
⊘ This is a preview!⊘
Do you want full access?
Subscribe today to unlock all pages.
Trusted by 1+ million students worldwide
3
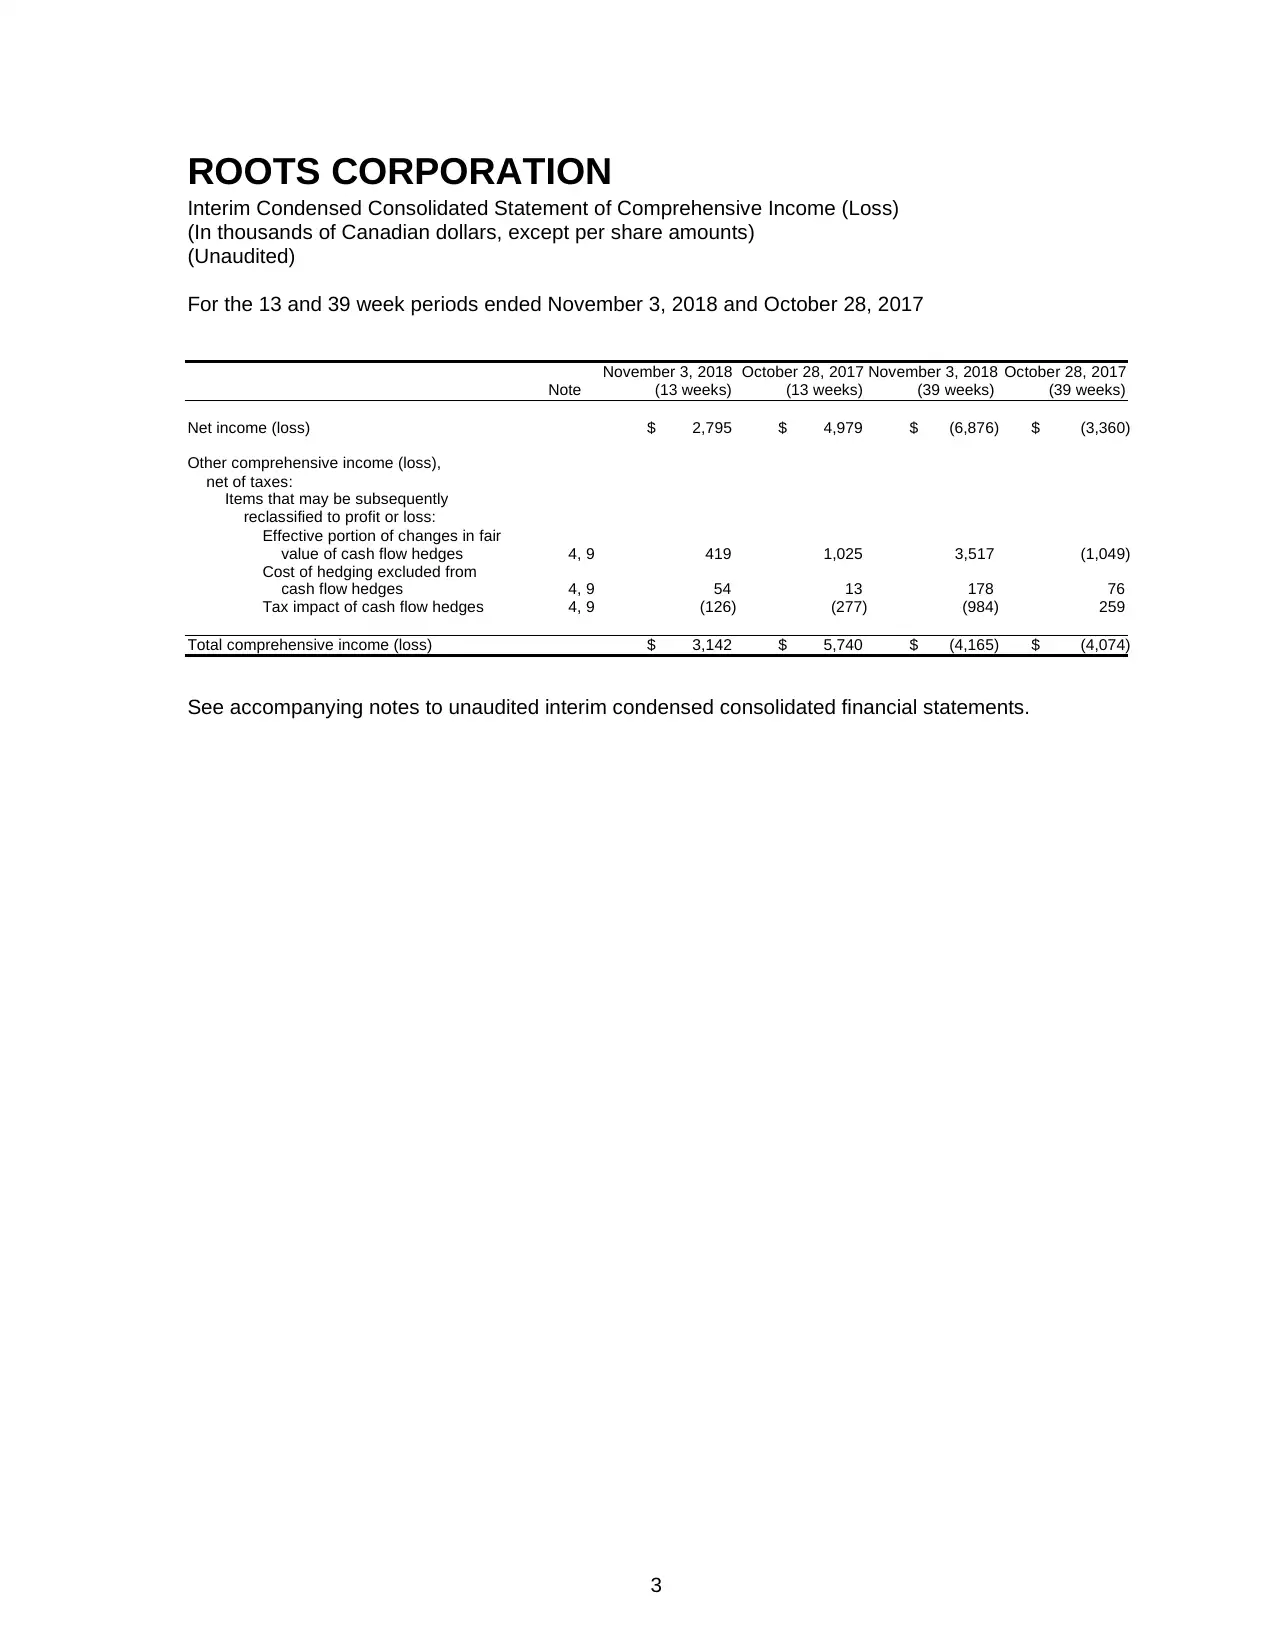
ROOTS CORPORATION
Interim Condensed Consolidated Statement of Comprehensive Income (Loss)
(In thousands of Canadian dollars, except per share amounts)
(Unaudited)
For the 13 and 39 week periods ended November 3, 2018 and October 28, 2017
November 3, 2018 October 28, 2017 November 3, 2018 October 28, 2017
Note (13 weeks) (13 weeks) (39 weeks) (39 weeks)
Net income (loss) $ 2,795 $ 4,979 $ (6,876) $ (3,360)
Other comprehensive income (loss),
net of taxes:
Items that may be subsequently
reclassified to profit or loss:
Effective portion of changes in fair
value of cash flow hedges 4, 9 419 1,025 3,517 (1,049)
Cost of hedging excluded from
cash flow hedges 4, 9 54 13 178 76
Tax impact of cash flow hedges 4, 9 (126) (277) (984) 259
Total comprehensive income (loss) $ 3,142 $ 5,740 $ (4,165) $ (4,074)
See accompanying notes to unaudited interim condensed consolidated financial statements.
Paraphrase This Document
Need a fresh take? Get an instant paraphrase of this document with our AI Paraphraser
4
ROOTS CORPORATION
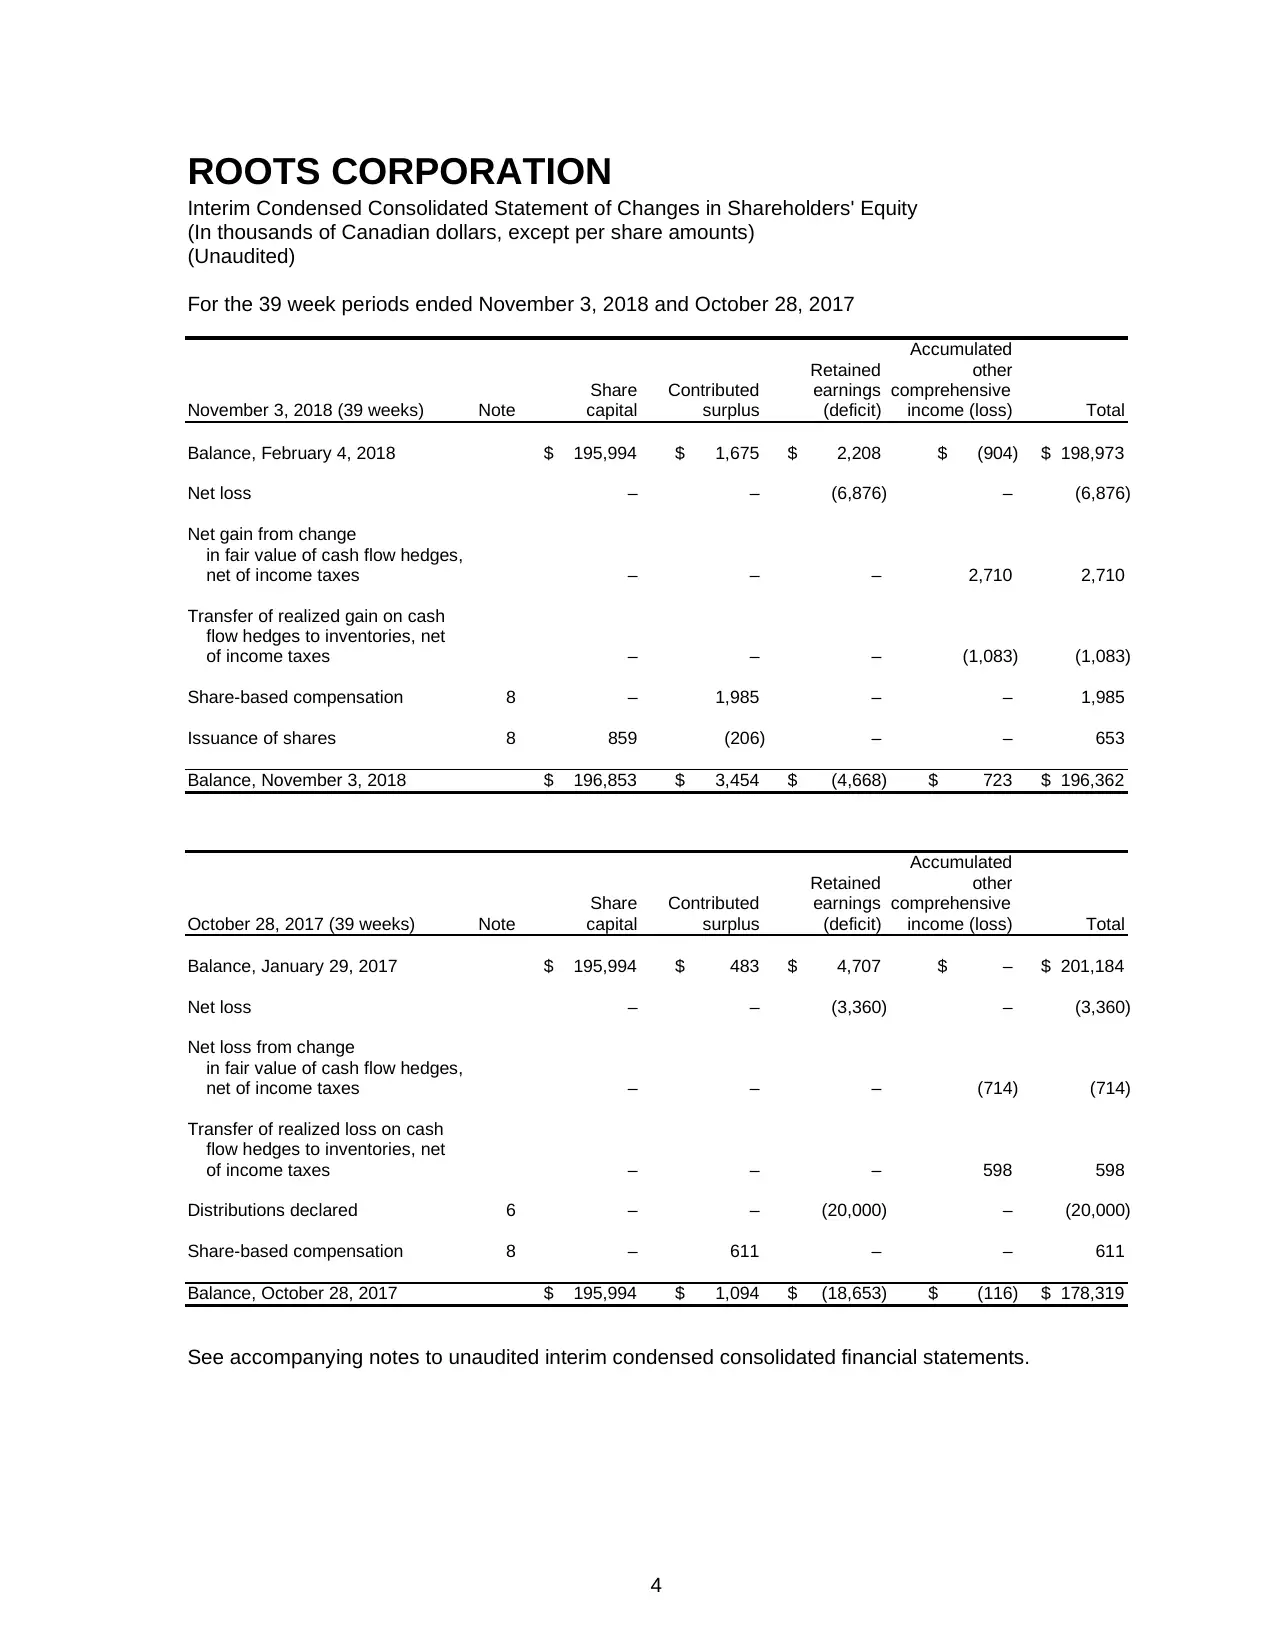
Interim Condensed Consolidated Statement of Changes in Shareholders' Equity
(In thousands of Canadian dollars, except per share amounts)
(Unaudited)
For the 39 week periods ended November 3, 2018 and October 28, 2017
Accumulated
Retained other
Share Contributed earnings comprehensive
November 3, 2018 (39 weeks) Note capital surplus (deficit) income (loss) Total
Balance, February 4, 2018 $ 195,994 $ 1,675 $ 2,208 $ (904) $ 198,973
Net loss – – (6,876) – (6,876)
Net gain from change
in fair value of cash flow hedges,
net of income taxes – – – 2,710 2,710
Transfer of realized gain on cash
flow hedges to inventories, net
of income taxes – – – (1,083) (1,083)
Share-based compensation 8 – 1,985 – – 1,985
Issuance of shares 8 859 (206) – – 653
Balance, November 3, 2018 $ 196,853 $ 3,454 $ (4,668) $ 723 $ 196,362
Accumulated
Retained other
Share Contributed earnings comprehensive
October 28, 2017 (39 weeks) Note capital surplus (deficit) income (loss) Total
Balance, January 29, 2017 $ 195,994 $ 483 $ 4,707 $ – $ 201,184
Net loss – – (3,360) – (3,360)
Net loss from change
in fair value of cash flow hedges,
net of income taxes – – – (714) (714)
Transfer of realized loss on cash
flow hedges to inventories, net
of income taxes – – – 598 598
Distributions declared 6 – – (20,000) – (20,000)
Share-based compensation 8 – 611 – – 611
Balance, October 28, 2017 $ 195,994 $ 1,094 $ (18,653) $ (116) $ 178,319
See accompanying notes to unaudited interim condensed consolidated financial statements.
ROOTS CORPORATION
Interim Condensed Consolidated Statement of Changes in Shareholders' Equity
(In thousands of Canadian dollars, except per share amounts)
(Unaudited)
For the 39 week periods ended November 3, 2018 and October 28, 2017
Accumulated
Retained other
Share Contributed earnings comprehensive
November 3, 2018 (39 weeks) Note capital surplus (deficit) income (loss) Total
Balance, February 4, 2018 $ 195,994 $ 1,675 $ 2,208 $ (904) $ 198,973
Net loss – – (6,876) – (6,876)
Net gain from change
in fair value of cash flow hedges,
net of income taxes – – – 2,710 2,710
Transfer of realized gain on cash
flow hedges to inventories, net
of income taxes – – – (1,083) (1,083)
Share-based compensation 8 – 1,985 – – 1,985
Issuance of shares 8 859 (206) – – 653
Balance, November 3, 2018 $ 196,853 $ 3,454 $ (4,668) $ 723 $ 196,362
Accumulated
Retained other
Share Contributed earnings comprehensive
October 28, 2017 (39 weeks) Note capital surplus (deficit) income (loss) Total
Balance, January 29, 2017 $ 195,994 $ 483 $ 4,707 $ – $ 201,184
Net loss – – (3,360) – (3,360)
Net loss from change
in fair value of cash flow hedges,
net of income taxes – – – (714) (714)
Transfer of realized loss on cash
flow hedges to inventories, net
of income taxes – – – 598 598
Distributions declared 6 – – (20,000) – (20,000)
Share-based compensation 8 – 611 – – 611
Balance, October 28, 2017 $ 195,994 $ 1,094 $ (18,653) $ (116) $ 178,319
See accompanying notes to unaudited interim condensed consolidated financial statements.
5
ROOTS CORPORATION
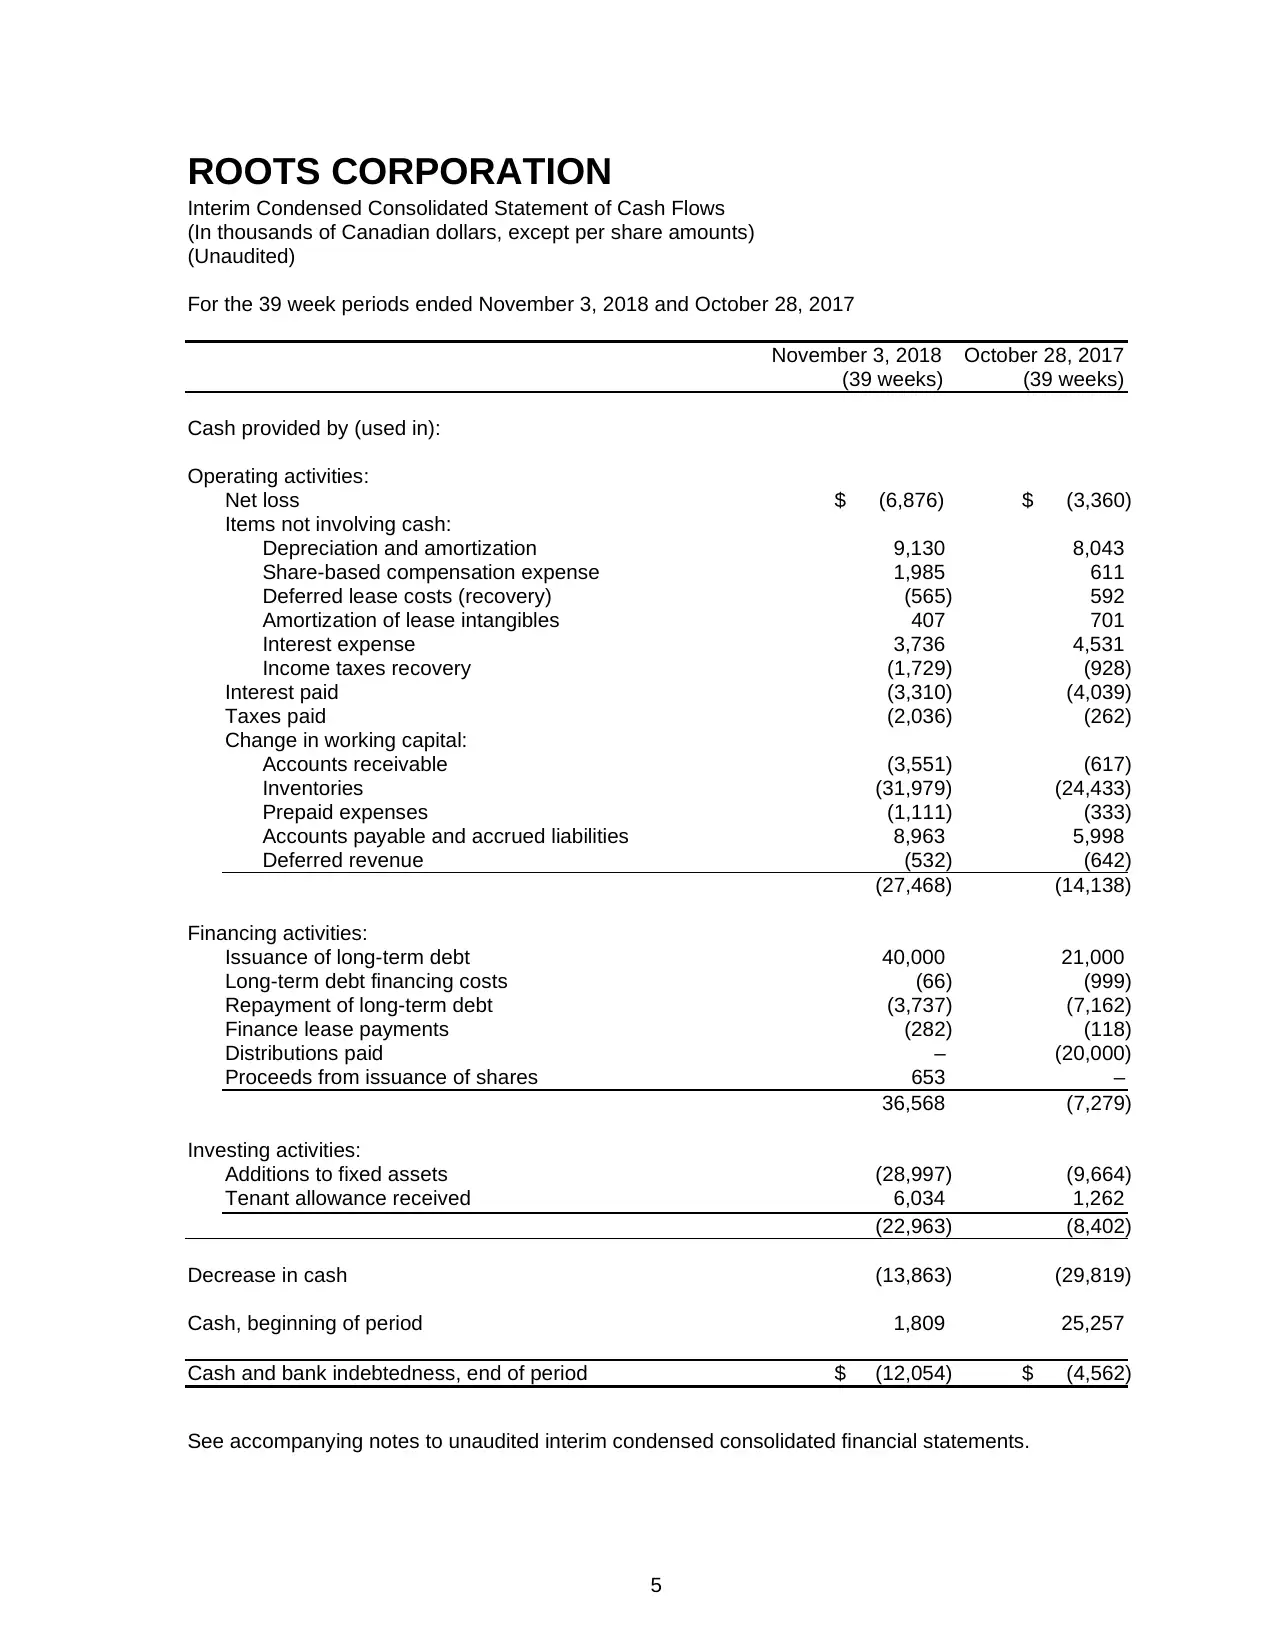
Interim Condensed Consolidated Statement of Cash Flows
(In thousands of Canadian dollars, except per share amounts)
(Unaudited)
For the 39 week periods ended November 3, 2018 and October 28, 2017
November 3, 2018 October 28, 2017
(39 weeks) (39 weeks)
Cash provided by (used in):
Operating activities:
Net loss $ (6,876) $ (3,360)
Items not involving cash:
Depreciation and amortization 9,130 8,043
Share-based compensation expense 1,985 611
Deferred lease costs (recovery) (565) 592
Amortization of lease intangibles 407 701
Interest expense 3,736 4,531
Income taxes recovery (1,729) (928)
Interest paid (3,310) (4,039)
Taxes paid (2,036) (262)
Change in working capital:
Accounts receivable (3,551) (617)
Inventories (31,979) (24,433)
Prepaid expenses (1,111) (333)
Accounts payable and accrued liabilities 8,963 5,998
Deferred revenue (532) (642)
(27,468) (14,138)
Financing activities:
Issuance of long-term debt 40,000 21,000
Long-term debt financing costs (66) (999)
Repayment of long-term debt (3,737) (7,162)
Finance lease payments (282) (118)
Distributions paid – (20,000)
Proceeds from issuance of shares 653 –
36,568 (7,279)
Investing activities:
Additions to fixed assets (28,997) (9,664)
Tenant allowance received 6,034 1,262
(22,963) (8,402)
Decrease in cash (13,863) (29,819)
Cash, beginning of period 1,809 25,257
Cash and bank indebtedness, end of period $ (12,054) $ (4,562)
See accompanying notes to unaudited interim condensed consolidated financial statements.
ROOTS CORPORATION
Interim Condensed Consolidated Statement of Cash Flows
(In thousands of Canadian dollars, except per share amounts)
(Unaudited)
For the 39 week periods ended November 3, 2018 and October 28, 2017
November 3, 2018 October 28, 2017
(39 weeks) (39 weeks)
Cash provided by (used in):
Operating activities:
Net loss $ (6,876) $ (3,360)
Items not involving cash:
Depreciation and amortization 9,130 8,043
Share-based compensation expense 1,985 611
Deferred lease costs (recovery) (565) 592
Amortization of lease intangibles 407 701
Interest expense 3,736 4,531
Income taxes recovery (1,729) (928)
Interest paid (3,310) (4,039)
Taxes paid (2,036) (262)
Change in working capital:
Accounts receivable (3,551) (617)
Inventories (31,979) (24,433)
Prepaid expenses (1,111) (333)
Accounts payable and accrued liabilities 8,963 5,998
Deferred revenue (532) (642)
(27,468) (14,138)
Financing activities:
Issuance of long-term debt 40,000 21,000
Long-term debt financing costs (66) (999)
Repayment of long-term debt (3,737) (7,162)
Finance lease payments (282) (118)
Distributions paid – (20,000)
Proceeds from issuance of shares 653 –
36,568 (7,279)
Investing activities:
Additions to fixed assets (28,997) (9,664)
Tenant allowance received 6,034 1,262
(22,963) (8,402)
Decrease in cash (13,863) (29,819)
Cash, beginning of period 1,809 25,257
Cash and bank indebtedness, end of period $ (12,054) $ (4,562)
See accompanying notes to unaudited interim condensed consolidated financial statements.
⊘ This is a preview!⊘
Do you want full access?
Subscribe today to unlock all pages.
Trusted by 1+ million students worldwide
ROOTS CORPORATION
Notes to Interim Condensed Consolidated Financial Statements (continued)
(In thousands of Canadian dollars, except per share amounts)
(Unaudited)
6
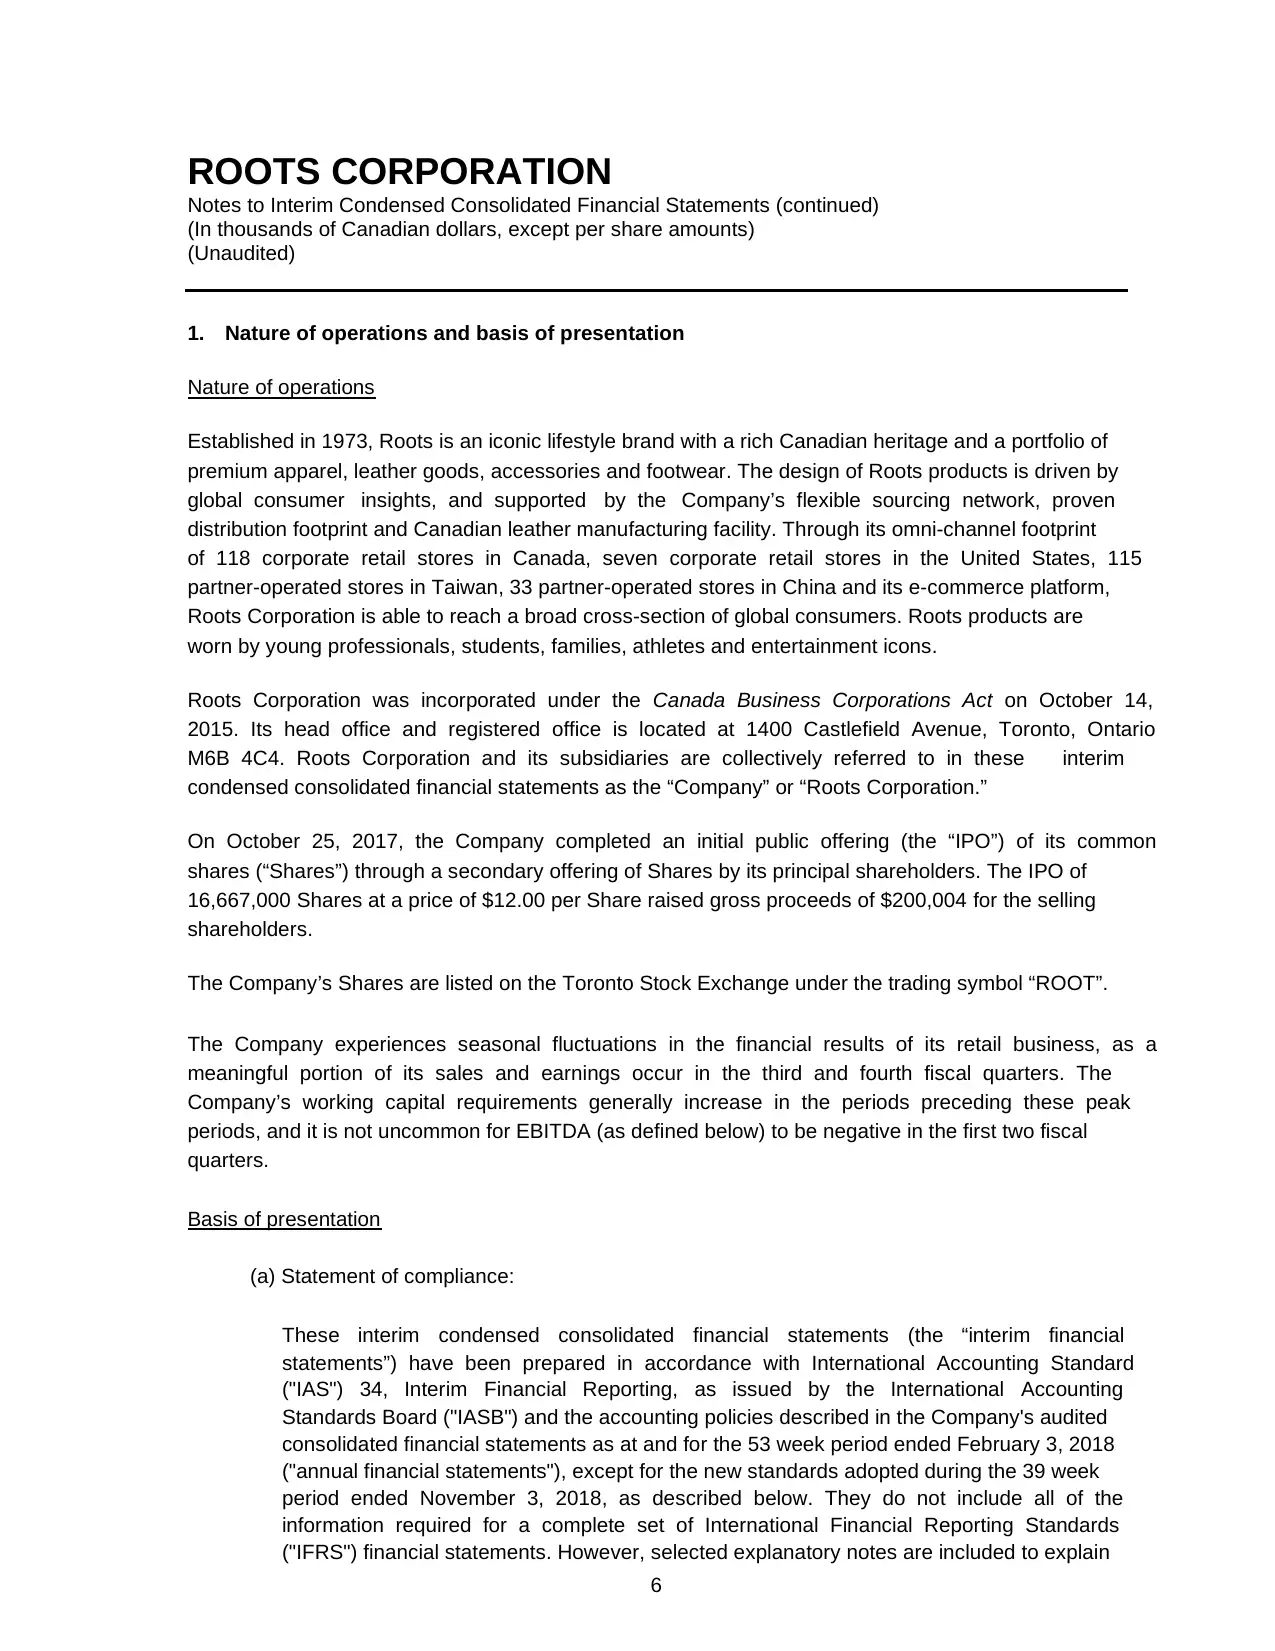
1. Nature of operations and basis of presentation
Nature of operations
Established in 1973, Roots is an iconic lifestyle brand with a rich Canadian heritage and a portfolio of
premium apparel, leather goods, accessories and footwear. The design of Roots products is driven by
global consumer insights, and supported by the Company’s flexible sourcing network, proven
distribution footprint and Canadian leather manufacturing facility. Through its omni-channel footprint
of 118 corporate retail stores in Canada, seven corporate retail stores in the United States, 115
partner-operated stores in Taiwan, 33 partner-operated stores in China and its e-commerce platform,
Roots Corporation is able to reach a broad cross-section of global consumers. Roots products are
worn by young professionals, students, families, athletes and entertainment icons.
Roots Corporation was incorporated under the Canada Business Corporations Act on October 14,
2015. Its head office and registered office is located at 1400 Castlefield Avenue, Toronto, Ontario
M6B 4C4. Roots Corporation and its subsidiaries are collectively referred to in these interim
condensed consolidated financial statements as the “Company” or “Roots Corporation.”
On October 25, 2017, the Company completed an initial public offering (the “IPO”) of its common
shares (“Shares”) through a secondary offering of Shares by its principal shareholders. The IPO of
16,667,000 Shares at a price of $12.00 per Share raised gross proceeds of $200,004 for the selling
shareholders.
The Company’s Shares are listed on the Toronto Stock Exchange under the trading symbol “ROOT”.
The Company experiences seasonal fluctuations in the financial results of its retail business, as a
meaningful portion of its sales and earnings occur in the third and fourth fiscal quarters. The
Company’s working capital requirements generally increase in the periods preceding these peak
periods, and it is not uncommon for EBITDA (as defined below) to be negative in the first two fiscal
quarters.
Basis of presentation
(a) Statement of compliance:
These interim condensed consolidated financial statements (the “interim financial
statements”) have been prepared in accordance with International Accounting Standard
("IAS") 34, Interim Financial Reporting, as issued by the International Accounting
Standards Board ("IASB") and the accounting policies described in the Company's audited
consolidated financial statements as at and for the 53 week period ended February 3, 2018
("annual financial statements"), except for the new standards adopted during the 39 week
period ended November 3, 2018, as described below. They do not include all of the
information required for a complete set of International Financial Reporting Standards
("IFRS") financial statements. However, selected explanatory notes are included to explain
Notes to Interim Condensed Consolidated Financial Statements (continued)
(In thousands of Canadian dollars, except per share amounts)
(Unaudited)
6
1. Nature of operations and basis of presentation
Nature of operations
Established in 1973, Roots is an iconic lifestyle brand with a rich Canadian heritage and a portfolio of
premium apparel, leather goods, accessories and footwear. The design of Roots products is driven by
global consumer insights, and supported by the Company’s flexible sourcing network, proven
distribution footprint and Canadian leather manufacturing facility. Through its omni-channel footprint
of 118 corporate retail stores in Canada, seven corporate retail stores in the United States, 115
partner-operated stores in Taiwan, 33 partner-operated stores in China and its e-commerce platform,
Roots Corporation is able to reach a broad cross-section of global consumers. Roots products are
worn by young professionals, students, families, athletes and entertainment icons.
Roots Corporation was incorporated under the Canada Business Corporations Act on October 14,
2015. Its head office and registered office is located at 1400 Castlefield Avenue, Toronto, Ontario
M6B 4C4. Roots Corporation and its subsidiaries are collectively referred to in these interim
condensed consolidated financial statements as the “Company” or “Roots Corporation.”
On October 25, 2017, the Company completed an initial public offering (the “IPO”) of its common
shares (“Shares”) through a secondary offering of Shares by its principal shareholders. The IPO of
16,667,000 Shares at a price of $12.00 per Share raised gross proceeds of $200,004 for the selling
shareholders.
The Company’s Shares are listed on the Toronto Stock Exchange under the trading symbol “ROOT”.
The Company experiences seasonal fluctuations in the financial results of its retail business, as a
meaningful portion of its sales and earnings occur in the third and fourth fiscal quarters. The
Company’s working capital requirements generally increase in the periods preceding these peak
periods, and it is not uncommon for EBITDA (as defined below) to be negative in the first two fiscal
quarters.
Basis of presentation
(a) Statement of compliance:
These interim condensed consolidated financial statements (the “interim financial
statements”) have been prepared in accordance with International Accounting Standard
("IAS") 34, Interim Financial Reporting, as issued by the International Accounting
Standards Board ("IASB") and the accounting policies described in the Company's audited
consolidated financial statements as at and for the 53 week period ended February 3, 2018
("annual financial statements"), except for the new standards adopted during the 39 week
period ended November 3, 2018, as described below. They do not include all of the
information required for a complete set of International Financial Reporting Standards
("IFRS") financial statements. However, selected explanatory notes are included to explain
Paraphrase This Document
Need a fresh take? Get an instant paraphrase of this document with our AI Paraphraser
ROOTS CORPORATION
Notes to Interim Condensed Consolidated Financial Statements (continued)
(In thousands of Canadian dollars, except per share amounts)
(Unaudited)
7
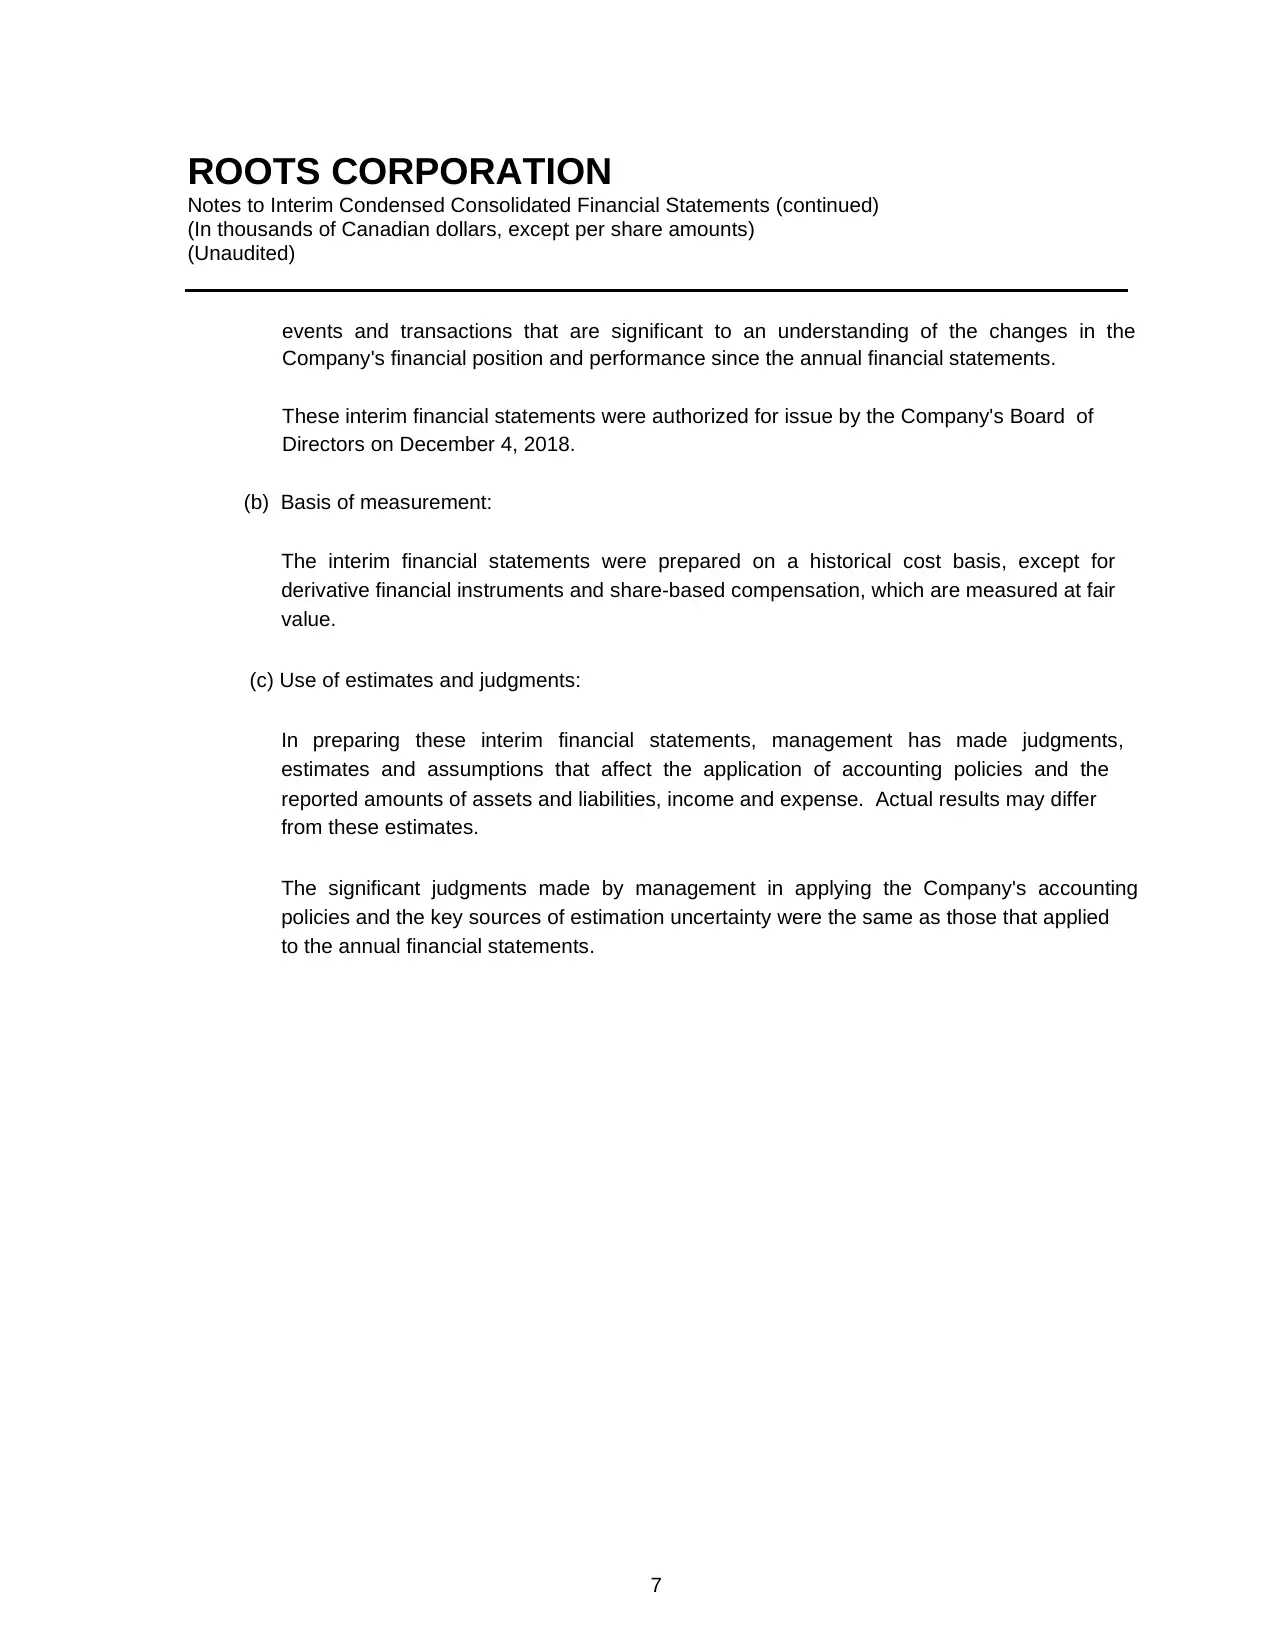
events and transactions that are significant to an understanding of the changes in the
Company's financial position and performance since the annual financial statements.
These interim financial statements were authorized for issue by the Company's Board of
Directors on December 4, 2018.
(b) Basis of measurement:
The interim financial statements were prepared on a historical cost basis, except for
derivative financial instruments and share-based compensation, which are measured at fair
value.
(c) Use of estimates and judgments:
In preparing these interim financial statements, management has made judgments,
estimates and assumptions that affect the application of accounting policies and the
reported amounts of assets and liabilities, income and expense. Actual results may differ
from these estimates.
The significant judgments made by management in applying the Company's accounting
policies and the key sources of estimation uncertainty were the same as those that applied
to the annual financial statements.
Notes to Interim Condensed Consolidated Financial Statements (continued)
(In thousands of Canadian dollars, except per share amounts)
(Unaudited)
7
events and transactions that are significant to an understanding of the changes in the
Company's financial position and performance since the annual financial statements.
These interim financial statements were authorized for issue by the Company's Board of
Directors on December 4, 2018.
(b) Basis of measurement:
The interim financial statements were prepared on a historical cost basis, except for
derivative financial instruments and share-based compensation, which are measured at fair
value.
(c) Use of estimates and judgments:
In preparing these interim financial statements, management has made judgments,
estimates and assumptions that affect the application of accounting policies and the
reported amounts of assets and liabilities, income and expense. Actual results may differ
from these estimates.
The significant judgments made by management in applying the Company's accounting
policies and the key sources of estimation uncertainty were the same as those that applied
to the annual financial statements.
ROOTS CORPORATION
Notes to Interim Condensed Consolidated Financial Statements (continued)
(In thousands of Canadian dollars, except per share amounts)
(Unaudited)
8
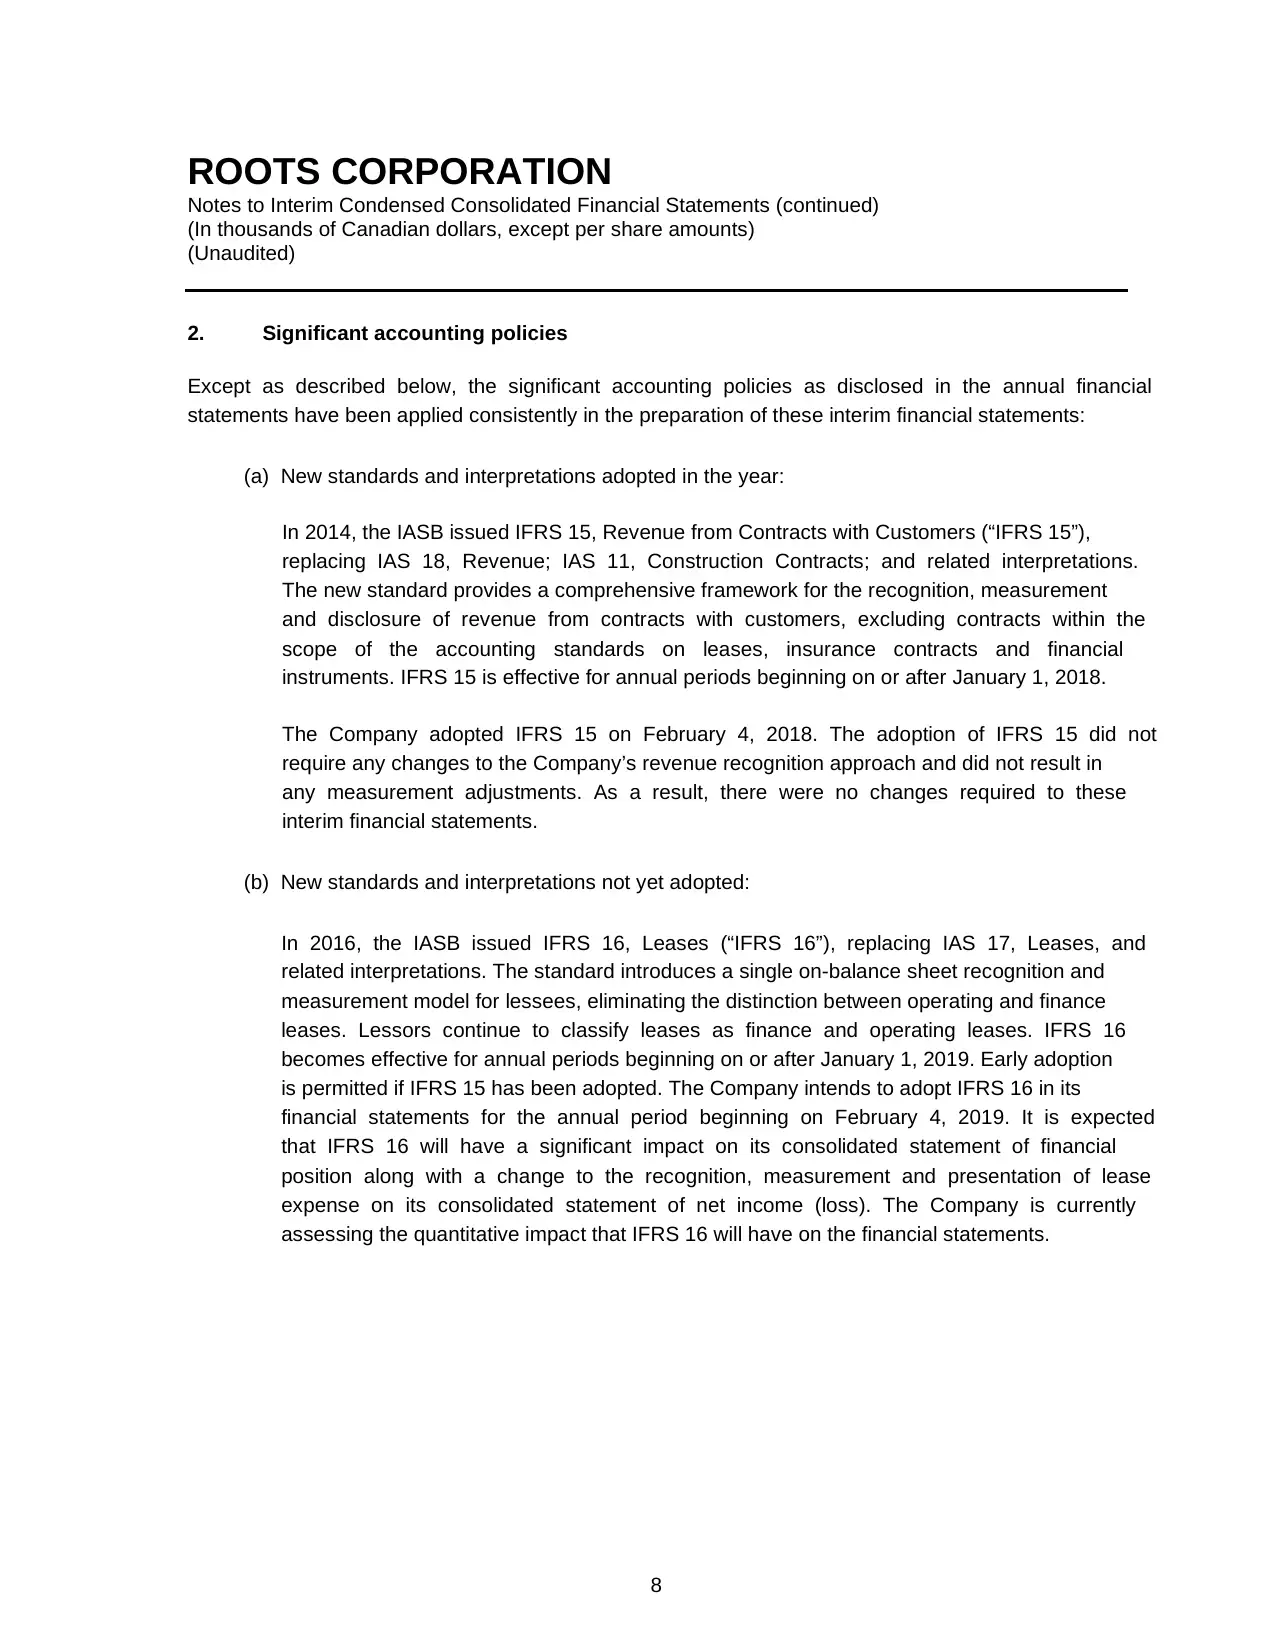
2. Significant accounting policies
Except as described below, the significant accounting policies as disclosed in the annual financial
statements have been applied consistently in the preparation of these interim financial statements:
(a) New standards and interpretations adopted in the year:
In 2014, the IASB issued IFRS 15, Revenue from Contracts with Customers (“IFRS 15”),
replacing IAS 18, Revenue; IAS 11, Construction Contracts; and related interpretations.
The new standard provides a comprehensive framework for the recognition, measurement
and disclosure of revenue from contracts with customers, excluding contracts within the
scope of the accounting standards on leases, insurance contracts and financial
instruments. IFRS 15 is effective for annual periods beginning on or after January 1, 2018.
The Company adopted IFRS 15 on February 4, 2018. The adoption of IFRS 15 did not
require any changes to the Company’s revenue recognition approach and did not result in
any measurement adjustments. As a result, there were no changes required to these
interim financial statements.
(b) New standards and interpretations not yet adopted:
In 2016, the IASB issued IFRS 16, Leases (“IFRS 16”), replacing IAS 17, Leases, and
related interpretations. The standard introduces a single on-balance sheet recognition and
measurement model for lessees, eliminating the distinction between operating and finance
leases. Lessors continue to classify leases as finance and operating leases. IFRS 16
becomes effective for annual periods beginning on or after January 1, 2019. Early adoption
is permitted if IFRS 15 has been adopted. The Company intends to adopt IFRS 16 in its
financial statements for the annual period beginning on February 4, 2019. It is expected
that IFRS 16 will have a significant impact on its consolidated statement of financial
position along with a change to the recognition, measurement and presentation of lease
expense on its consolidated statement of net income (loss). The Company is currently
assessing the quantitative impact that IFRS 16 will have on the financial statements.
Notes to Interim Condensed Consolidated Financial Statements (continued)
(In thousands of Canadian dollars, except per share amounts)
(Unaudited)
8
2. Significant accounting policies
Except as described below, the significant accounting policies as disclosed in the annual financial
statements have been applied consistently in the preparation of these interim financial statements:
(a) New standards and interpretations adopted in the year:
In 2014, the IASB issued IFRS 15, Revenue from Contracts with Customers (“IFRS 15”),
replacing IAS 18, Revenue; IAS 11, Construction Contracts; and related interpretations.
The new standard provides a comprehensive framework for the recognition, measurement
and disclosure of revenue from contracts with customers, excluding contracts within the
scope of the accounting standards on leases, insurance contracts and financial
instruments. IFRS 15 is effective for annual periods beginning on or after January 1, 2018.
The Company adopted IFRS 15 on February 4, 2018. The adoption of IFRS 15 did not
require any changes to the Company’s revenue recognition approach and did not result in
any measurement adjustments. As a result, there were no changes required to these
interim financial statements.
(b) New standards and interpretations not yet adopted:
In 2016, the IASB issued IFRS 16, Leases (“IFRS 16”), replacing IAS 17, Leases, and
related interpretations. The standard introduces a single on-balance sheet recognition and
measurement model for lessees, eliminating the distinction between operating and finance
leases. Lessors continue to classify leases as finance and operating leases. IFRS 16
becomes effective for annual periods beginning on or after January 1, 2019. Early adoption
is permitted if IFRS 15 has been adopted. The Company intends to adopt IFRS 16 in its
financial statements for the annual period beginning on February 4, 2019. It is expected
that IFRS 16 will have a significant impact on its consolidated statement of financial
position along with a change to the recognition, measurement and presentation of lease
expense on its consolidated statement of net income (loss). The Company is currently
assessing the quantitative impact that IFRS 16 will have on the financial statements.
⊘ This is a preview!⊘
Do you want full access?
Subscribe today to unlock all pages.
Trusted by 1+ million students worldwide
ROOTS CORPORATION
Notes to Interim Condensed Consolidated Financial Statements (continued)
(In thousands of Canadian dollars, except per share amounts)
(Unaudited)
9
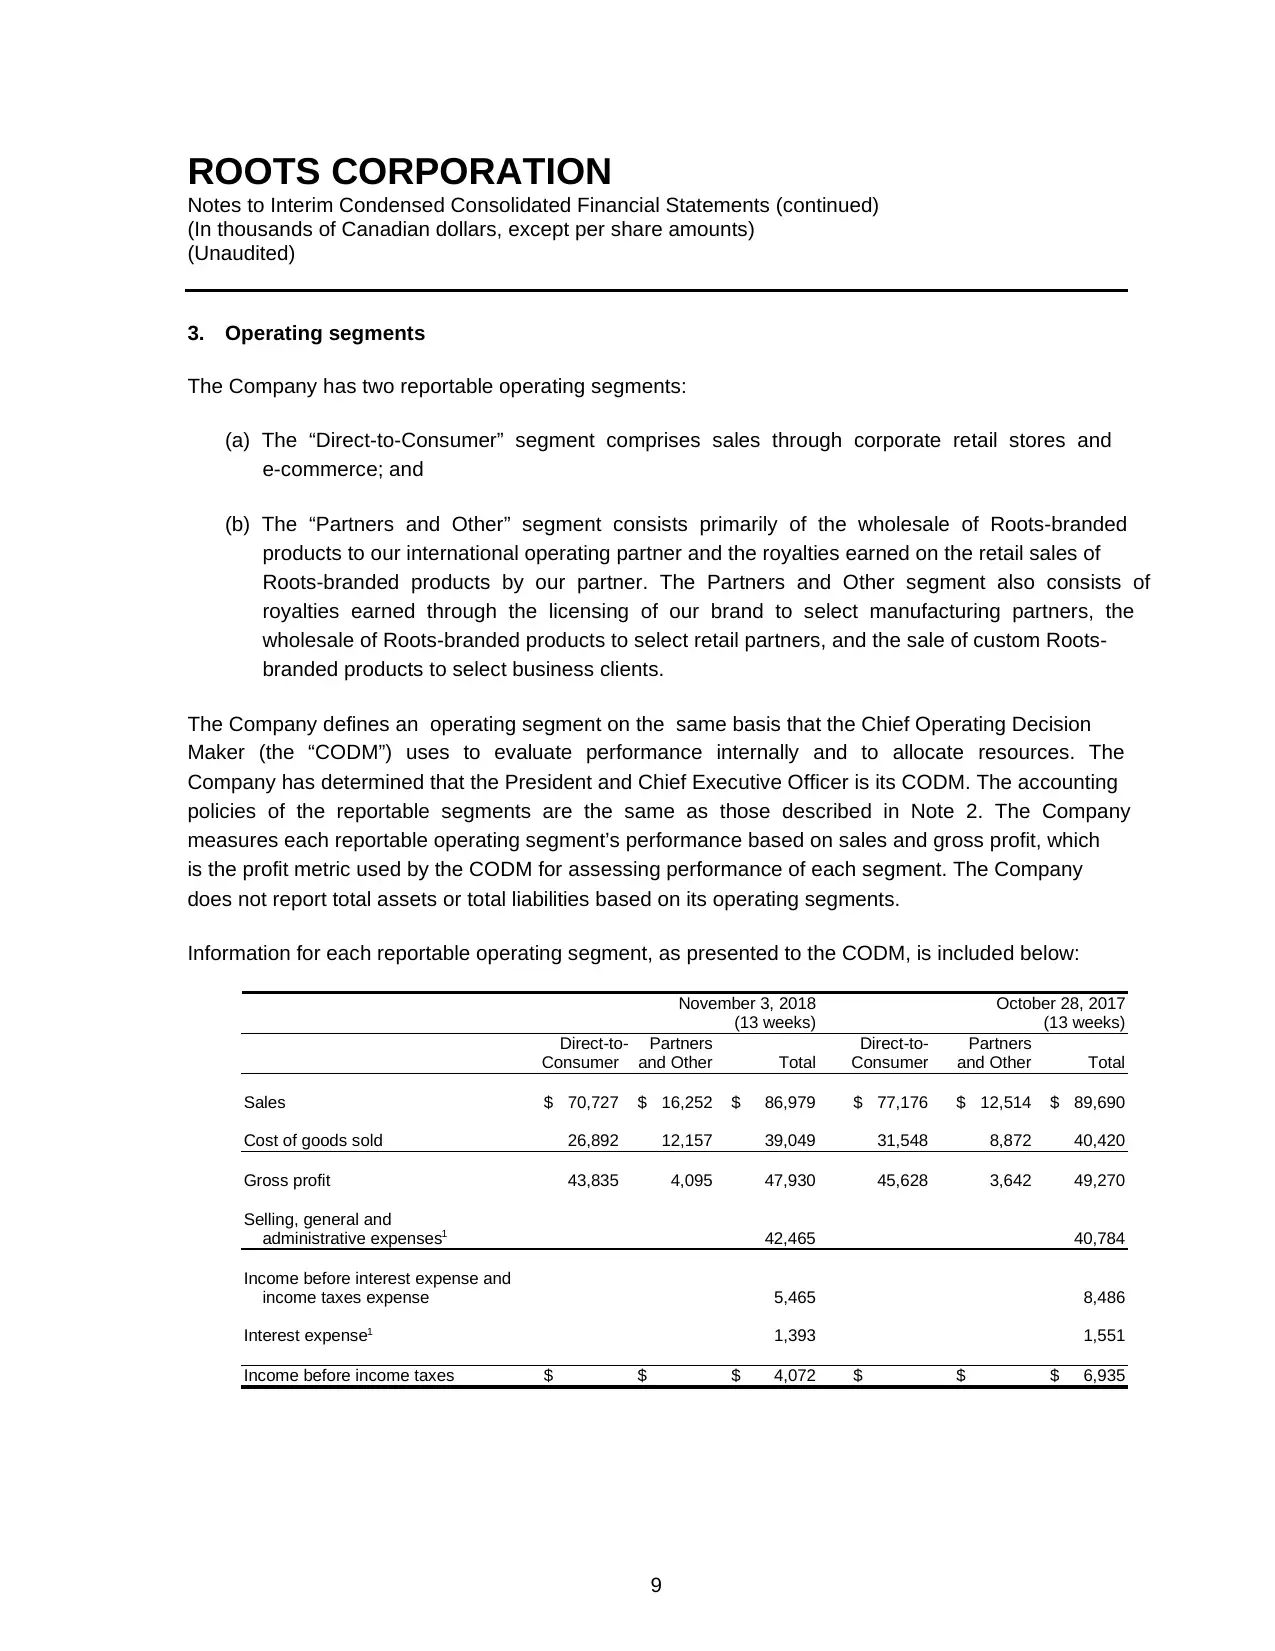
3. Operating segments
The Company has two reportable operating segments:
(a) The “Direct-to-Consumer” segment comprises sales through corporate retail stores and
e-commerce; and
(b) The “Partners and Other” segment consists primarily of the wholesale of Roots-branded
products to our international operating partner and the royalties earned on the retail sales of
Roots-branded products by our partner. The Partners and Other segment also consists of
royalties earned through the licensing of our brand to select manufacturing partners, the
wholesale of Roots-branded products to select retail partners, and the sale of custom Roots-
branded products to select business clients.
The Company defines an operating segment on the same basis that the Chief Operating Decision
Maker (the “CODM”) uses to evaluate performance internally and to allocate resources. The
Company has determined that the President and Chief Executive Officer is its CODM. The accounting
policies of the reportable segments are the same as those described in Note 2. The Company
measures each reportable operating segment’s performance based on sales and gross profit, which
is the profit metric used by the CODM for assessing performance of each segment. The Company
does not report total assets or total liabilities based on its operating segments.
Information for each reportable operating segment, as presented to the CODM, is included below:
November 3, 2018 October 28, 2017
(13 weeks) (13 weeks)
Direct-to- Partners Direct-to- Partners
Consumer and Other Total Consumer and Other Total
Sales $ 70,727 $ 16,252 $ 86,979 $ 77,176 $ 12,514 $ 89,690
Cost of goods sold 26,892 12,157 39,049 31,548 8,872 40,420
Gross profit 43,835 4,095 47,930 45,628 3,642 49,270
Selling, general and
administrative expenses1 42,465 40,784
Income before interest expense and
income taxes expense 5,465 8,486
Interest expense1 1,393 1,551
Income before income taxes $ $ $ 4,072 $ $ $ 6,935
Notes to Interim Condensed Consolidated Financial Statements (continued)
(In thousands of Canadian dollars, except per share amounts)
(Unaudited)
9
3. Operating segments
The Company has two reportable operating segments:
(a) The “Direct-to-Consumer” segment comprises sales through corporate retail stores and
e-commerce; and
(b) The “Partners and Other” segment consists primarily of the wholesale of Roots-branded
products to our international operating partner and the royalties earned on the retail sales of
Roots-branded products by our partner. The Partners and Other segment also consists of
royalties earned through the licensing of our brand to select manufacturing partners, the
wholesale of Roots-branded products to select retail partners, and the sale of custom Roots-
branded products to select business clients.
The Company defines an operating segment on the same basis that the Chief Operating Decision
Maker (the “CODM”) uses to evaluate performance internally and to allocate resources. The
Company has determined that the President and Chief Executive Officer is its CODM. The accounting
policies of the reportable segments are the same as those described in Note 2. The Company
measures each reportable operating segment’s performance based on sales and gross profit, which
is the profit metric used by the CODM for assessing performance of each segment. The Company
does not report total assets or total liabilities based on its operating segments.
Information for each reportable operating segment, as presented to the CODM, is included below:
November 3, 2018 October 28, 2017
(13 weeks) (13 weeks)
Direct-to- Partners Direct-to- Partners
Consumer and Other Total Consumer and Other Total
Sales $ 70,727 $ 16,252 $ 86,979 $ 77,176 $ 12,514 $ 89,690
Cost of goods sold 26,892 12,157 39,049 31,548 8,872 40,420
Gross profit 43,835 4,095 47,930 45,628 3,642 49,270
Selling, general and
administrative expenses1 42,465 40,784
Income before interest expense and
income taxes expense 5,465 8,486
Interest expense1 1,393 1,551
Income before income taxes $ $ $ 4,072 $ $ $ 6,935
Paraphrase This Document
Need a fresh take? Get an instant paraphrase of this document with our AI Paraphraser
ROOTS CORPORATION
Notes to Interim Condensed Consolidated Financial Statements (continued)
(In thousands of Canadian dollars, except per share amounts)
(Unaudited)
10
November 3, 2018 October 28, 2017
(39 weeks) (39 weeks)
Direct-to- Partners Direct-to- Partners
Consumer and Other Total Consumer and Other Total
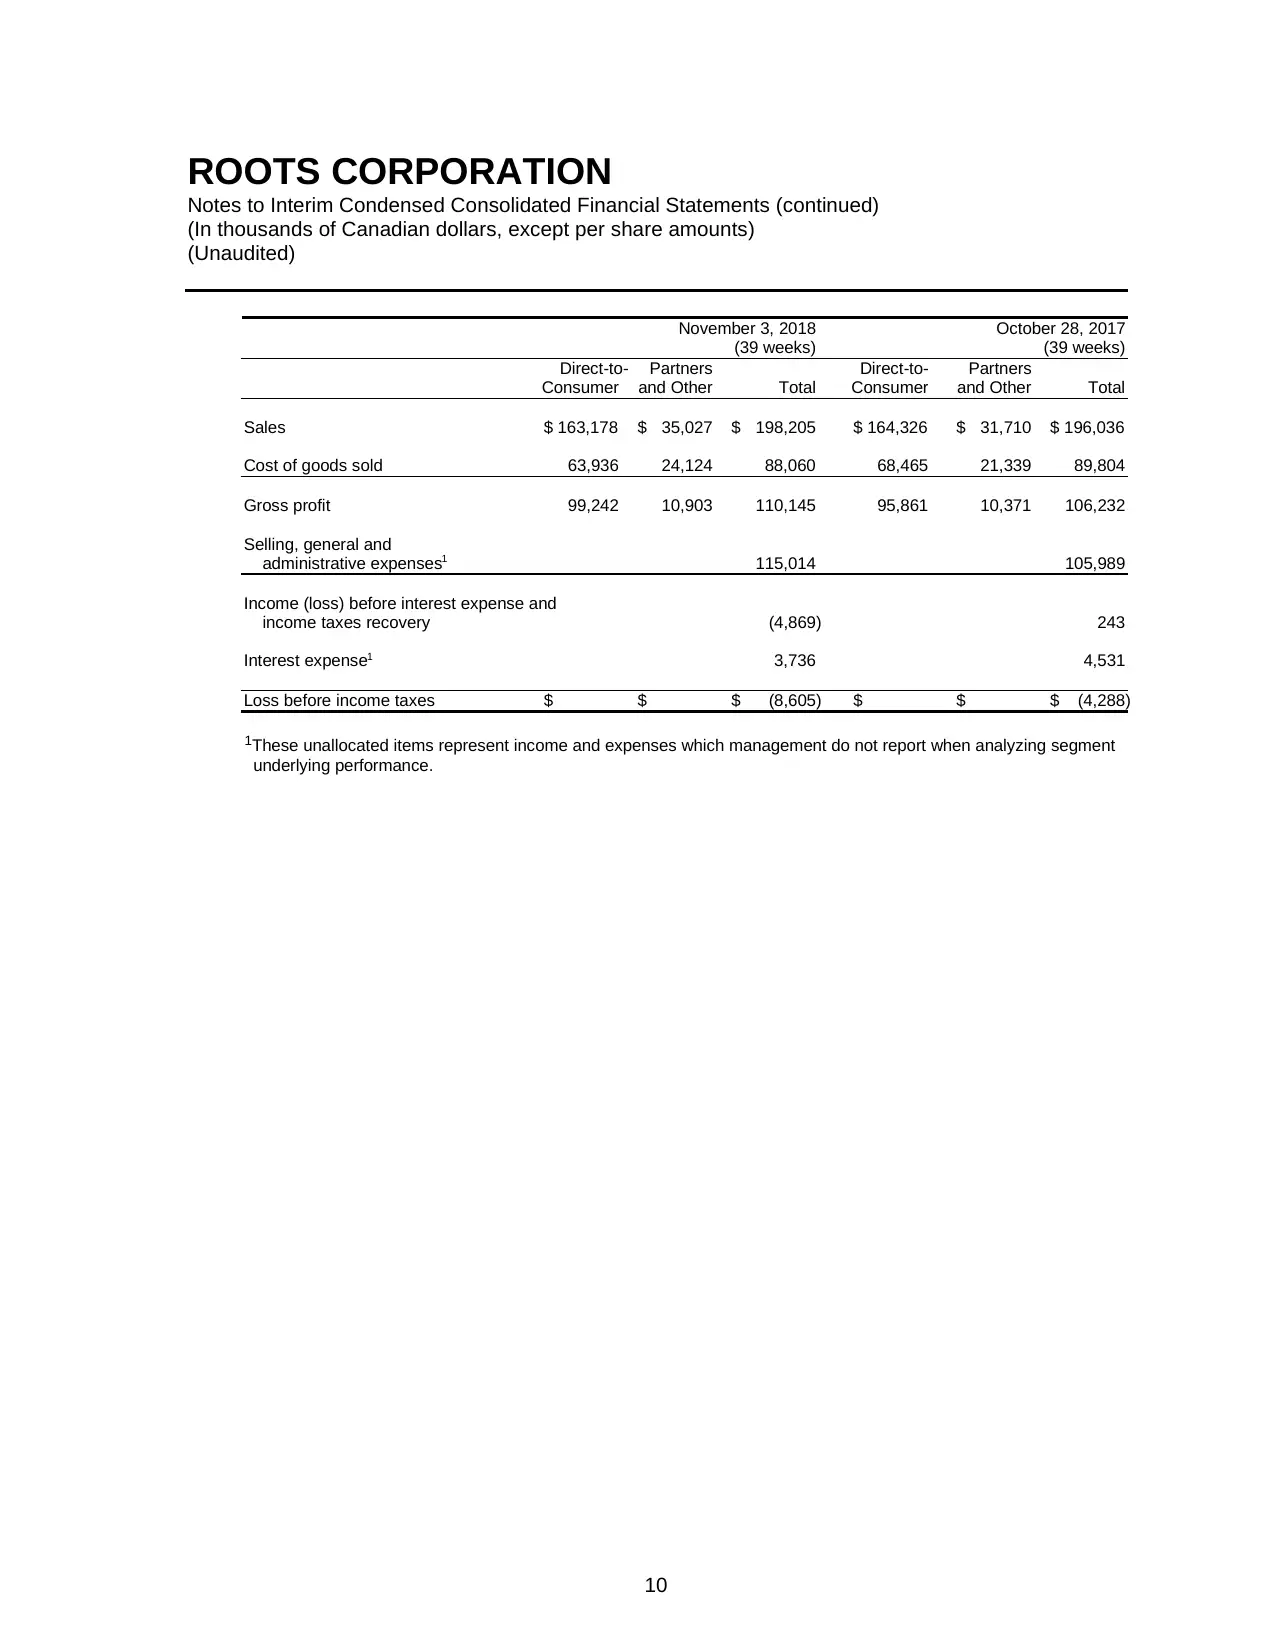
Sales $ 163,178 $ 35,027 $ 198,205 $ 164,326 $ 31,710 $ 196,036
Cost of goods sold 63,936 24,124 88,060 68,465 21,339 89,804
Gross profit 99,242 10,903 110,145 95,861 10,371 106,232
Selling, general and
administrative expenses1 115,014 105,989
Income (loss) before interest expense and
income taxes recovery (4,869) 243
Interest expense1 3,736 4,531
Loss before income taxes $ $ $ (8,605) $ $ $ (4,288)
1These unallocated items represent income and expenses which management do not report when analyzing segment
underlying performance.
Notes to Interim Condensed Consolidated Financial Statements (continued)
(In thousands of Canadian dollars, except per share amounts)
(Unaudited)
10
November 3, 2018 October 28, 2017
(39 weeks) (39 weeks)
Direct-to- Partners Direct-to- Partners
Consumer and Other Total Consumer and Other Total
Sales $ 163,178 $ 35,027 $ 198,205 $ 164,326 $ 31,710 $ 196,036
Cost of goods sold 63,936 24,124 88,060 68,465 21,339 89,804
Gross profit 99,242 10,903 110,145 95,861 10,371 106,232
Selling, general and
administrative expenses1 115,014 105,989
Income (loss) before interest expense and
income taxes recovery (4,869) 243
Interest expense1 3,736 4,531
Loss before income taxes $ $ $ (8,605) $ $ $ (4,288)
1These unallocated items represent income and expenses which management do not report when analyzing segment
underlying performance.
ROOTS CORPORATION
Notes to Interim Condensed Consolidated Financial Statements (continued)
(In thousands of Canadian dollars, except per share amounts)
(Unaudited)
11
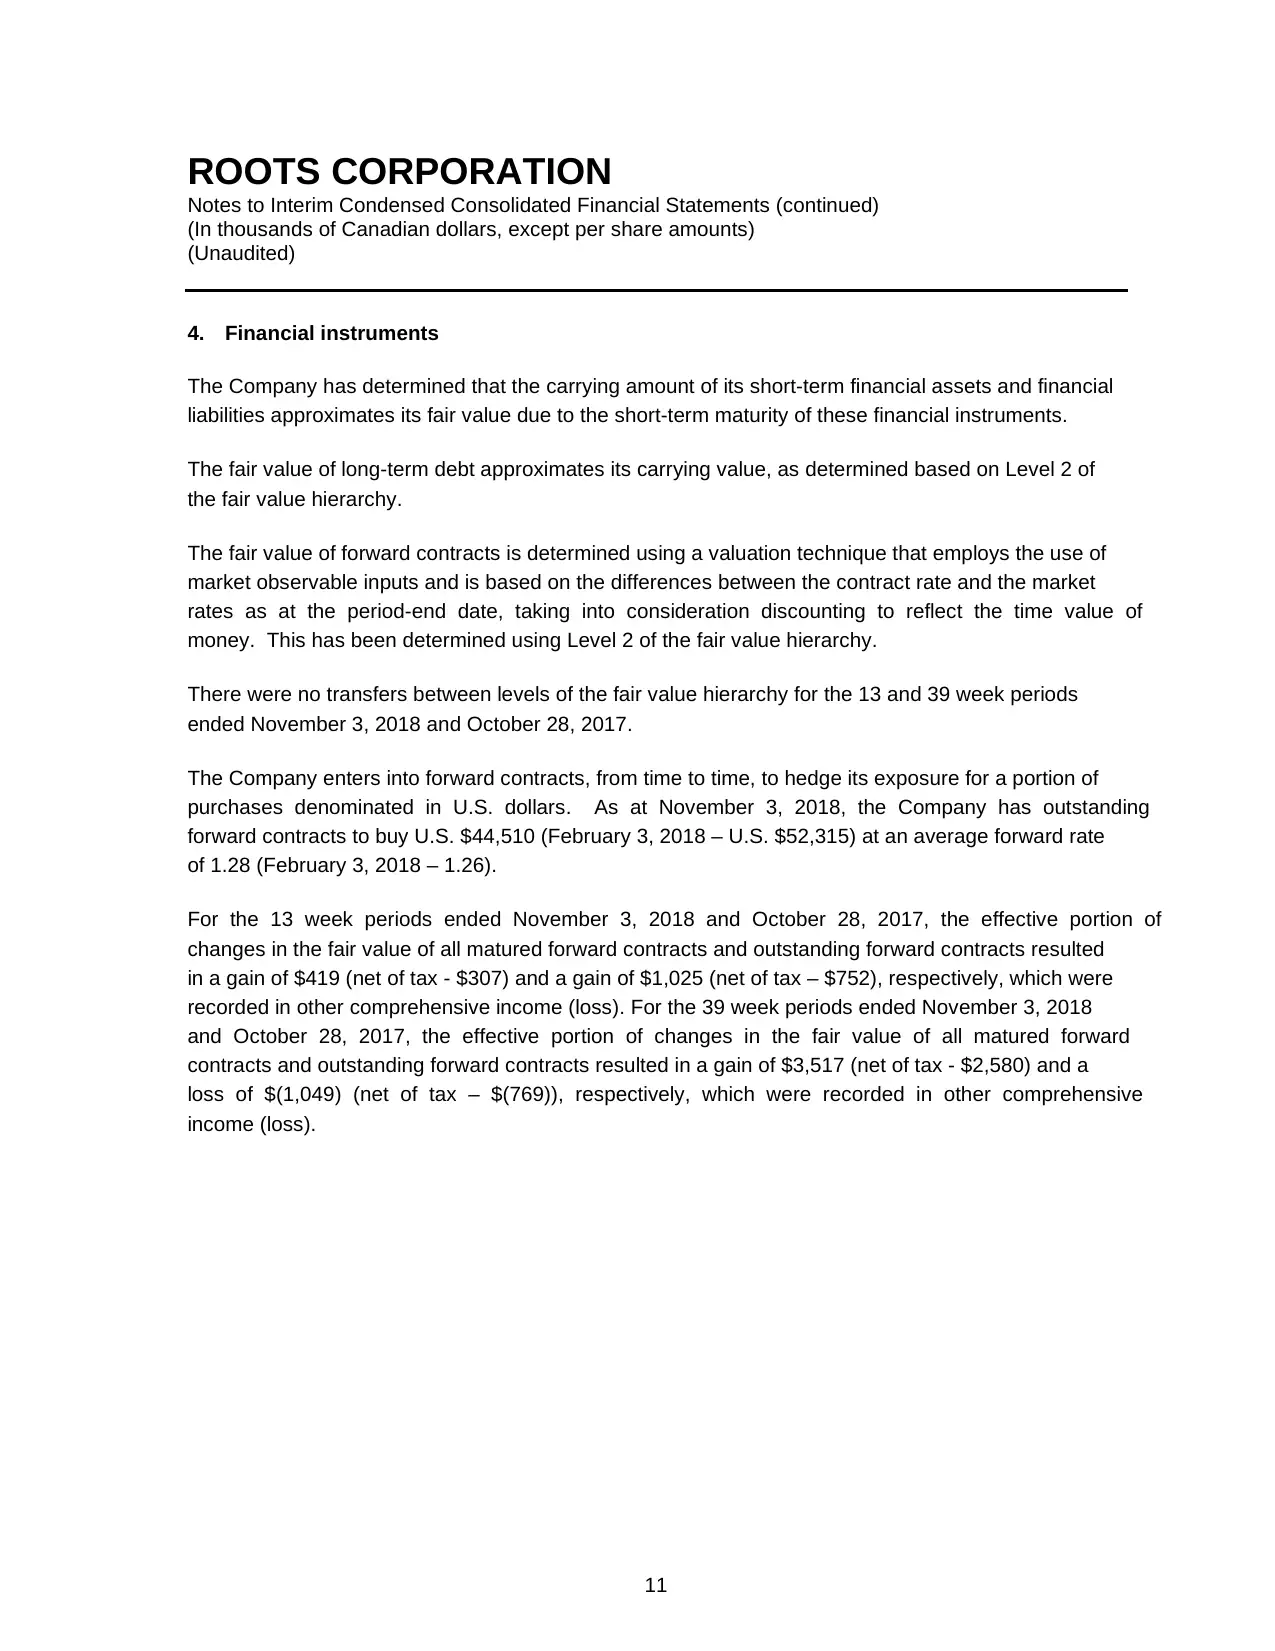
4. Financial instruments
The Company has determined that the carrying amount of its short-term financial assets and financial
liabilities approximates its fair value due to the short-term maturity of these financial instruments.
The fair value of long-term debt approximates its carrying value, as determined based on Level 2 of
the fair value hierarchy.
The fair value of forward contracts is determined using a valuation technique that employs the use of
market observable inputs and is based on the differences between the contract rate and the market
rates as at the period-end date, taking into consideration discounting to reflect the time value of
money. This has been determined using Level 2 of the fair value hierarchy.
There were no transfers between levels of the fair value hierarchy for the 13 and 39 week periods
ended November 3, 2018 and October 28, 2017.
The Company enters into forward contracts, from time to time, to hedge its exposure for a portion of
purchases denominated in U.S. dollars. As at November 3, 2018, the Company has outstanding
forward contracts to buy U.S. $44,510 (February 3, 2018 – U.S. $52,315) at an average forward rate
of 1.28 (February 3, 2018 – 1.26).
For the 13 week periods ended November 3, 2018 and October 28, 2017, the effective portion of
changes in the fair value of all matured forward contracts and outstanding forward contracts resulted
in a gain of $419 (net of tax - $307) and a gain of $1,025 (net of tax – $752), respectively, which were
recorded in other comprehensive income (loss). For the 39 week periods ended November 3, 2018
and October 28, 2017, the effective portion of changes in the fair value of all matured forward
contracts and outstanding forward contracts resulted in a gain of $3,517 (net of tax - $2,580) and a
loss of $(1,049) (net of tax – $(769)), respectively, which were recorded in other comprehensive
income (loss).
Notes to Interim Condensed Consolidated Financial Statements (continued)
(In thousands of Canadian dollars, except per share amounts)
(Unaudited)
11
4. Financial instruments
The Company has determined that the carrying amount of its short-term financial assets and financial
liabilities approximates its fair value due to the short-term maturity of these financial instruments.
The fair value of long-term debt approximates its carrying value, as determined based on Level 2 of
the fair value hierarchy.
The fair value of forward contracts is determined using a valuation technique that employs the use of
market observable inputs and is based on the differences between the contract rate and the market
rates as at the period-end date, taking into consideration discounting to reflect the time value of
money. This has been determined using Level 2 of the fair value hierarchy.
There were no transfers between levels of the fair value hierarchy for the 13 and 39 week periods
ended November 3, 2018 and October 28, 2017.
The Company enters into forward contracts, from time to time, to hedge its exposure for a portion of
purchases denominated in U.S. dollars. As at November 3, 2018, the Company has outstanding
forward contracts to buy U.S. $44,510 (February 3, 2018 – U.S. $52,315) at an average forward rate
of 1.28 (February 3, 2018 – 1.26).
For the 13 week periods ended November 3, 2018 and October 28, 2017, the effective portion of
changes in the fair value of all matured forward contracts and outstanding forward contracts resulted
in a gain of $419 (net of tax - $307) and a gain of $1,025 (net of tax – $752), respectively, which were
recorded in other comprehensive income (loss). For the 39 week periods ended November 3, 2018
and October 28, 2017, the effective portion of changes in the fair value of all matured forward
contracts and outstanding forward contracts resulted in a gain of $3,517 (net of tax - $2,580) and a
loss of $(1,049) (net of tax – $(769)), respectively, which were recorded in other comprehensive
income (loss).
⊘ This is a preview!⊘
Do you want full access?
Subscribe today to unlock all pages.
Trusted by 1+ million students worldwide
1 out of 23
Related Documents


Your All-in-One AI-Powered Toolkit for Academic Success.
+13062052269
info@desklib.com
Available 24*7 on WhatsApp / Email
![[object Object]](/_next/static/media/star-bottom.7253800d.svg)
Unlock your academic potential
Copyright © 2020–2026 A2Z Services. All Rights Reserved. Developed and managed by ZUCOL.