Financial Analysis of Roots Corporation: Board Report and Case Study
VerifiedAdded on 2022/09/18
|27
|9190
|26
Case Study
AI Summary
This case study analyzes the financial performance of Roots Corporation, examining its interim condensed consolidated financial statements for the 13 and 39 week periods ending November 2, 2019, and November 3, 2018. The analysis, prepared for a board of directors meeting, utilizes the financial analysis framework and financial ratios to assess the company's performance. It includes a review of the statement of financial position, statement of net income (loss), statement of comprehensive income (loss), statement of changes in shareholders' equity, and statement of cash flows. The report identifies areas of concern and potential improvements, offering a comprehensive overview of Roots Corporation's financial health. The analysis covers key financial metrics, including sales, cost of goods sold, gross profit, selling, general and administrative expenses, interest expense, and income taxes. The study also considers basic and diluted earnings per share. Finally, the report offers recommendations for the board's consideration and provides answers to questions that might be posed at the board meeting.
ROOTS CORPORATION
Interim Condensed Consolidated Financial Statements
For the 13 and 39 week periods ended November 2, 2019 and November 3, 2018
In Canadian dollars
(Unaudited)
Interim Condensed Consolidated Financial Statements
For the 13 and 39 week periods ended November 2, 2019 and November 3, 2018
In Canadian dollars
(Unaudited)
Paraphrase This Document
Need a fresh take? Get an instant paraphrase of this document with our AI Paraphraser
1
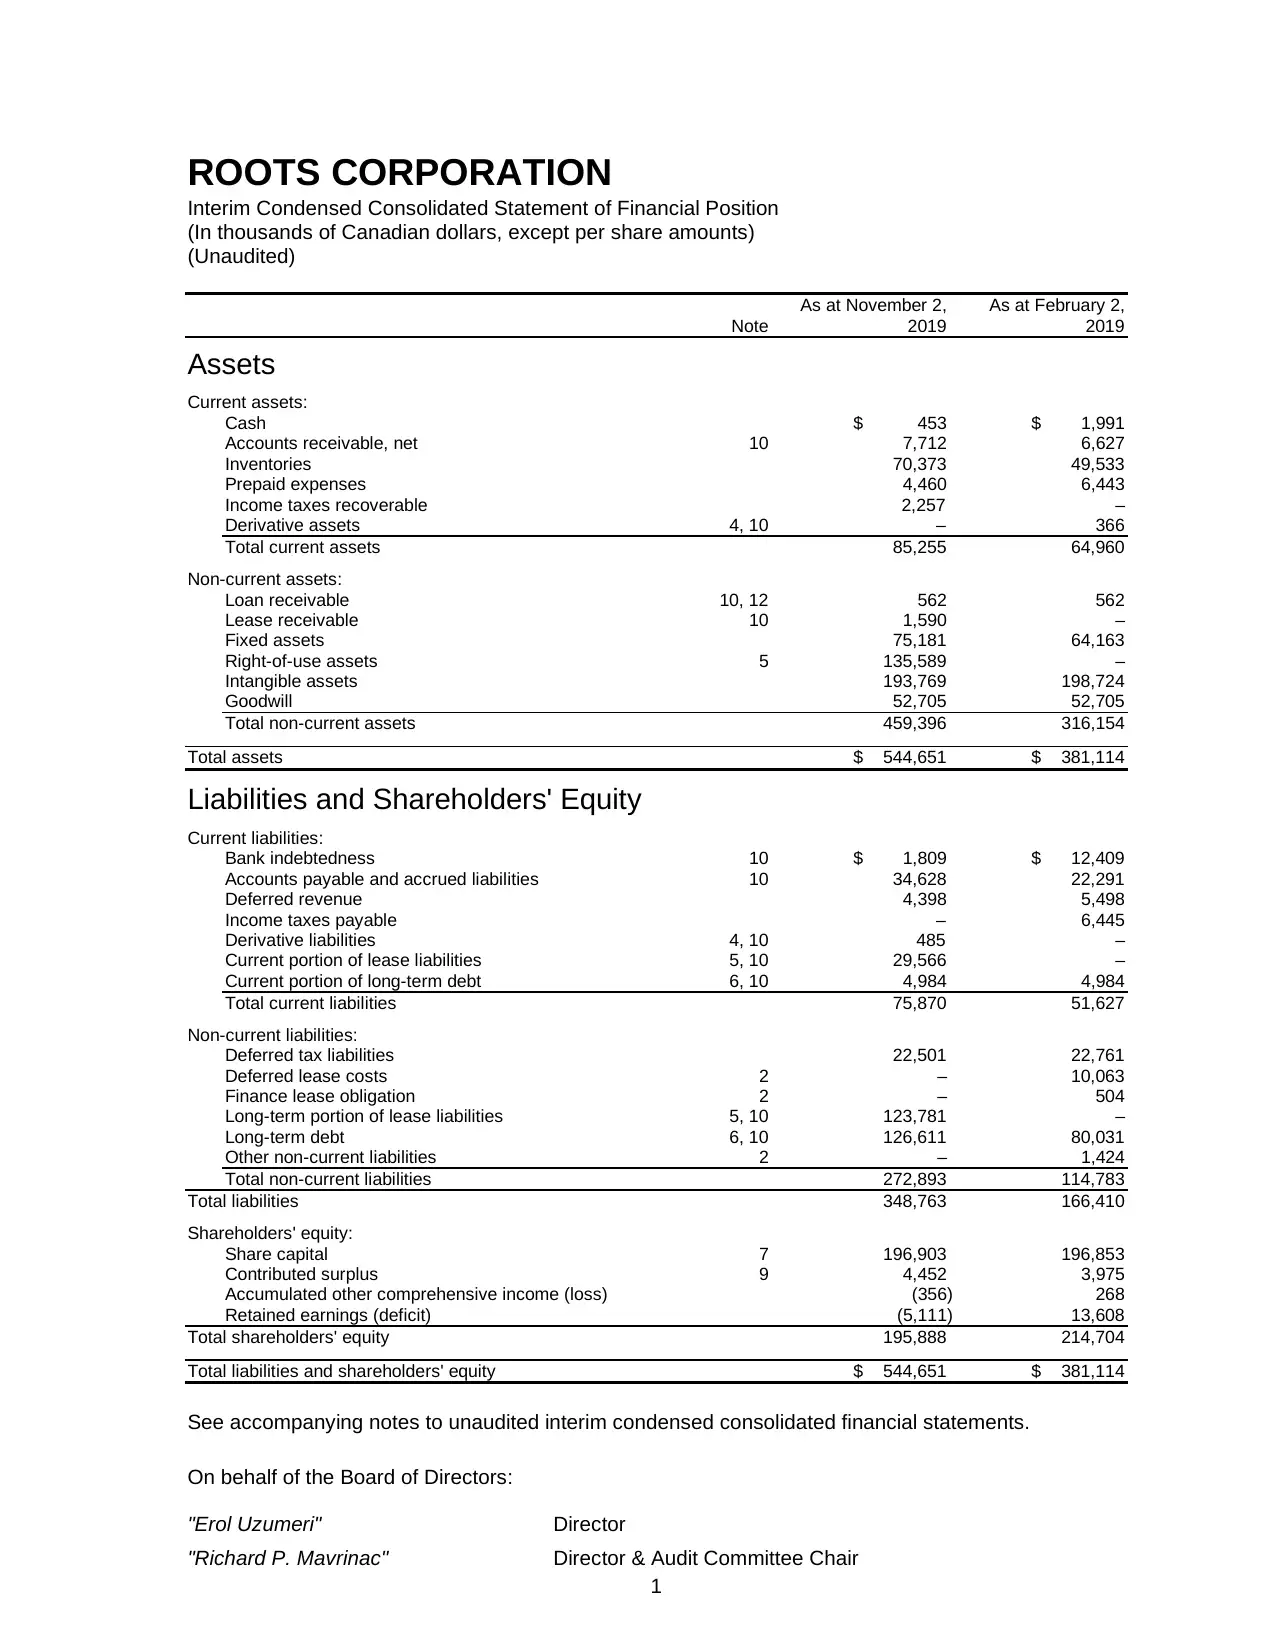
ROOTS CORPORATION
Interim Condensed Consolidated Statement of Financial Position
(In thousands of Canadian dollars, except per share amounts)
(Unaudited)
As at November 2, As at February 2,
Note 2019 2019
Assets
Current assets:
Cash $ 453 $ 1,991
Accounts receivable, net 10 7,712 6,627
Inventories 70,373 49,533
Prepaid expenses 4,460 6,443
Income taxes recoverable 2,257 –
Derivative assets 4, 10 – 366
Total current assets 85,255 64,960
Non-current assets:
Loan receivable 10, 12 562 562
Lease receivable 10 1,590 –
Fixed assets 75,181 64,163
Right-of-use assets 5 135,589 –
Intangible assets 193,769 198,724
Goodwill 52,705 52,705
Total non-current assets 459,396 316,154
Total assets $ 544,651 $ 381,114
Liabilities and Shareholders' Equity
Current liabilities:
Bank indebtedness 10 $ 1,809 $ 12,409
Accounts payable and accrued liabilities 10 34,628 22,291
Deferred revenue 4,398 5,498
Income taxes payable – 6,445
Derivative liabilities 4, 10 485 –
Current portion of lease liabilities 5, 10 29,566 –
Current portion of long-term debt 6, 10 4,984 4,984
Total current liabilities 75,870 51,627
Non-current liabilities:
Deferred tax liabilities 22,501 22,761
Deferred lease costs 2 – 10,063
Finance lease obligation 2 – 504
Long-term portion of lease liabilities 5, 10 123,781 –
Long-term debt 6, 10 126,611 80,031
Other non-current liabilities 2 – 1,424
Total non-current liabilities 272,893 114,783
Total liabilities 348,763 166,410
Shareholders' equity:
Share capital 7 196,903 196,853
Contributed surplus 9 4,452 3,975
Accumulated other comprehensive income (loss) (356) 268
Retained earnings (deficit) (5,111) 13,608
Total shareholders' equity 195,888 214,704
Total liabilities and shareholders' equity $ 544,651 $ 381,114
See accompanying notes to unaudited interim condensed consolidated financial statements.
On behalf of the Board of Directors:
"Erol Uzumeri" Director
"Richard P. Mavrinac" Director & Audit Committee Chair
2
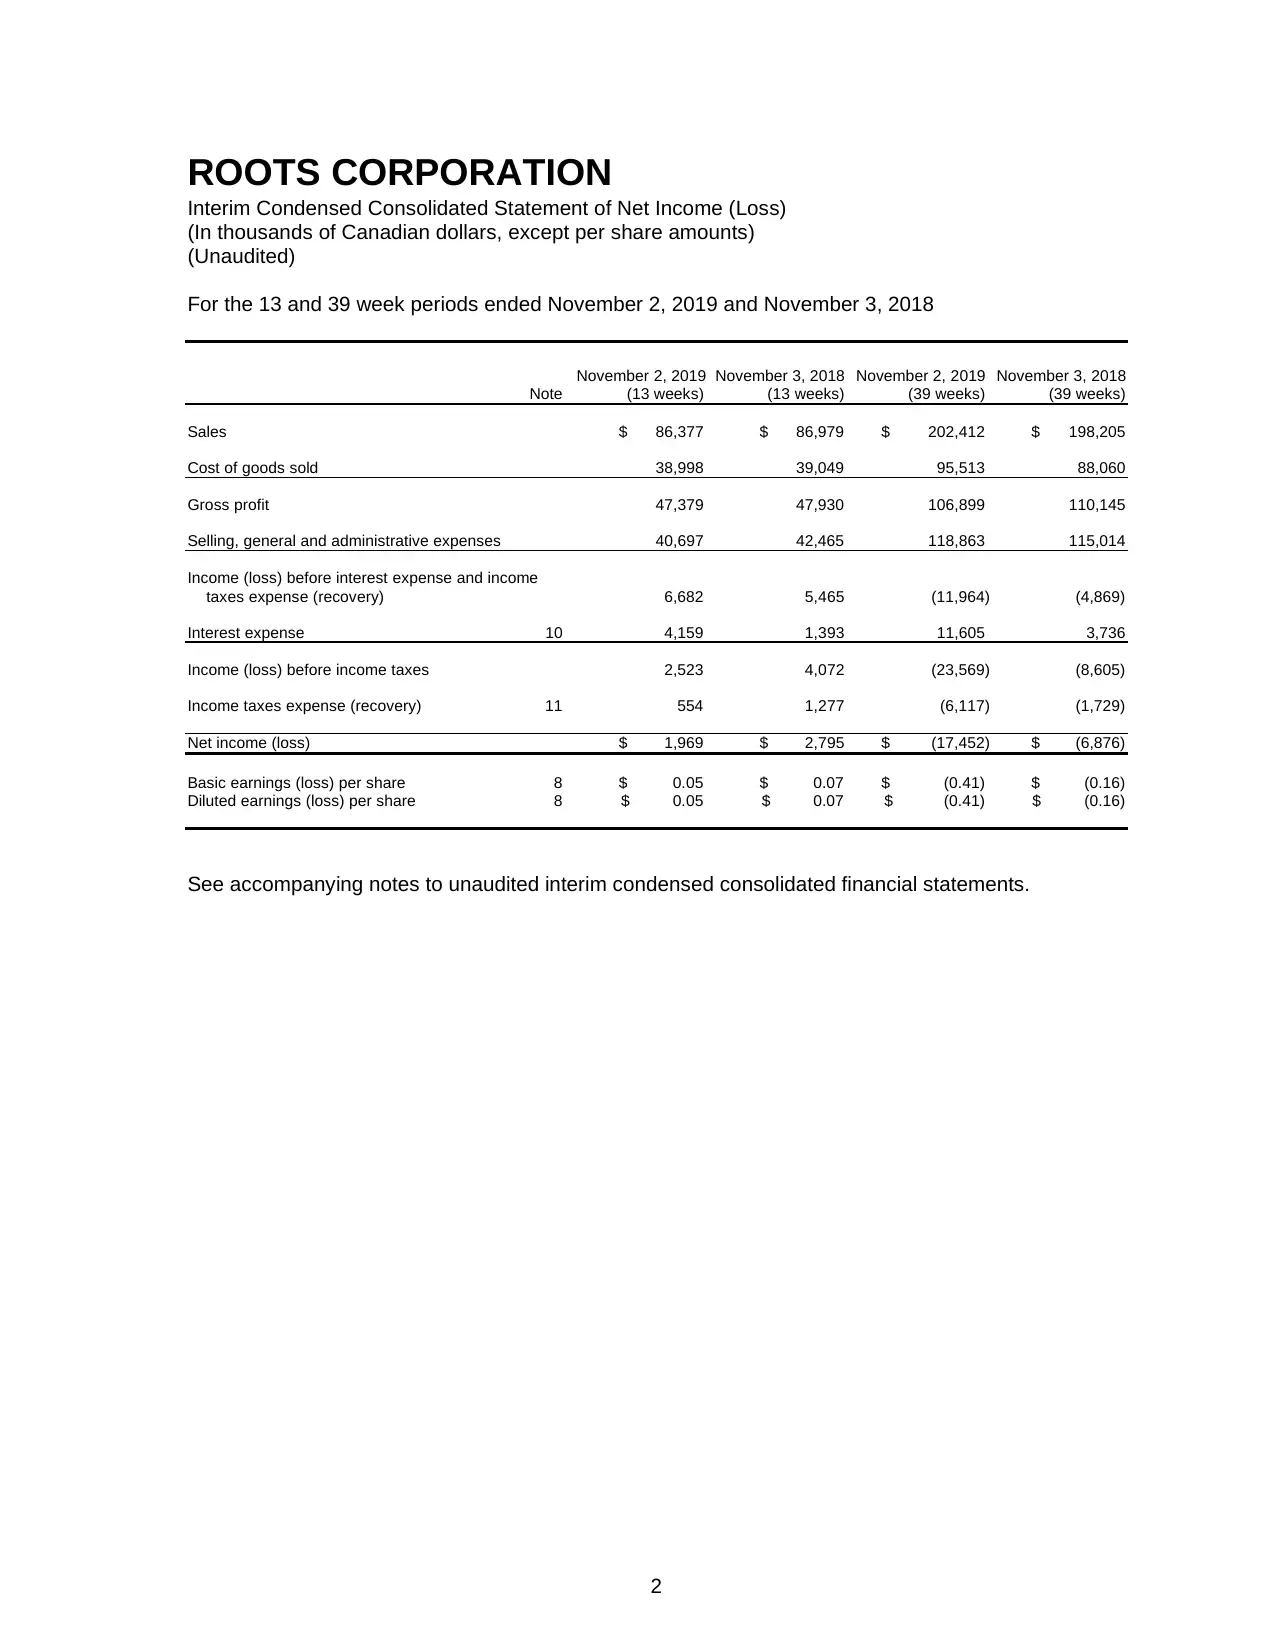
ROOTS CORPORATION
Interim Condensed Consolidated Statement of Net Income (Loss)
(In thousands of Canadian dollars, except per share amounts)
(Unaudited)
For the 13 and 39 week periods ended November 2, 2019 and November 3, 2018
November 2, 2019 November 3, 2018 November 2, 2019 November 3, 2018
Note (13 weeks) (13 weeks) (39 weeks) (39 weeks)
Sales $ 86,377 $ 86,979 $ 202,412 $ 198,205
Cost of goods sold 38,998 39,049 95,513 88,060
Gross profit 47,379 47,930 106,899 110,145
Selling, general and administrative expenses 40,697 42,465 118,863 115,014
Income (loss) before interest expense and income
taxes expense (recovery) 6,682 5,465 (11,964) (4,869)
Interest expense 10 4,159 1,393 11,605 3,736
Income (loss) before income taxes 2,523 4,072 (23,569) (8,605)
Income taxes expense (recovery) 11 554 1,277 (6,117) (1,729)
Net income (loss) $ 1,969 $ 2,795 $ (17,452) $ (6,876)
Basic earnings (loss) per share 8 $ 0.05 $ 0.07 $ (0.41) $ (0.16)
Diluted earnings (loss) per share 8 $ 0.05 $ 0.07 $ (0.41) $ (0.16)
See accompanying notes to unaudited interim condensed consolidated financial statements.
⊘ This is a preview!⊘
Do you want full access?
Subscribe today to unlock all pages.
Trusted by 1+ million students worldwide
3
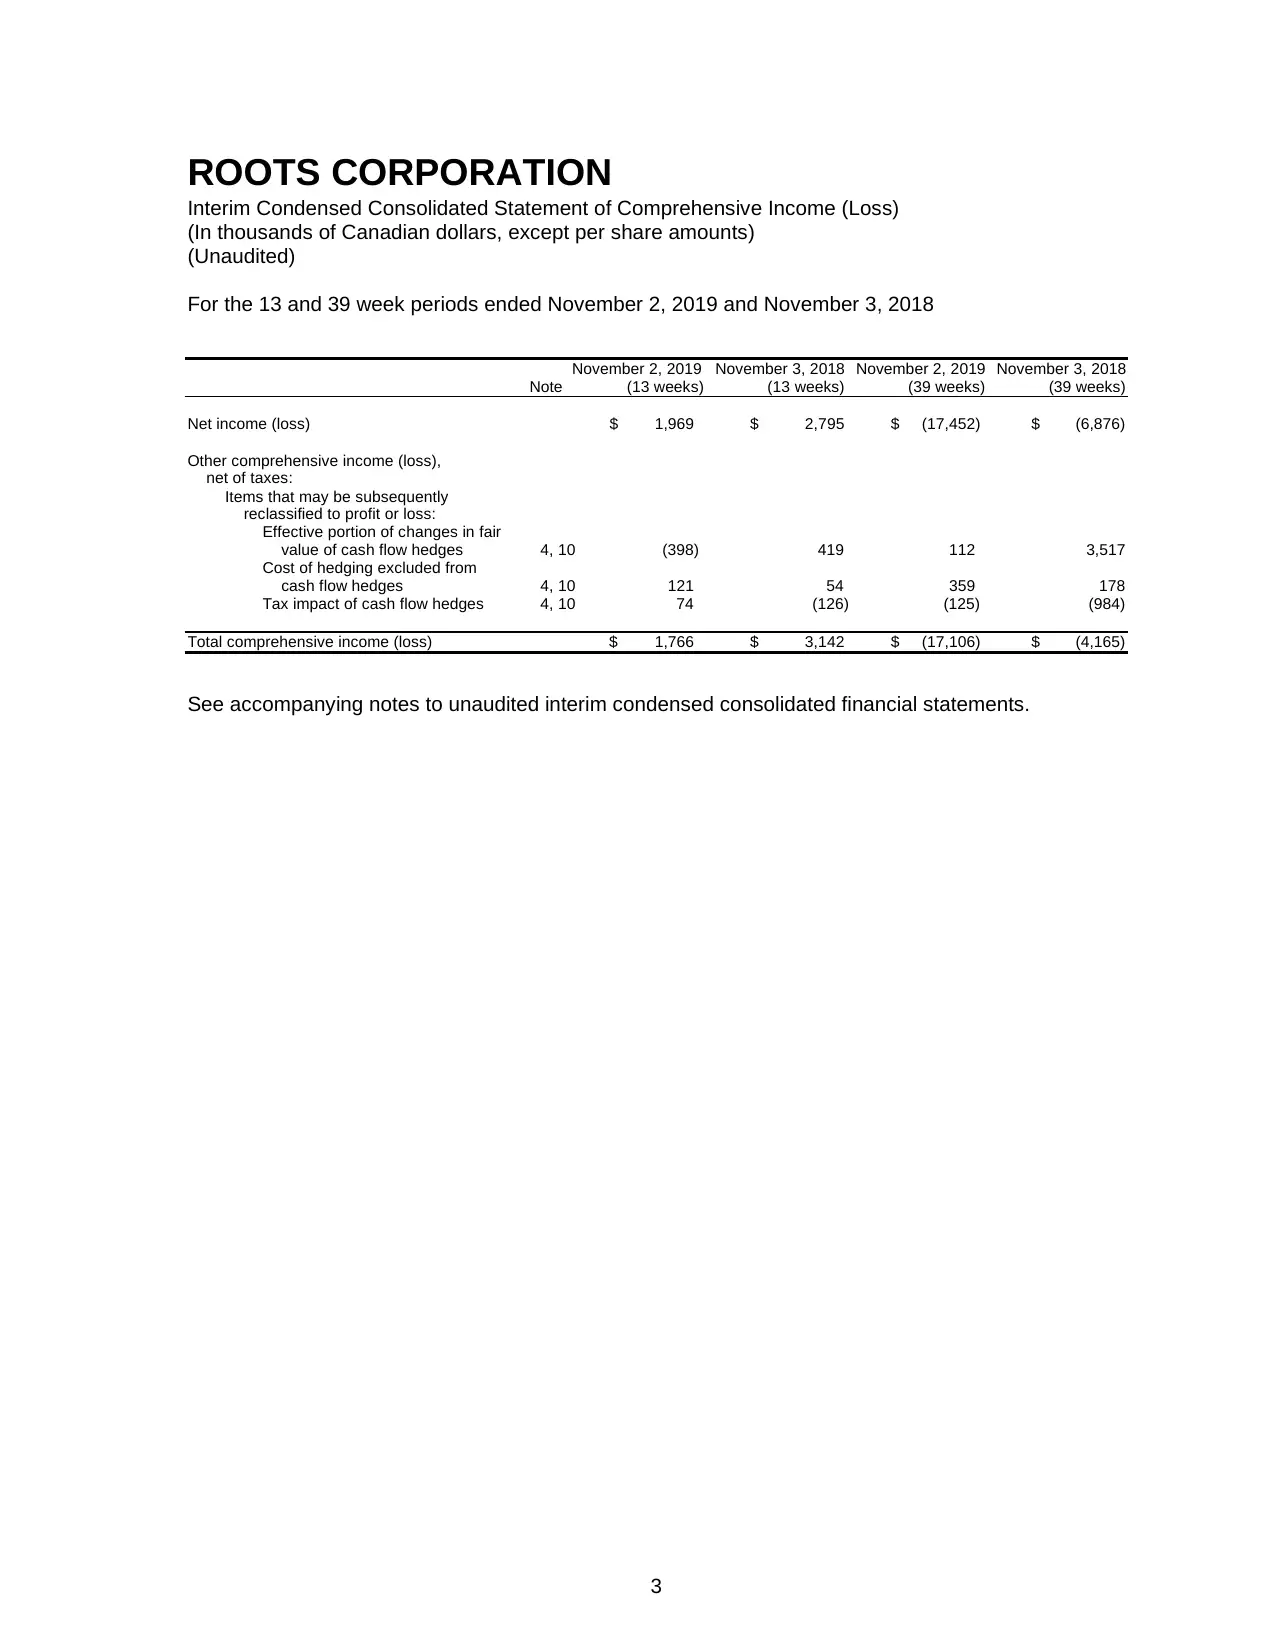
ROOTS CORPORATION
Interim Condensed Consolidated Statement of Comprehensive Income (Loss)
(In thousands of Canadian dollars, except per share amounts)
(Unaudited)
For the 13 and 39 week periods ended November 2, 2019 and November 3, 2018
November 2, 2019 November 3, 2018 November 2, 2019 November 3, 2018
Note (13 weeks) (13 weeks) (39 weeks) (39 weeks)
Net income (loss) $ 1,969 $ 2,795 $ (17,452) $ (6,876)
Other comprehensive income (loss),
net of taxes:
Items that may be subsequently
reclassified to profit or loss:
Effective portion of changes in fair
value of cash flow hedges 4, 10 (398) 419 112 3,517
Cost of hedging excluded from
cash flow hedges 4, 10 121 54 359 178
Tax impact of cash flow hedges 4, 10 74 (126) (125) (984)
Total comprehensive income (loss) $ 1,766 $ 3,142 $ (17,106) $ (4,165)
See accompanying notes to unaudited interim condensed consolidated financial statements.
Paraphrase This Document
Need a fresh take? Get an instant paraphrase of this document with our AI Paraphraser
4
ROOTS CORPORATION
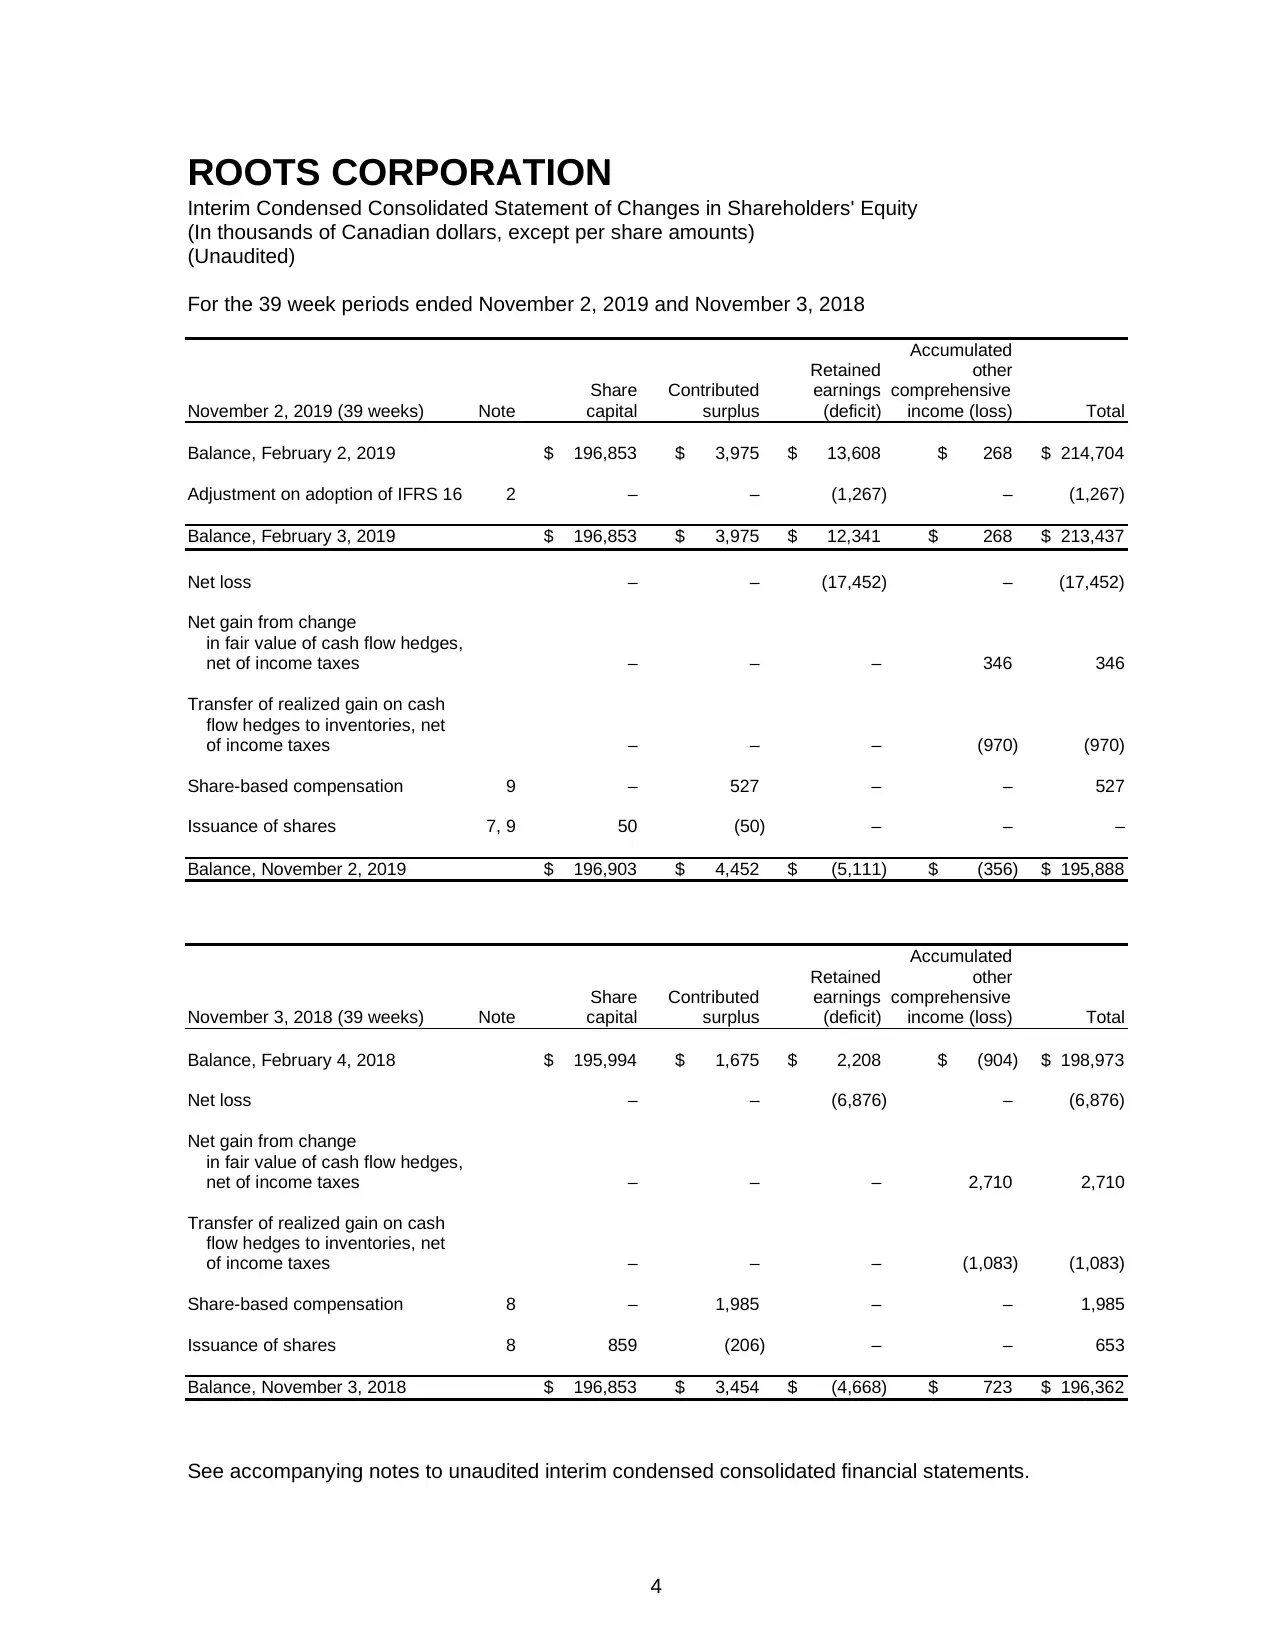
Interim Condensed Consolidated Statement of Changes in Shareholders' Equity
(In thousands of Canadian dollars, except per share amounts)
(Unaudited)
For the 39 week periods ended November 2, 2019 and November 3, 2018
Accumulated
Retained other
Share Contributed earnings comprehensive
November 2, 2019 (39 weeks) Note capital surplus (deficit) income (loss) Total
Balance, February 2, 2019 $ 196,853 $ 3,975 $ 13,608 $ 268 $ 214,704
Adjustment on adoption of IFRS 16 2 – – (1,267) – (1,267)
Balance, February 3, 2019 $ 196,853 $ 3,975 $ 12,341 $ 268 $ 213,437
Net loss – – (17,452) – (17,452)
Net gain from change
in fair value of cash flow hedges,
net of income taxes – – – 346 346
Transfer of realized gain on cash
flow hedges to inventories, net
of income taxes – – – (970) (970)
Share-based compensation 9 – 527 – – 527
Issuance of shares 7, 9 50 (50) – – –
Balance, November 2, 2019 $ 196,903 $ 4,452 $ (5,111) $ (356) $ 195,888
Accumulated
Retained other
Share Contributed earnings comprehensive
November 3, 2018 (39 weeks) Note capital surplus (deficit) income (loss) Total
Balance, February 4, 2018 $ 195,994 $ 1,675 $ 2,208 $ (904) $ 198,973
Net loss – – (6,876) – (6,876)
Net gain from change
in fair value of cash flow hedges,
net of income taxes – – – 2,710 2,710
Transfer of realized gain on cash
flow hedges to inventories, net
of income taxes – – – (1,083) (1,083)
Share-based compensation 8 – 1,985 – – 1,985
Issuance of shares 8 859 (206) – – 653
Balance, November 3, 2018 $ 196,853 $ 3,454 $ (4,668) $ 723 $ 196,362
See accompanying notes to unaudited interim condensed consolidated financial statements.
ROOTS CORPORATION
Interim Condensed Consolidated Statement of Changes in Shareholders' Equity
(In thousands of Canadian dollars, except per share amounts)
(Unaudited)
For the 39 week periods ended November 2, 2019 and November 3, 2018
Accumulated
Retained other
Share Contributed earnings comprehensive
November 2, 2019 (39 weeks) Note capital surplus (deficit) income (loss) Total
Balance, February 2, 2019 $ 196,853 $ 3,975 $ 13,608 $ 268 $ 214,704
Adjustment on adoption of IFRS 16 2 – – (1,267) – (1,267)
Balance, February 3, 2019 $ 196,853 $ 3,975 $ 12,341 $ 268 $ 213,437
Net loss – – (17,452) – (17,452)
Net gain from change
in fair value of cash flow hedges,
net of income taxes – – – 346 346
Transfer of realized gain on cash
flow hedges to inventories, net
of income taxes – – – (970) (970)
Share-based compensation 9 – 527 – – 527
Issuance of shares 7, 9 50 (50) – – –
Balance, November 2, 2019 $ 196,903 $ 4,452 $ (5,111) $ (356) $ 195,888
Accumulated
Retained other
Share Contributed earnings comprehensive
November 3, 2018 (39 weeks) Note capital surplus (deficit) income (loss) Total
Balance, February 4, 2018 $ 195,994 $ 1,675 $ 2,208 $ (904) $ 198,973
Net loss – – (6,876) – (6,876)
Net gain from change
in fair value of cash flow hedges,
net of income taxes – – – 2,710 2,710
Transfer of realized gain on cash
flow hedges to inventories, net
of income taxes – – – (1,083) (1,083)
Share-based compensation 8 – 1,985 – – 1,985
Issuance of shares 8 859 (206) – – 653
Balance, November 3, 2018 $ 196,853 $ 3,454 $ (4,668) $ 723 $ 196,362
See accompanying notes to unaudited interim condensed consolidated financial statements.
5
ROOTS CORPORATION
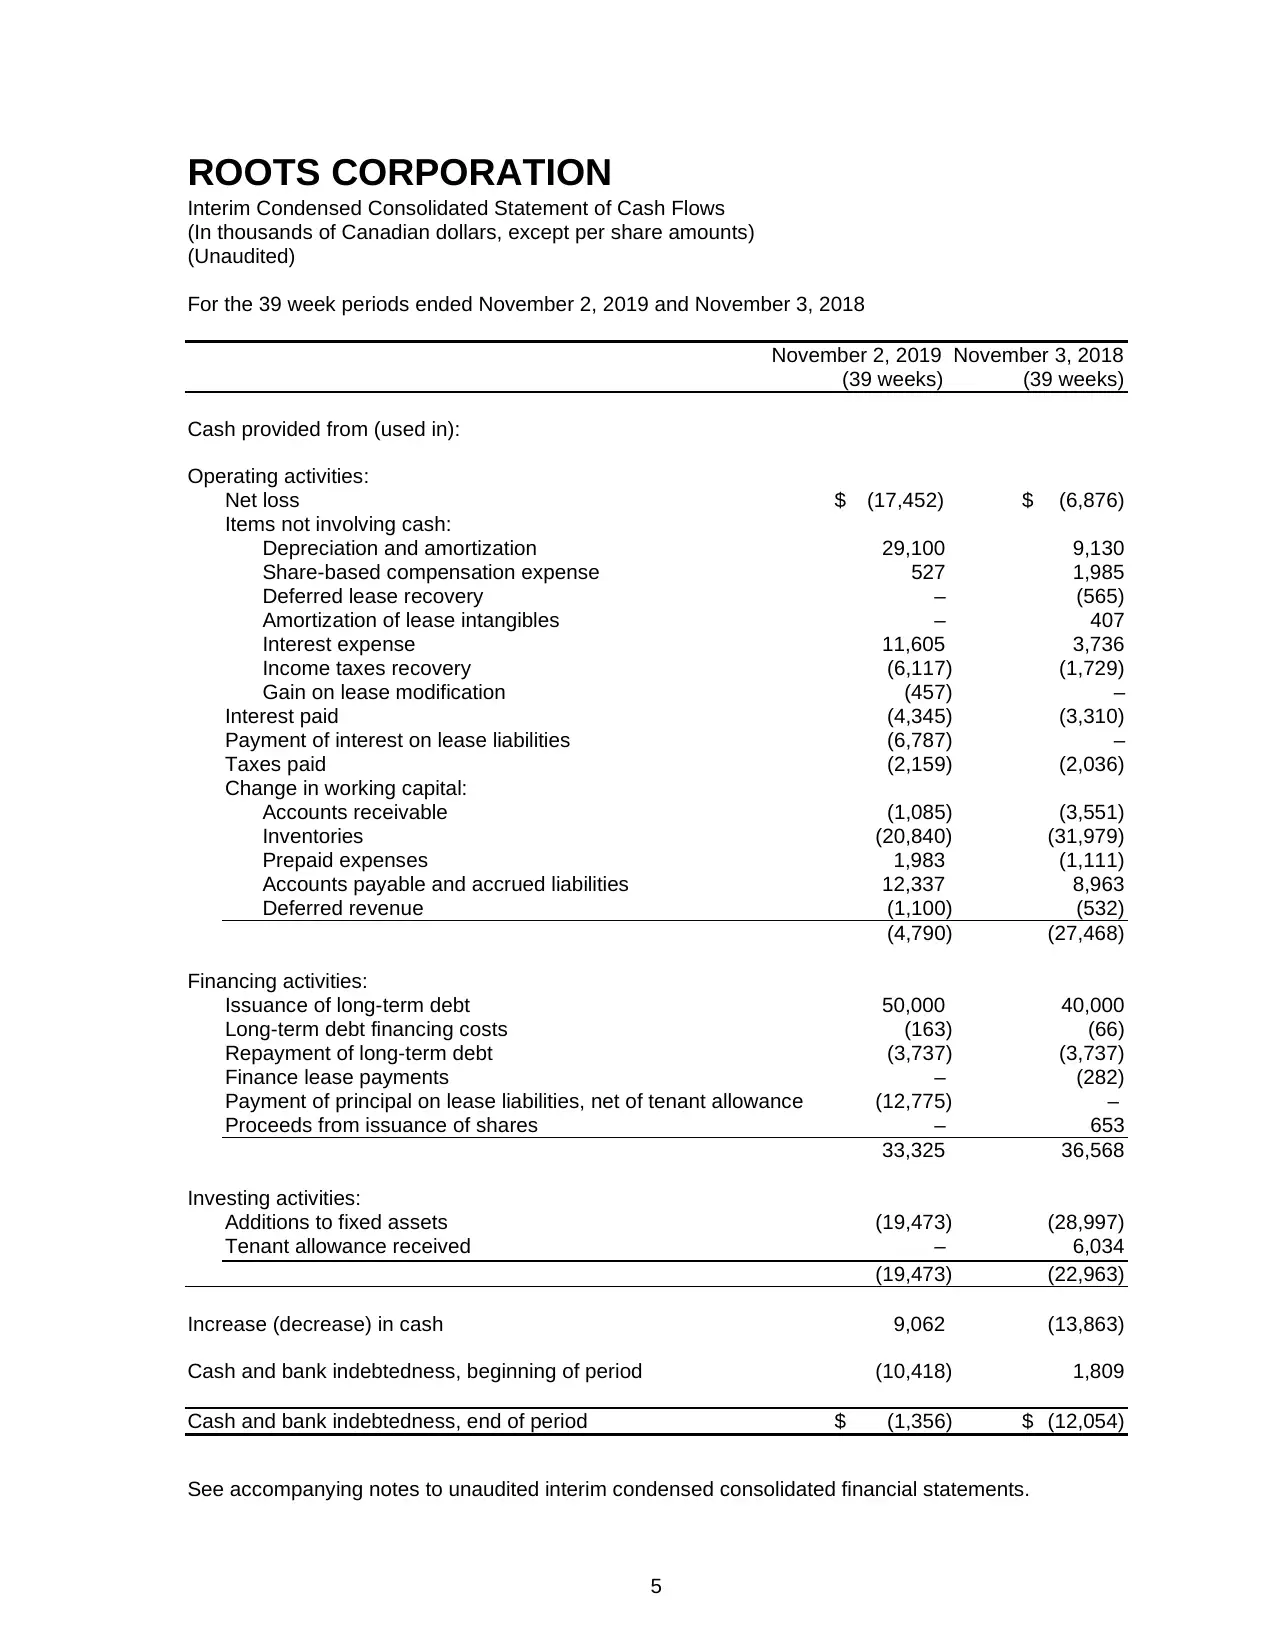
Interim Condensed Consolidated Statement of Cash Flows
(In thousands of Canadian dollars, except per share amounts)
(Unaudited)
For the 39 week periods ended November 2, 2019 and November 3, 2018
November 2, 2019 November 3, 2018
(39 weeks) (39 weeks)
Cash provided from (used in):
Operating activities:
Net loss $ (17,452) $ (6,876)
Items not involving cash:
Depreciation and amortization 29,100 9,130
Share-based compensation expense 527 1,985
Deferred lease recovery – (565)
Amortization of lease intangibles – 407
Interest expense 11,605 3,736
Income taxes recovery (6,117) (1,729)
Gain on lease modification (457) –
Interest paid (4,345) (3,310)
Payment of interest on lease liabilities (6,787) –
Taxes paid (2,159) (2,036)
Change in working capital:
Accounts receivable (1,085) (3,551)
Inventories (20,840) (31,979)
Prepaid expenses 1,983 (1,111)
Accounts payable and accrued liabilities 12,337 8,963
Deferred revenue (1,100) (532)
(4,790) (27,468)
Financing activities:
Issuance of long-term debt 50,000 40,000
Long-term debt financing costs (163) (66)
Repayment of long-term debt (3,737) (3,737)
Finance lease payments – (282)
Payment of principal on lease liabilities, net of tenant allowance (12,775) –
Proceeds from issuance of shares – 653
33,325 36,568
Investing activities:
Additions to fixed assets (19,473) (28,997)
Tenant allowance received – 6,034
(19,473) (22,963)
Increase (decrease) in cash 9,062 (13,863)
Cash and bank indebtedness, beginning of period (10,418) 1,809
Cash and bank indebtedness, end of period $ (1,356) $ (12,054)
See accompanying notes to unaudited interim condensed consolidated financial statements.
ROOTS CORPORATION
Interim Condensed Consolidated Statement of Cash Flows
(In thousands of Canadian dollars, except per share amounts)
(Unaudited)
For the 39 week periods ended November 2, 2019 and November 3, 2018
November 2, 2019 November 3, 2018
(39 weeks) (39 weeks)
Cash provided from (used in):
Operating activities:
Net loss $ (17,452) $ (6,876)
Items not involving cash:
Depreciation and amortization 29,100 9,130
Share-based compensation expense 527 1,985
Deferred lease recovery – (565)
Amortization of lease intangibles – 407
Interest expense 11,605 3,736
Income taxes recovery (6,117) (1,729)
Gain on lease modification (457) –
Interest paid (4,345) (3,310)
Payment of interest on lease liabilities (6,787) –
Taxes paid (2,159) (2,036)
Change in working capital:
Accounts receivable (1,085) (3,551)
Inventories (20,840) (31,979)
Prepaid expenses 1,983 (1,111)
Accounts payable and accrued liabilities 12,337 8,963
Deferred revenue (1,100) (532)
(4,790) (27,468)
Financing activities:
Issuance of long-term debt 50,000 40,000
Long-term debt financing costs (163) (66)
Repayment of long-term debt (3,737) (3,737)
Finance lease payments – (282)
Payment of principal on lease liabilities, net of tenant allowance (12,775) –
Proceeds from issuance of shares – 653
33,325 36,568
Investing activities:
Additions to fixed assets (19,473) (28,997)
Tenant allowance received – 6,034
(19,473) (22,963)
Increase (decrease) in cash 9,062 (13,863)
Cash and bank indebtedness, beginning of period (10,418) 1,809
Cash and bank indebtedness, end of period $ (1,356) $ (12,054)
See accompanying notes to unaudited interim condensed consolidated financial statements.
⊘ This is a preview!⊘
Do you want full access?
Subscribe today to unlock all pages.
Trusted by 1+ million students worldwide
ROOTS CORPORATION
Notes to Interim Condensed Consolidated Financial Statements
(In thousands of Canadian dollars, except per share amounts)
(Unaudited)
6
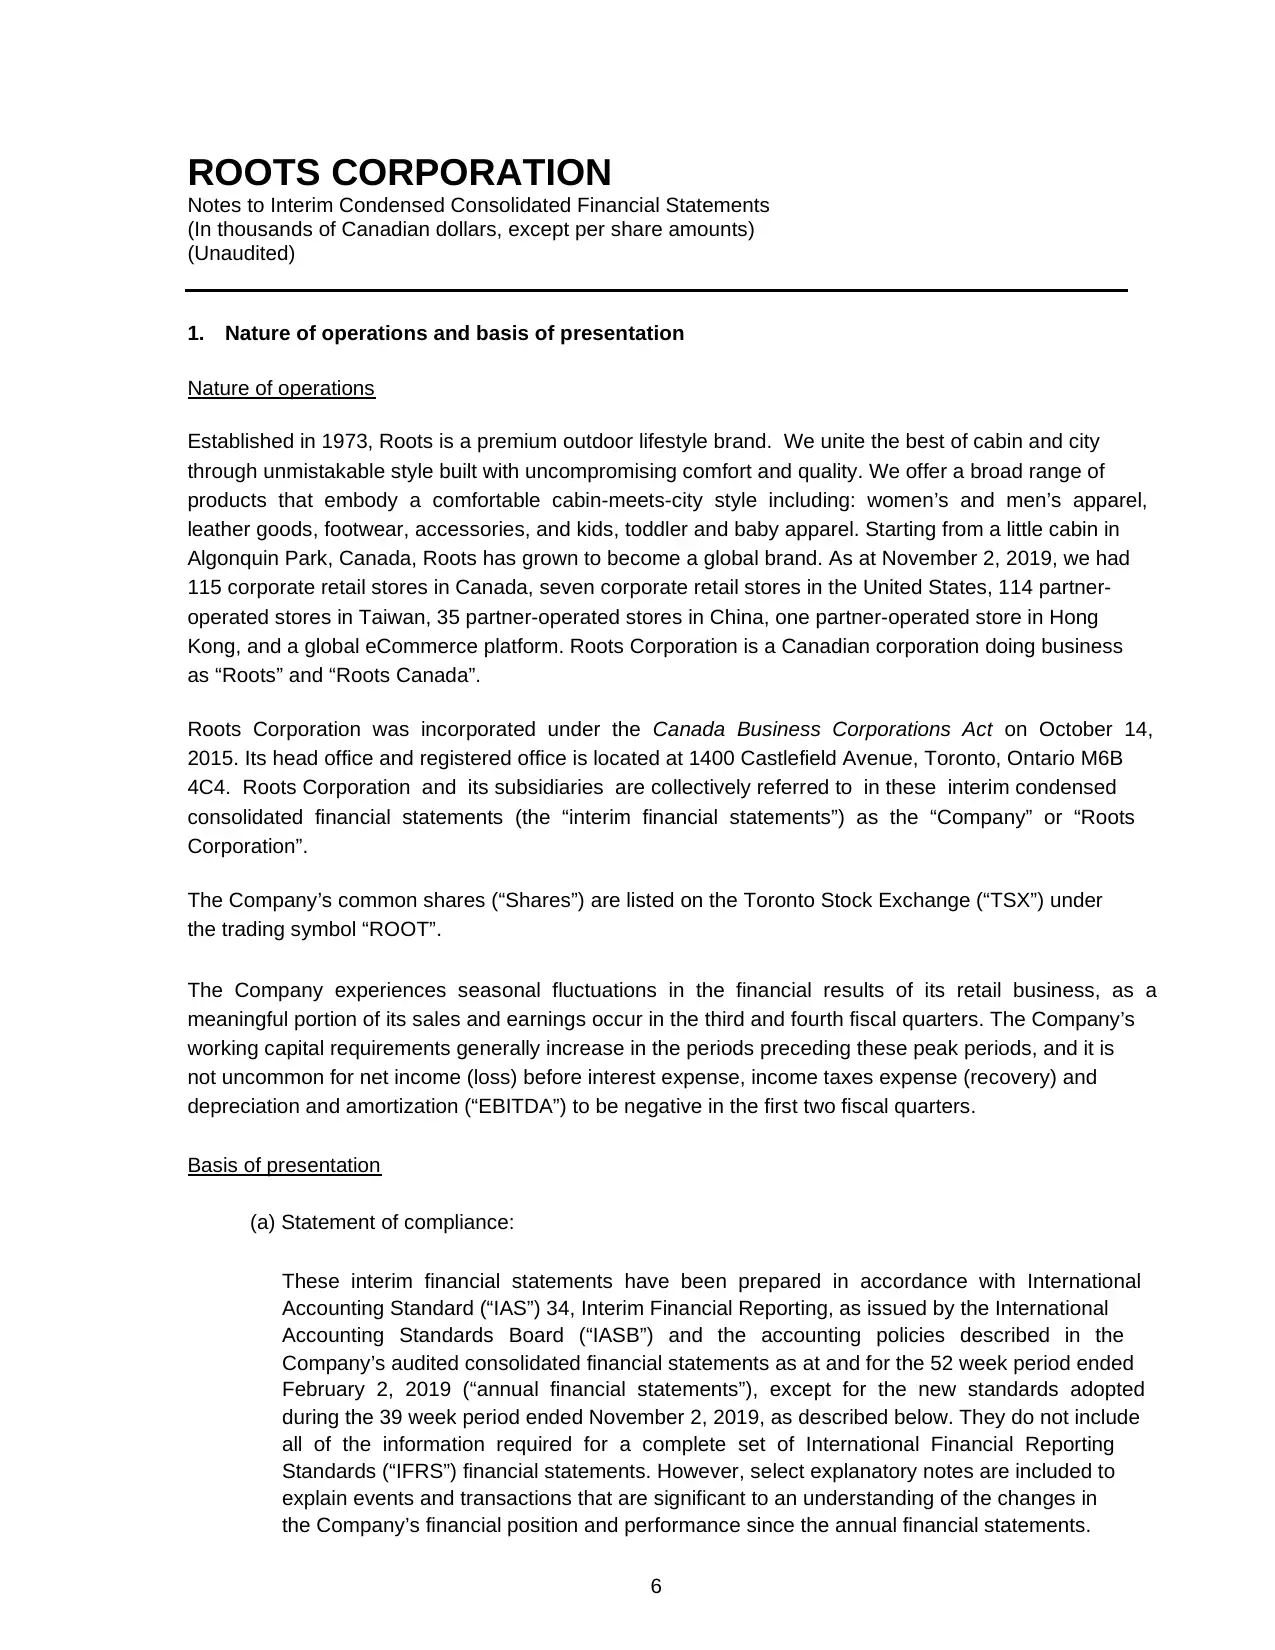
1. Nature of operations and basis of presentation
Nature of operations
Established in 1973, Roots is a premium outdoor lifestyle brand. We unite the best of cabin and city
through unmistakable style built with uncompromising comfort and quality. We offer a broad range of
products that embody a comfortable cabin-meets-city style including: women’s and men’s apparel,
leather goods, footwear, accessories, and kids, toddler and baby apparel. Starting from a little cabin in
Algonquin Park, Canada, Roots has grown to become a global brand. As at November 2, 2019, we had
115 corporate retail stores in Canada, seven corporate retail stores in the United States, 114 partner-
operated stores in Taiwan, 35 partner-operated stores in China, one partner-operated store in Hong
Kong, and a global eCommerce platform. Roots Corporation is a Canadian corporation doing business
as “Roots” and “Roots Canada”.
Roots Corporation was incorporated under the Canada Business Corporations Act on October 14,
2015. Its head office and registered office is located at 1400 Castlefield Avenue, Toronto, Ontario M6B
4C4. Roots Corporation and its subsidiaries are collectively referred to in these interim condensed
consolidated financial statements (the “interim financial statements”) as the “Company” or “Roots
Corporation”.
The Company’s common shares (“Shares”) are listed on the Toronto Stock Exchange (“TSX”) under
the trading symbol “ROOT”.
The Company experiences seasonal fluctuations in the financial results of its retail business, as a
meaningful portion of its sales and earnings occur in the third and fourth fiscal quarters. The Company’s
working capital requirements generally increase in the periods preceding these peak periods, and it is
not uncommon for net income (loss) before interest expense, income taxes expense (recovery) and
depreciation and amortization (“EBITDA”) to be negative in the first two fiscal quarters.
Basis of presentation
(a) Statement of compliance:
These interim financial statements have been prepared in accordance with International
Accounting Standard (“IAS”) 34, Interim Financial Reporting, as issued by the International
Accounting Standards Board (“IASB”) and the accounting policies described in the
Company’s audited consolidated financial statements as at and for the 52 week period ended
February 2, 2019 (“annual financial statements”), except for the new standards adopted
during the 39 week period ended November 2, 2019, as described below. They do not include
all of the information required for a complete set of International Financial Reporting
Standards (“IFRS”) financial statements. However, select explanatory notes are included to
explain events and transactions that are significant to an understanding of the changes in
the Company’s financial position and performance since the annual financial statements.
Notes to Interim Condensed Consolidated Financial Statements
(In thousands of Canadian dollars, except per share amounts)
(Unaudited)
6
1. Nature of operations and basis of presentation
Nature of operations
Established in 1973, Roots is a premium outdoor lifestyle brand. We unite the best of cabin and city
through unmistakable style built with uncompromising comfort and quality. We offer a broad range of
products that embody a comfortable cabin-meets-city style including: women’s and men’s apparel,
leather goods, footwear, accessories, and kids, toddler and baby apparel. Starting from a little cabin in
Algonquin Park, Canada, Roots has grown to become a global brand. As at November 2, 2019, we had
115 corporate retail stores in Canada, seven corporate retail stores in the United States, 114 partner-
operated stores in Taiwan, 35 partner-operated stores in China, one partner-operated store in Hong
Kong, and a global eCommerce platform. Roots Corporation is a Canadian corporation doing business
as “Roots” and “Roots Canada”.
Roots Corporation was incorporated under the Canada Business Corporations Act on October 14,
2015. Its head office and registered office is located at 1400 Castlefield Avenue, Toronto, Ontario M6B
4C4. Roots Corporation and its subsidiaries are collectively referred to in these interim condensed
consolidated financial statements (the “interim financial statements”) as the “Company” or “Roots
Corporation”.
The Company’s common shares (“Shares”) are listed on the Toronto Stock Exchange (“TSX”) under
the trading symbol “ROOT”.
The Company experiences seasonal fluctuations in the financial results of its retail business, as a
meaningful portion of its sales and earnings occur in the third and fourth fiscal quarters. The Company’s
working capital requirements generally increase in the periods preceding these peak periods, and it is
not uncommon for net income (loss) before interest expense, income taxes expense (recovery) and
depreciation and amortization (“EBITDA”) to be negative in the first two fiscal quarters.
Basis of presentation
(a) Statement of compliance:
These interim financial statements have been prepared in accordance with International
Accounting Standard (“IAS”) 34, Interim Financial Reporting, as issued by the International
Accounting Standards Board (“IASB”) and the accounting policies described in the
Company’s audited consolidated financial statements as at and for the 52 week period ended
February 2, 2019 (“annual financial statements”), except for the new standards adopted
during the 39 week period ended November 2, 2019, as described below. They do not include
all of the information required for a complete set of International Financial Reporting
Standards (“IFRS”) financial statements. However, select explanatory notes are included to
explain events and transactions that are significant to an understanding of the changes in
the Company’s financial position and performance since the annual financial statements.
Paraphrase This Document
Need a fresh take? Get an instant paraphrase of this document with our AI Paraphraser
ROOTS CORPORATION
Notes to Interim Condensed Consolidated Financial Statements (continued)
(In thousands of Canadian dollars, except per share amounts)
(Unaudited)
7
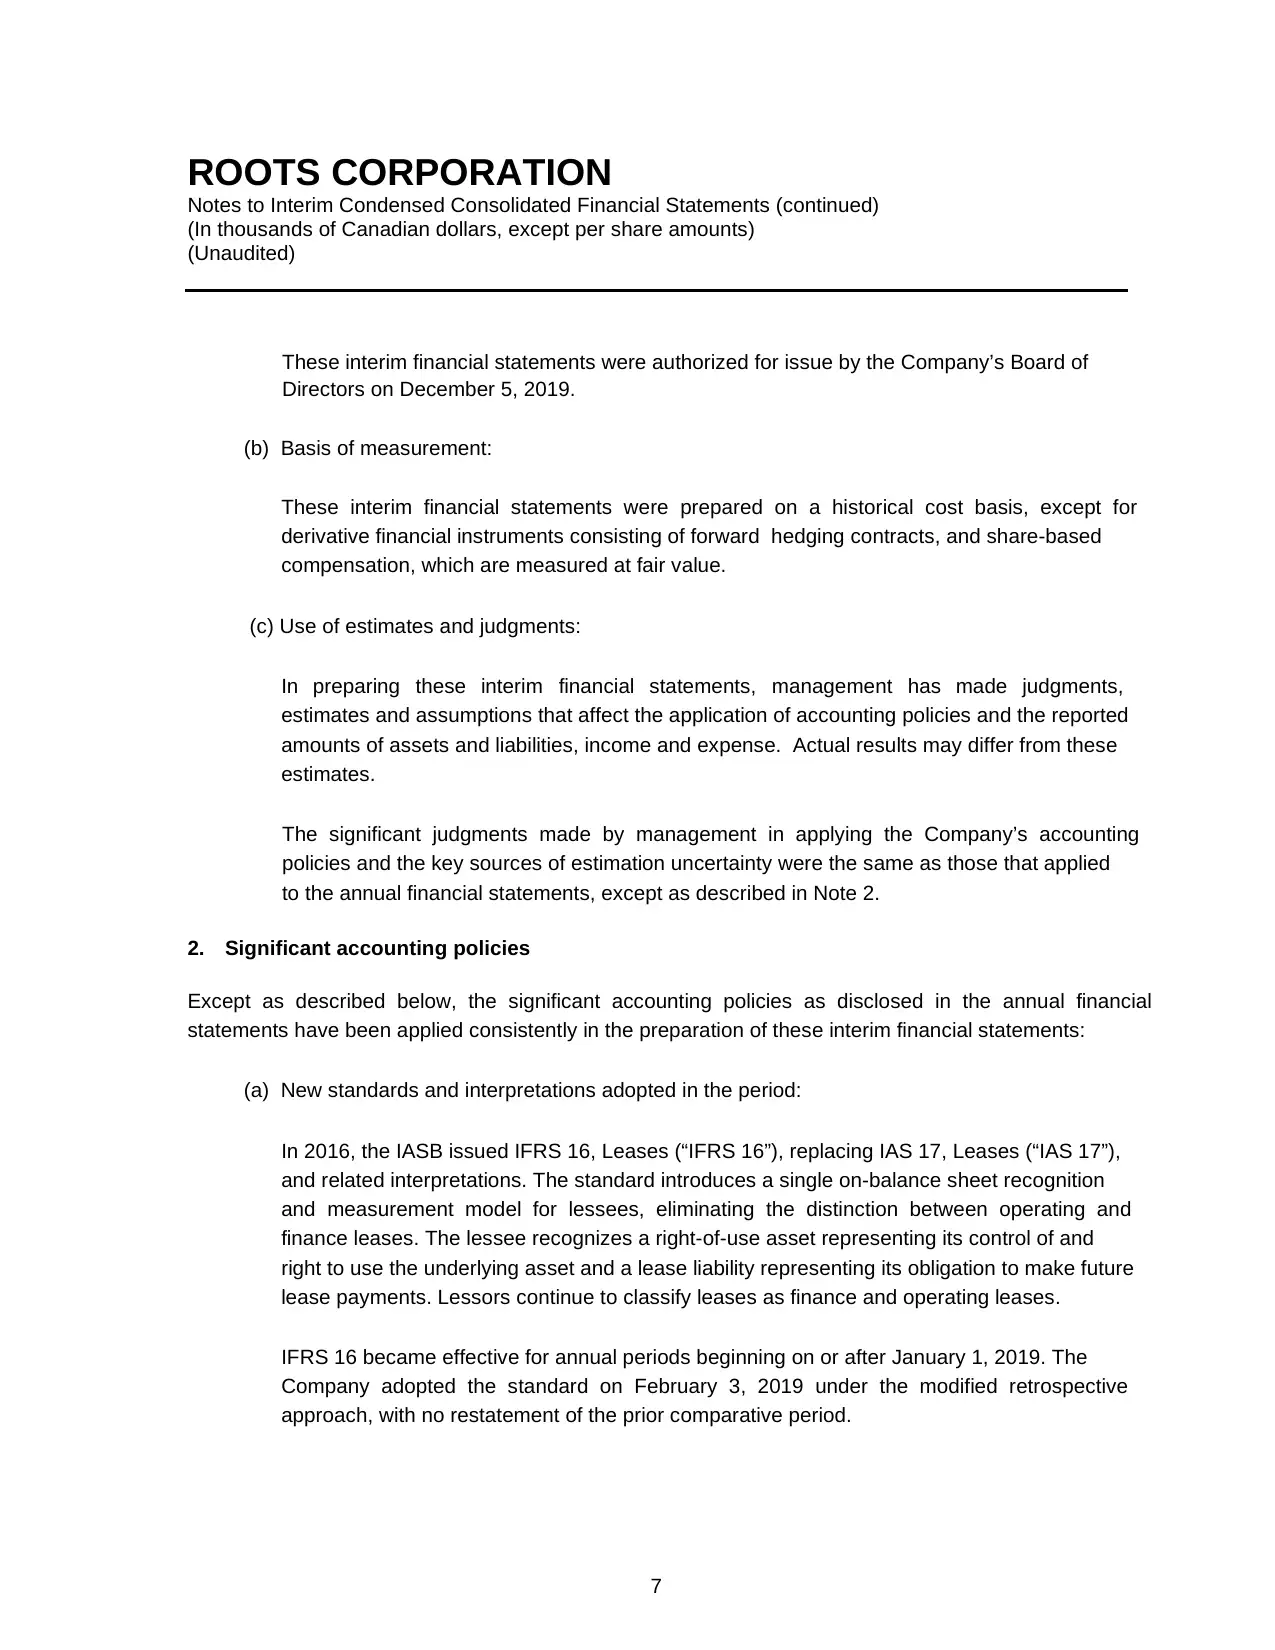
These interim financial statements were authorized for issue by the Company’s Board of
Directors on December 5, 2019.
(b) Basis of measurement:
These interim financial statements were prepared on a historical cost basis, except for
derivative financial instruments consisting of forward hedging contracts, and share-based
compensation, which are measured at fair value.
(c) Use of estimates and judgments:
In preparing these interim financial statements, management has made judgments,
estimates and assumptions that affect the application of accounting policies and the reported
amounts of assets and liabilities, income and expense. Actual results may differ from these
estimates.
The significant judgments made by management in applying the Company’s accounting
policies and the key sources of estimation uncertainty were the same as those that applied
to the annual financial statements, except as described in Note 2.
2. Significant accounting policies
Except as described below, the significant accounting policies as disclosed in the annual financial
statements have been applied consistently in the preparation of these interim financial statements:
(a) New standards and interpretations adopted in the period:
In 2016, the IASB issued IFRS 16, Leases (“IFRS 16”), replacing IAS 17, Leases (“IAS 17”),
and related interpretations. The standard introduces a single on-balance sheet recognition
and measurement model for lessees, eliminating the distinction between operating and
finance leases. The lessee recognizes a right-of-use asset representing its control of and
right to use the underlying asset and a lease liability representing its obligation to make future
lease payments. Lessors continue to classify leases as finance and operating leases.
IFRS 16 became effective for annual periods beginning on or after January 1, 2019. The
Company adopted the standard on February 3, 2019 under the modified retrospective
approach, with no restatement of the prior comparative period.
Notes to Interim Condensed Consolidated Financial Statements (continued)
(In thousands of Canadian dollars, except per share amounts)
(Unaudited)
7
These interim financial statements were authorized for issue by the Company’s Board of
Directors on December 5, 2019.
(b) Basis of measurement:
These interim financial statements were prepared on a historical cost basis, except for
derivative financial instruments consisting of forward hedging contracts, and share-based
compensation, which are measured at fair value.
(c) Use of estimates and judgments:
In preparing these interim financial statements, management has made judgments,
estimates and assumptions that affect the application of accounting policies and the reported
amounts of assets and liabilities, income and expense. Actual results may differ from these
estimates.
The significant judgments made by management in applying the Company’s accounting
policies and the key sources of estimation uncertainty were the same as those that applied
to the annual financial statements, except as described in Note 2.
2. Significant accounting policies
Except as described below, the significant accounting policies as disclosed in the annual financial
statements have been applied consistently in the preparation of these interim financial statements:
(a) New standards and interpretations adopted in the period:
In 2016, the IASB issued IFRS 16, Leases (“IFRS 16”), replacing IAS 17, Leases (“IAS 17”),
and related interpretations. The standard introduces a single on-balance sheet recognition
and measurement model for lessees, eliminating the distinction between operating and
finance leases. The lessee recognizes a right-of-use asset representing its control of and
right to use the underlying asset and a lease liability representing its obligation to make future
lease payments. Lessors continue to classify leases as finance and operating leases.
IFRS 16 became effective for annual periods beginning on or after January 1, 2019. The
Company adopted the standard on February 3, 2019 under the modified retrospective
approach, with no restatement of the prior comparative period.
ROOTS CORPORATION
Notes to Interim Condensed Consolidated Financial Statements (continued)
(In thousands of Canadian dollars, except per share amounts)
(Unaudited)
8
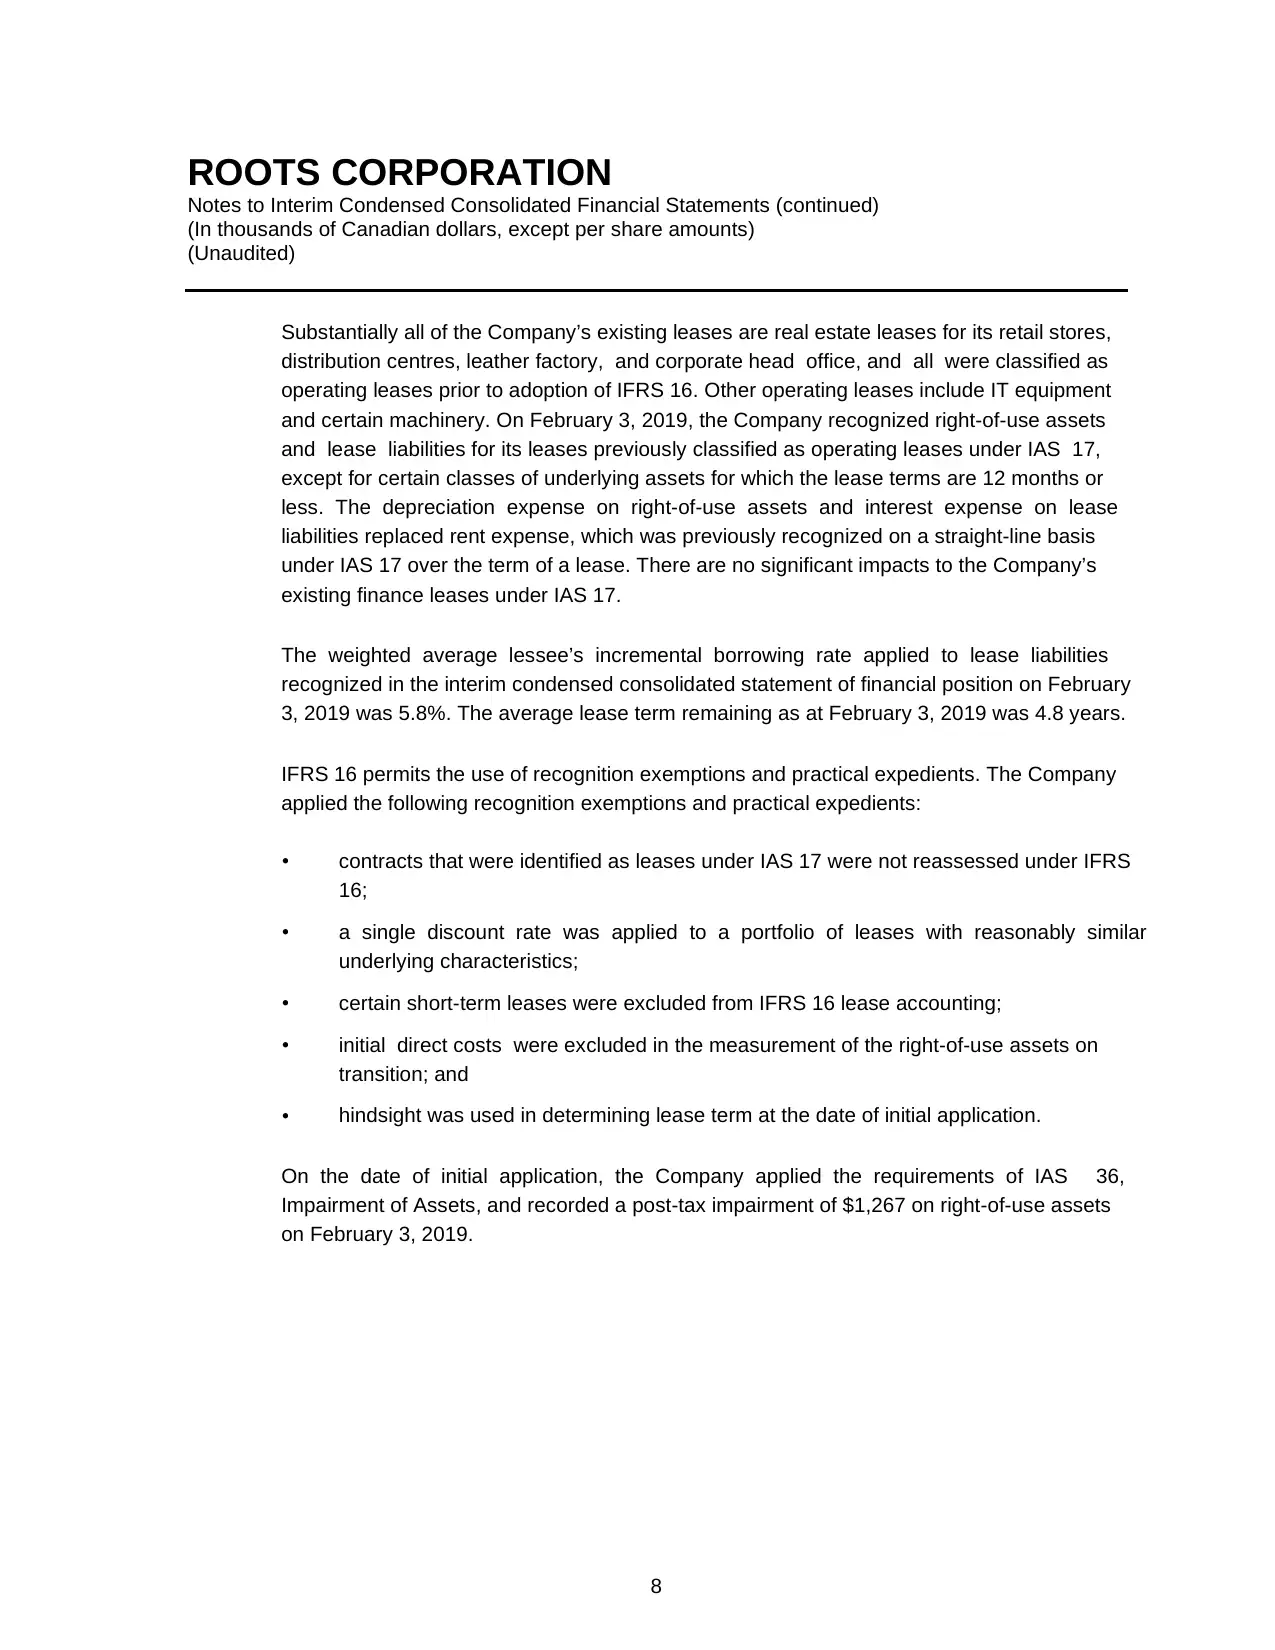
Substantially all of the Company’s existing leases are real estate leases for its retail stores,
distribution centres, leather factory, and corporate head office, and all were classified as
operating leases prior to adoption of IFRS 16. Other operating leases include IT equipment
and certain machinery. On February 3, 2019, the Company recognized right-of-use assets
and lease liabilities for its leases previously classified as operating leases under IAS 17,
except for certain classes of underlying assets for which the lease terms are 12 months or
less. The depreciation expense on right-of-use assets and interest expense on lease
liabilities replaced rent expense, which was previously recognized on a straight-line basis
under IAS 17 over the term of a lease. There are no significant impacts to the Company’s
existing finance leases under IAS 17.
The weighted average lessee’s incremental borrowing rate applied to lease liabilities
recognized in the interim condensed consolidated statement of financial position on February
3, 2019 was 5.8%. The average lease term remaining as at February 3, 2019 was 4.8 years.
IFRS 16 permits the use of recognition exemptions and practical expedients. The Company
applied the following recognition exemptions and practical expedients:
• contracts that were identified as leases under IAS 17 were not reassessed under IFRS
16;
• a single discount rate was applied to a portfolio of leases with reasonably similar
underlying characteristics;
• certain short-term leases were excluded from IFRS 16 lease accounting;
• initial direct costs were excluded in the measurement of the right-of-use assets on
transition; and
• hindsight was used in determining lease term at the date of initial application.
On the date of initial application, the Company applied the requirements of IAS 36,
Impairment of Assets, and recorded a post-tax impairment of $1,267 on right-of-use assets
on February 3, 2019.
Notes to Interim Condensed Consolidated Financial Statements (continued)
(In thousands of Canadian dollars, except per share amounts)
(Unaudited)
8
Substantially all of the Company’s existing leases are real estate leases for its retail stores,
distribution centres, leather factory, and corporate head office, and all were classified as
operating leases prior to adoption of IFRS 16. Other operating leases include IT equipment
and certain machinery. On February 3, 2019, the Company recognized right-of-use assets
and lease liabilities for its leases previously classified as operating leases under IAS 17,
except for certain classes of underlying assets for which the lease terms are 12 months or
less. The depreciation expense on right-of-use assets and interest expense on lease
liabilities replaced rent expense, which was previously recognized on a straight-line basis
under IAS 17 over the term of a lease. There are no significant impacts to the Company’s
existing finance leases under IAS 17.
The weighted average lessee’s incremental borrowing rate applied to lease liabilities
recognized in the interim condensed consolidated statement of financial position on February
3, 2019 was 5.8%. The average lease term remaining as at February 3, 2019 was 4.8 years.
IFRS 16 permits the use of recognition exemptions and practical expedients. The Company
applied the following recognition exemptions and practical expedients:
• contracts that were identified as leases under IAS 17 were not reassessed under IFRS
16;
• a single discount rate was applied to a portfolio of leases with reasonably similar
underlying characteristics;
• certain short-term leases were excluded from IFRS 16 lease accounting;
• initial direct costs were excluded in the measurement of the right-of-use assets on
transition; and
• hindsight was used in determining lease term at the date of initial application.
On the date of initial application, the Company applied the requirements of IAS 36,
Impairment of Assets, and recorded a post-tax impairment of $1,267 on right-of-use assets
on February 3, 2019.
⊘ This is a preview!⊘
Do you want full access?
Subscribe today to unlock all pages.
Trusted by 1+ million students worldwide
ROOTS CORPORATION
Notes to Interim Condensed Consolidated Financial Statements (continued)
(In thousands of Canadian dollars, except per share amounts)
(Unaudited)
9
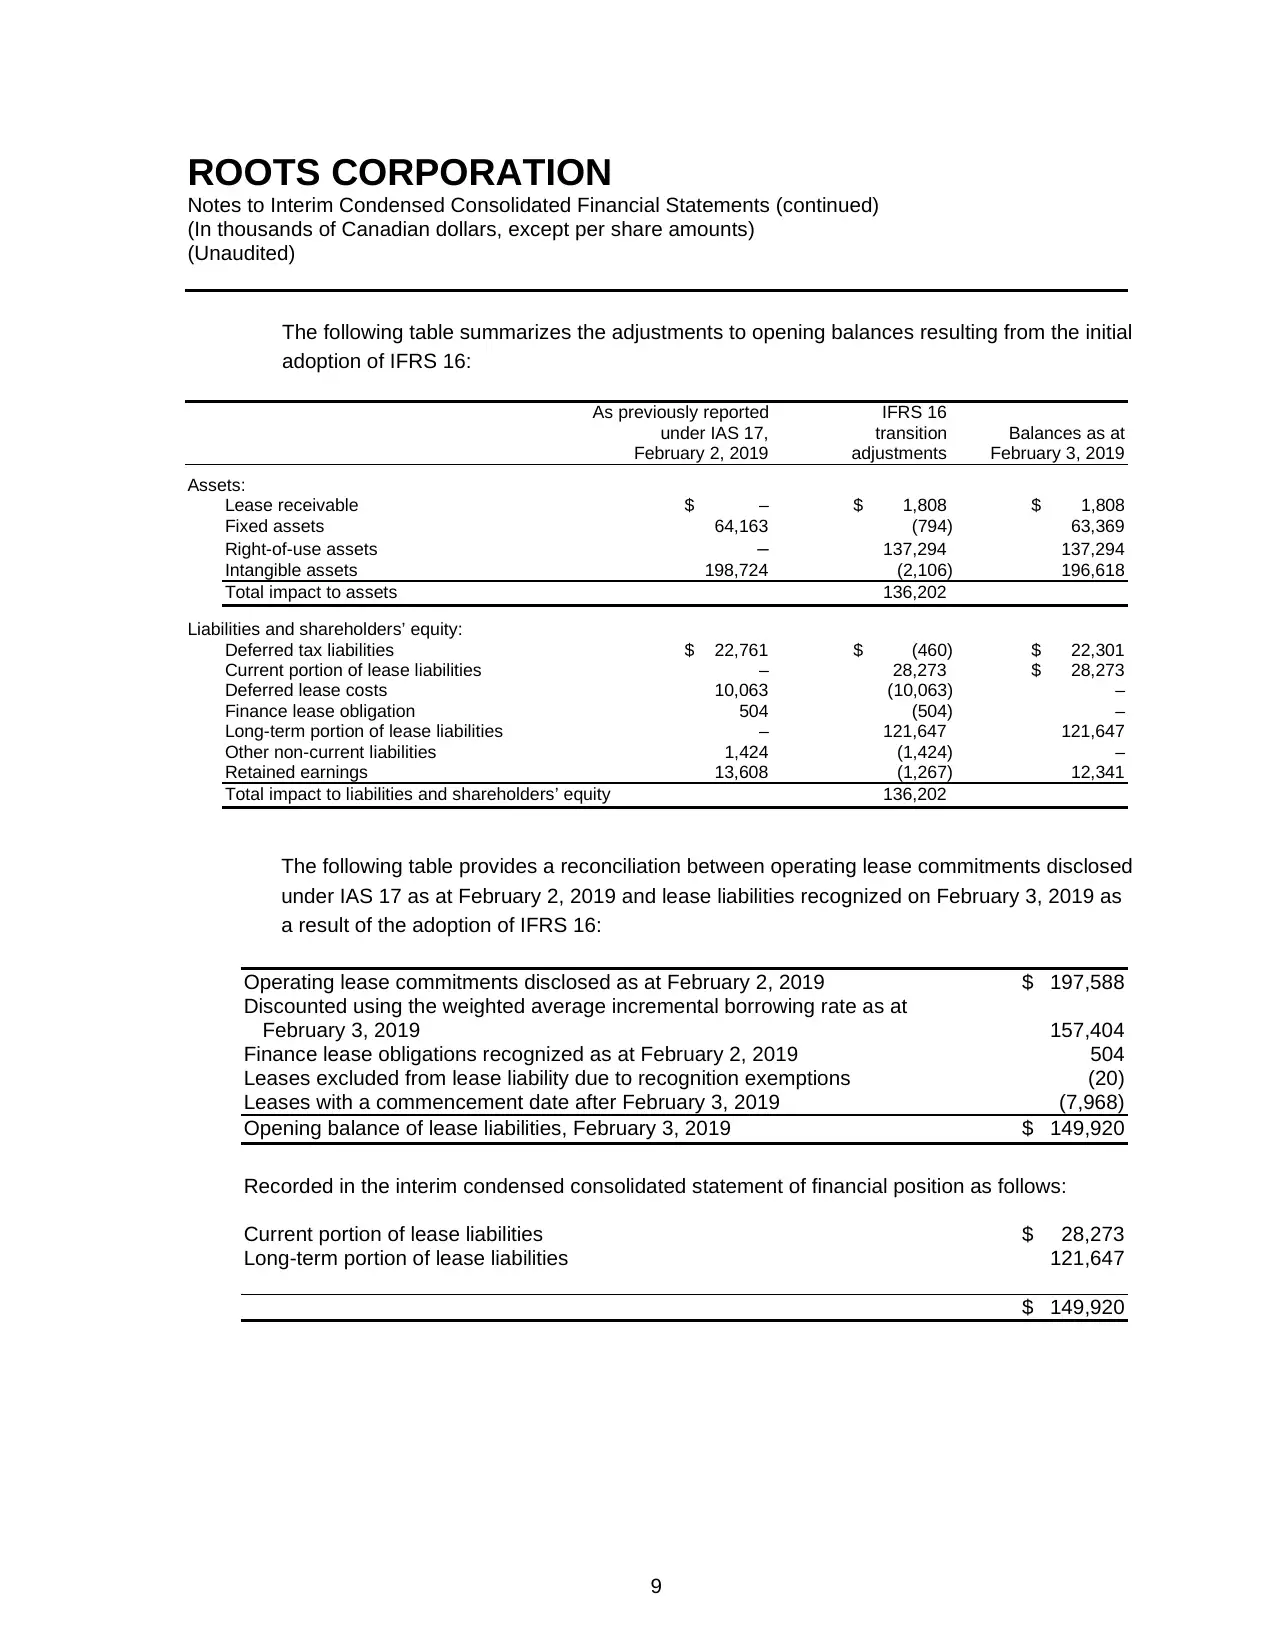
The following table summarizes the adjustments to opening balances resulting from the initial
adoption of IFRS 16:
As previously reported IFRS 16
under IAS 17, transition Balances as at
February 2, 2019 adjustments February 3, 2019
Assets:
Lease receivable $ – $ 1,808 $ 1,808
Fixed assets 64,163 (794) 63,369
Right-of-use assets – 137,294 137,294
Intangible assets 198,724 (2,106) 196,618
Total impact to assets 136,202
Liabilities and shareholders’ equity:
Deferred tax liabilities $ 22,761 $ (460) $ 22,301
Current portion of lease liabilities – 28,273 $ 28,273
Deferred lease costs 10,063 (10,063) –
Finance lease obligation 504 (504) –
Long-term portion of lease liabilities – 121,647 121,647
Other non-current liabilities 1,424 (1,424) –
Retained earnings 13,608 (1,267) 12,341
Total impact to liabilities and shareholders’ equity 136,202
The following table provides a reconciliation between operating lease commitments disclosed
under IAS 17 as at February 2, 2019 and lease liabilities recognized on February 3, 2019 as
a result of the adoption of IFRS 16:
Operating lease commitments disclosed as at February 2, 2019 $ 197,588
Discounted using the weighted average incremental borrowing rate as at
February 3, 2019 157,404
Finance lease obligations recognized as at February 2, 2019 504
Leases excluded from lease liability due to recognition exemptions (20)
Leases with a commencement date after February 3, 2019 (7,968)
Opening balance of lease liabilities, February 3, 2019 $ 149,920
Recorded in the interim condensed consolidated statement of financial position as follows:
Current portion of lease liabilities $ 28,273
Long-term portion of lease liabilities 121,647
$ 149,920
Notes to Interim Condensed Consolidated Financial Statements (continued)
(In thousands of Canadian dollars, except per share amounts)
(Unaudited)
9
The following table summarizes the adjustments to opening balances resulting from the initial
adoption of IFRS 16:
As previously reported IFRS 16
under IAS 17, transition Balances as at
February 2, 2019 adjustments February 3, 2019
Assets:
Lease receivable $ – $ 1,808 $ 1,808
Fixed assets 64,163 (794) 63,369
Right-of-use assets – 137,294 137,294
Intangible assets 198,724 (2,106) 196,618
Total impact to assets 136,202
Liabilities and shareholders’ equity:
Deferred tax liabilities $ 22,761 $ (460) $ 22,301
Current portion of lease liabilities – 28,273 $ 28,273
Deferred lease costs 10,063 (10,063) –
Finance lease obligation 504 (504) –
Long-term portion of lease liabilities – 121,647 121,647
Other non-current liabilities 1,424 (1,424) –
Retained earnings 13,608 (1,267) 12,341
Total impact to liabilities and shareholders’ equity 136,202
The following table provides a reconciliation between operating lease commitments disclosed
under IAS 17 as at February 2, 2019 and lease liabilities recognized on February 3, 2019 as
a result of the adoption of IFRS 16:
Operating lease commitments disclosed as at February 2, 2019 $ 197,588
Discounted using the weighted average incremental borrowing rate as at
February 3, 2019 157,404
Finance lease obligations recognized as at February 2, 2019 504
Leases excluded from lease liability due to recognition exemptions (20)
Leases with a commencement date after February 3, 2019 (7,968)
Opening balance of lease liabilities, February 3, 2019 $ 149,920
Recorded in the interim condensed consolidated statement of financial position as follows:
Current portion of lease liabilities $ 28,273
Long-term portion of lease liabilities 121,647
$ 149,920
Paraphrase This Document
Need a fresh take? Get an instant paraphrase of this document with our AI Paraphraser
ROOTS CORPORATION
Notes to Interim Condensed Consolidated Financial Statements (continued)
(In thousands of Canadian dollars, except per share amounts)
(Unaudited)
10
As a result of adopting IFRS 16, the Company updated its lease accounting policies as
follows:
Leased assets
The Company recognizes a right-of-use asset and a lease liability as the present value of
future lease payments when the lessor makes the leased asset available for use by the
Company.
Lease liabilities include the net present value of fixed payments, variable lease payments
that are based on an index or a rate, amounts expected to be payable by the Company under
residual value guarantees, and the exercise price of a purchase option or penalties for
terminating the lease, if the Company is reasonably certain to exercise those purchase or
termination options. Lease liabilities are recognized net of lease incentives receivable. The
lease payments are discounted using the interest rate implicit in the lease, or, if that rate
cannot be readily determined, the lessee’s incremental borrowing rate. Subsequent to initial
measurement, the Company measures lease liabilities at amortized cost using the effective
interest rate method.
Lease terms applied are the contractual non-cancellable periods of the lease, plus periods
covered by renewal options or termination options, if the Company is reasonably certain to
exercise those options. Lease liabilities are remeasured when there is a change in lease
term, a change in the assessment of an option to purchase the leased asset, a change in
expected residual value guarantee, or a change in future lease payments resulting from a
change in an index or a rate used to determine those payments.
Right-of-use assets are measured at cost less accumulated depreciation and accumulated
impairment losses. Cost includes the amount of the initial measurement of the related lease
liability, plus any lease payments made at or before the commencement date and any initial
direct costs and future restoration costs, less any lease incentives received. Right-of-use
assets are depreciated on a straight-line basis from the date that the underlying asset is
available for use. Depreciation is recorded over the shorter of the lease term and the useful
life of the underlying asset, unless the lease transfers ownership of the underlying asset to
the lessee by the end of the lease term, in which case depreciation is recorded over the
useful life of the underlying asset.
Lease payments for assets that are exempt through the short-term exemption and variable
payments not based on an index or rate continue to be recognized in selling, general and
administrative expenses.
ROOTS CORPORATION
Notes to Interim Condensed Consolidated Financial Statements (continued)
(In thousands of Canadian dollars, except per share amounts)
(Unaudited)
11
Subleases
When the Company enters into sublease arrangements as an intermediate lessor, it
assesses whether the sublease is classified as a finance sublease or an operating sublease
by reference to the corresponding right-of-use asset arising from the head lease, rather than
by reference to the underlying asset. A sublease is a finance sublease if substantially all the
risks and rewards incidental to ownership of the related right-of-use asset on the head lease
have been transferred to the sub-lessee.
Use of estimates and judgments in lease accounting
The Company has applied judgment to determine the lease term for some lease contracts
that include renewal or termination options. The assessment of whether the Company is
reasonably certain to exercise such options impacts the lease term, which significantly affects
the amount of lease liabilities and right-of-use assets recognized.
The Company is required to estimate the incremental borrowing rates used to discount lease
liabilities if the interest rate implicit in the lease is not readily determined. In determining the
incremental borrowing rates, management considers the Company’s creditworthiness, the
security, the term, the value of the underlying leased asset, and the economic operational
environment of the leased asset. The incremental borrowing rates are subject to change
mainly due to macroeconomic changes.
(b) New standards and interpretations not yet adopted:
The IASB has not issued any significant new accounting standards that impact the Company
since the standards described in the most recent annual financial statements for the year
ended February 2, 2019. The Company continues to monitor future IFRS changes proposed
by the IASB that may have an impact on the Company’s results.
⊘ This is a preview!⊘
Do you want full access?
Subscribe today to unlock all pages.
Trusted by 1+ million students worldwide
1 out of 27
Related Documents


Your All-in-One AI-Powered Toolkit for Academic Success.
+13062052269
info@desklib.com
Available 24*7 on WhatsApp / Email
![[object Object]](/_next/static/media/star-bottom.7253800d.svg)
Unlock your academic potential
Copyright © 2020–2026 A2Z Services. All Rights Reserved. Developed and managed by ZUCOL.