Valuation and Strategic Analysis of Rosetta Stone's IPO Initiative
VerifiedAdded on 2019/12/04
|24
|7458
|167
Project
AI Summary
This project provides a comprehensive financial and strategic analysis of Rosetta Stone's Initial Public Offering (IPO). It begins by describing the key features of Rosetta Stone's business model, including its cloud-based approach to language learning solutions and its strategic acquisitions. The project then evaluates the advantages and disadvantages of the company undertaking an IPO, considering factors such as capital raising and increased public scrutiny. Furthermore, it applies both the market-multiples approach and a free cash flow valuation model to determine a suitable share price for the IPO. The analysis includes an assessment of the reasonable rate of return on an investment in Rosetta Stone and concludes with recommendations on deciding an offer price for the IPO, providing a well-rounded evaluation of the company's financial prospects and strategic positioning. The project is a detailed examination of the key elements involved in the IPO process and the factors influencing the valuation of the company.
Financial entrepreneurial
initiatives
1
initiatives
1
Paraphrase This Document
Need a fresh take? Get an instant paraphrase of this document with our AI Paraphraser

Table of Contents
Rosetta Stone .......................................................................................................................................3
1. Describe the key features of Rosetta Stone's business model and its strategy............................3
2. Advantage and disadvantage of Rosseta stone undertaking an IPO............................................4
3. Market-Multiples approach to identify range of prices for an IPO.............................................6
4. Application of Market-Multiple approach to arrive at a suitable share price for IPO.................7
5. Reasonable rate of return on an investment in Rosetta Stone......................................................8
6. Apply a Free Cash Flow model to Rosetta Stone to arrive at valuation......................................9
7. Deciding an offer price for Rosetta Stone's IPO........................................................................11
REFERENCES...................................................................................................................................12
2
ROSETTA STONE
Initial public offering refers to business initiatives which is carried out to list its stock on a
public stock exchange for the first time. In other words, it can be said that first sale of stock made
by the company to the public is known as initial public offerings (Boulton and Campbell, 2016).
Present project report will apply both market-multiple approach and free cash flow valuation model
to decide suitable share prices for Rosseta Stone's IPO. It is a public company which operates in
software development industry. Company develops language, software and other language-learning
solution products for the customers.
1. Describe the key features of Rosetta stone’s business model and its strategy
Rosseta Stone's has cloud-based business model in which company focuses to develop
language learning solutions and software to provide deeper knowledge into the education
technology. It comprises both C.D Rom and online services to consumers, corporate clients, foreign
institutes etc. It use advanced and upgraded technologies to help learners to learn different kind of
languages. Key acquisition of Rosseta Stone are Vivity Labs Inc, Tell Me More, Livemocha and
Lexia Learning which helps to increase its revenue to a major extent (Crook, 2013). Acquisition of
Lexia enhance Rosetta Stone's potential by adding more on literacy products and expertise (Sohn,
2013). Over the time, its model relies upon its sales force to maintain strong relationship with the
corporate clients and enhance their satisfaction level. It expands its market with the key partners,
Books-A-Million and London Drugs, Sprial Toys etc (Rosseta Stone expands North American retail
presence with the key partners, n.d.). Recently, it creates a partnership with Speak for the future
period (Rosetta Stone becomes key partner of Speak to the future, 2014). It drive value by recruiting
skilled and highly experienced sales force and providing innovative language-learning solutions to
the corporate clients. Its customer segments includes individual, governmental agencies, armed
forces, educational institutions and corporate clients as well. Its revenue stream includes sales of
innovative and language learning software of latest version and licensed the products. Till 2009,
Rosseta Stone's business model is to provide interacting language learning software to the domestic
(US clients) as well as foreign customers and international institutions. The model focuses on
selling language-learning software which comprises both online and CD Rom to the consumers. Its
online subscriptions enable company to charge very high prices so as to increase their revenue,
market share and profitability to compete effectively.
Porter’s 5 forces:
Bargaining power of suppliers: Similar kinds of inputs are used by all the companies in
their operations while distribution channel is diverse. However, suppliers are competing with each
3
⊘ This is a preview!⊘
Do you want full access?
Subscribe today to unlock all pages.
Trusted by 1+ million students worldwide
other to deliver their goods and services; therefore, bargaining power of suppliers is high.
Bargaining power of customers: Customer prefer Rosetta Stone’s product because of best
quality and also they have limited choice available; henceforth, their bargaining power is
comparatively low.
Threat of rivalry: Rosetta Stone has very less number of competitors such as Memrise,
Fluenz, Livemocha etc. therefore, it can be said that company is not facing intense level of
competition in the market.
Threat of substitutes: Substitue that are providing by the other companies is of inferior
quality and also limited in number. Thus, it becomes clear that threat of substitute is low.
Threat of new competitors: Geographic factors limit the competition level in the industry,
henceforth; threat of new entrepreneurs is less.
Contrary to this, its strategy is to enhance its competitive strength by developing new and
innovative products and software which enable people to learn new languages. Moreover, it makes
continuous improvement through investment in research and development activities. Along with
this, Rosetta Stone focuses on the most prolific devices like Samsung, Chrome Book, iPhone, iPad
etc. to grab larger market share across the globe (Seave, 2014). Its strategy is highly concerned with
increasing business turnover and yield as well to compete effectively in the market place. Its
strategic focus is to maintain better control over material, cash availability, and relationship with the
clients, introduction of new software and learning solutions and making growth of Kiosks,
Enterprise and Education business (E&E), etc. Moreover, it focuses to distribute services more on
online and expand its product portfolio (Hall, 2015). Recently, it launched Kids reading, brain
fitness, innovative devices, apps etc. to increase its product offerings and increase its customer base.
Its market strategy is to focus on enhancing the level of consumer satisfaction by advertising on
Google, display ads and other search ads. Contrary to this, its competitive strategy is focuses on
enterprise resource centre and attracting high number of multinational institutions and foreign
clients (Four reason for a business language strategy, 2015). Moreover, its strategic focus is to
deliver value to the shareholders by the use of share buy-back program.
4
Paraphrase This Document
Need a fresh take? Get an instant paraphrase of this document with our AI Paraphraser
5
Illustration 1: Rosseta Stone's business strategy
Illustration 1: Rosseta Stone's business strategy
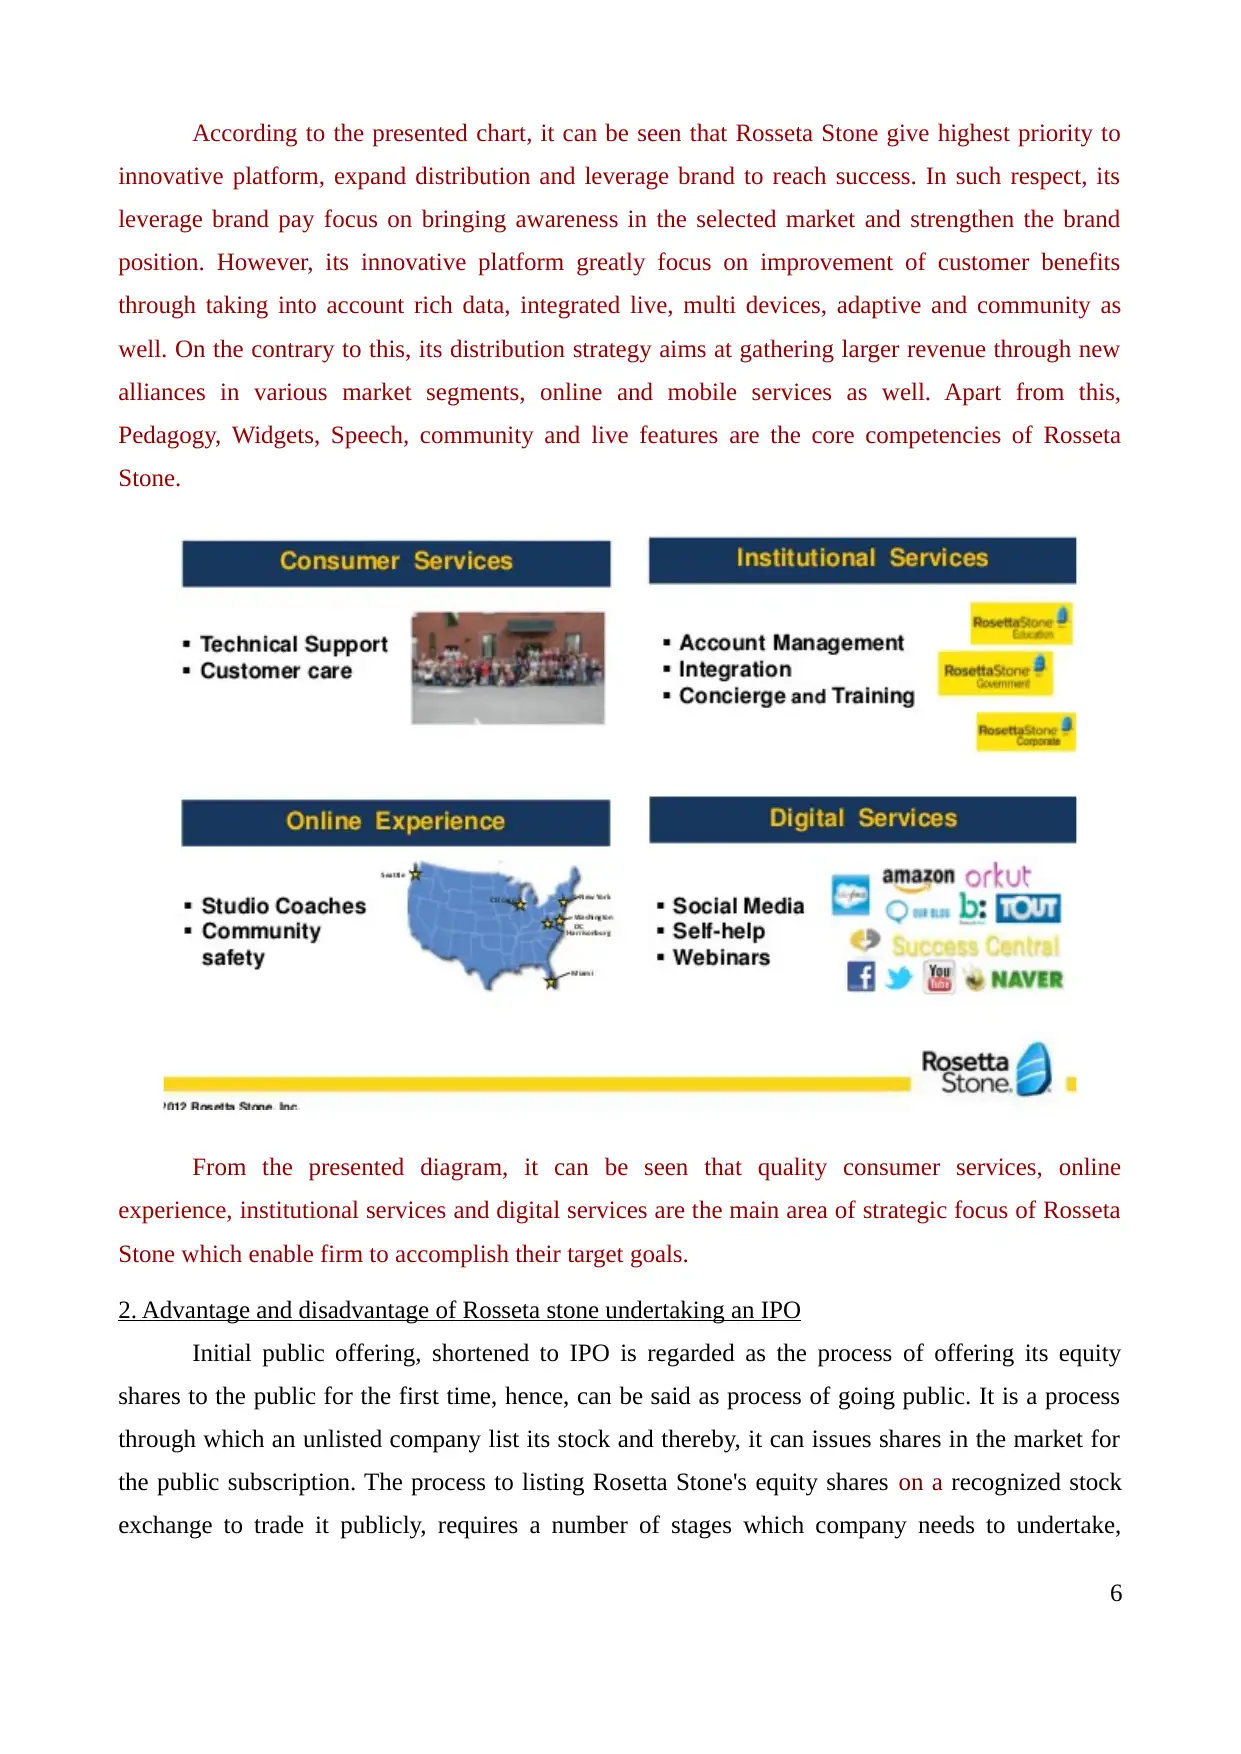
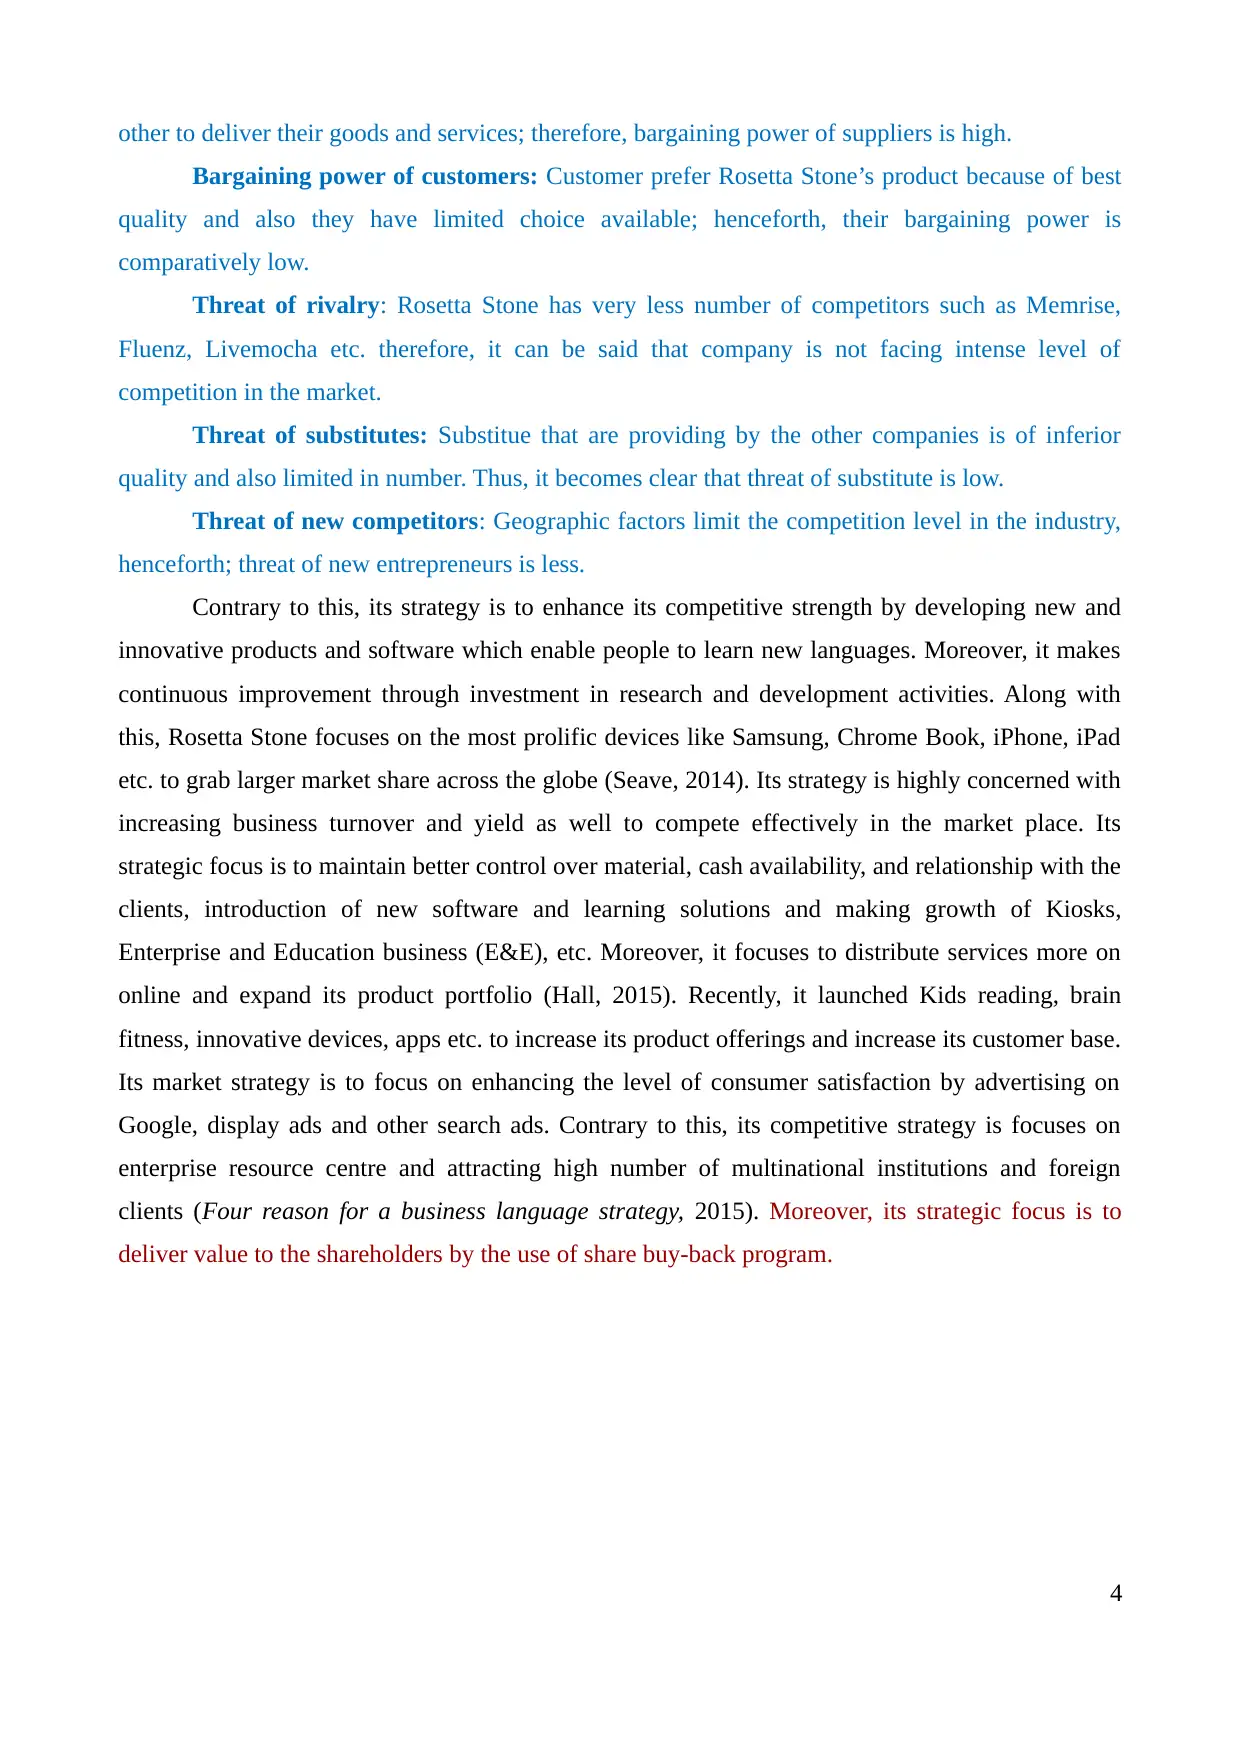
According to the presented chart, it can be seen that Rosseta Stone give highest priority to
innovative platform, expand distribution and leverage brand to reach success. In such respect, its
leverage brand pay focus on bringing awareness in the selected market and strengthen the brand
position. However, its innovative platform greatly focus on improvement of customer benefits
through taking into account rich data, integrated live, multi devices, adaptive and community as
well. On the contrary to this, its distribution strategy aims at gathering larger revenue through new
alliances in various market segments, online and mobile services as well. Apart from this,
Pedagogy, Widgets, Speech, community and live features are the core competencies of Rosseta
Stone.
From the presented diagram, it can be seen that quality consumer services, online
experience, institutional services and digital services are the main area of strategic focus of Rosseta
Stone which enable firm to accomplish their target goals.
2. Advantage and disadvantage of Rosseta stone undertaking an IPO
Initial public offering, shortened to IPO is regarded as the process of offering its equity
shares to the public for the first time, hence, can be said as process of going public. It is a process
through which an unlisted company list its stock and thereby, it can issues shares in the market for
the public subscription. The process to listing Rosetta Stone's equity shares on a recognized stock
exchange to trade it publicly, requires a number of stages which company needs to undertake,
6
⊘ This is a preview!⊘
Do you want full access?
Subscribe today to unlock all pages.
Trusted by 1+ million students worldwide
described below:1. Creating pitch: At the initial stage, Rosetta Stone has to fulfil prerequisites requirement
about generating a credible plan, recruiting a qualified management team, create board of
directors (BOD), construct financial statement and audit it, measure performance, financial
projection, develop relationship with the lenders, investment bankers, accountants and
lawyers as well (Boone, Floros and Johnson, 2016). Further, bake-off meeting are conducted
to recruit underwriter for the sale of its stock. In this regard, important discussion regarding
proposed commission, historical track records and distribution abilities of the underwriters
etc. are analysed by Rosetta stone.2. Kick-off meeting: After fulfilling the prerequisites, company has to organize a meeting in
which all the parties such as management, auditors, directors, accountants, investment bank,
legal counsel etc. will be invited to take decisions for underwriter and issuing firm. At this
stage, legal contracts or agreements are framed with specific terms and conditions. With
regards to prospectus, it is the legal obligation on Rosetta stone to not publish any
information which are outside the prospectus (Filatotchev, Chahine and Bruton, 2016).
Moreover, it cannot advertise the information to increase public awareness about its name,
products, services, market segments etc. to create a positive image toward its equity stock. If
it happen, that will be consider illegal activities and SEC prohibited such acts and mistakes,
also called quiet period.3. Filling registration statement and due diligence: At this stage, SEC required registration
statement, of which, Part – I is preparation of prospectus whilst Part- II includes
underwriter agreements, Rosetta Stone's charter, laws and a specimen of security as well.
Contrary to this, due diligence refers to restriction of disclosing untrue and material
misstatement in the prospectus. In this, tax return, contracts, necessary documents etc. are
provided to the SEC. Beside this, underwriter prepare syndicate which includes various
investment bankers which are agreed to buy shares at price less underwriter discount.4. SEC review: In this, SEC review all the filled documents whether it complied with the
Security Act, 1933 or not. Registration statement will be effective after 20 days of the
filling date. While, if any untrue information has been disclosed in the statement than SEC
will sent letter of comment to the company and gives 20 day warning period to file amended
statement (Esfahanipour, Goodarzi and Jahanbin, 2016).5. Road show: In this, Rosetta stone’s managers will meet potential investors to assess market
demand about the new issues and increase their interest. 1-2 week road shows are organized
by the underwriter to enable manager to discuss their investment plan across the country
7
Paraphrase This Document
Need a fresh take? Get an instant paraphrase of this document with our AI Paraphraser
(Blum, 2011).
6. Pricing meeting: In this stage, company management will negotiate the final offering price
and the underwriter discount on the basis of investor demand and external market conditions
(Boulton and Campbell, 2016).
7. Allocation: Once the price decided, syndicate member will sell share to the potential
investors and final copy of the prospectus and sales confirmation also will be provided to
them. In this, underwriter will cancel the deal if payment is not receive in 5 days after
delivering confirmation of sale.
8. Trading: After finalising the allocation, trading get started hence, public can buy and sell
the shares. According to the rule of SEC, 10b – 7, underwriter has no right to get involve in
price stabilising activities while distribution securities. Offering settlement will be closed
after 10 days of the effective date, which is mentioned in the underwriter agreement (Boone,
Floros and Johnson, 2016). Security certificate will be delivered to the underwriter and
updated comfort letter will be given to the individual accountants.
From the above analysis, it becomes clear that the IPO process very length which consume a
lot of time of the managers because they are required to conduct meetings, necessary
documentation, conduct road show, organize price meeting, appoint underwriter etc. Along with
this, underwriter commission, preparation of documents such as registration and filling of tax
return, contracts etc. impose cost to the business and results in lower yield. Therefore, it can attract
high managerial focus on the IPO process for listing of shares, which in turn, may reduce the focus
of managers on the effective administration of daily business operations and activities.
Advantage of IPO Disadvantage of IPO
It helps to raise money for the business
expansion, research and development,
capital expenditures and pay back long
term debts and loans of Rosetta stone
by attracting high number of investors.
It is an advantage because through
using this facility, Rosseta Stone can
meet their capital requirement and run
operations successfully in the
competitive market.
Rosetta Stone will need to disclose its
audited financial reports in the front of
shareholders to communicate its business
performance. It will be a disadvantage
because company will be liable to audit its
annual financial account timely thus,
confidentiality cannot be maintained.
Moreover, organization has to pay fees to
the auditor which increase cost and decline
net yield.
8

It also creates positive image of
Rosetta stone by trading its securities
publicly. The reason behind this is it
helps to attract more suppliers,
customers and bank also will be
willing to lend funds to the listed
companies rather than unlisted
(Mantell, 2016).
It facilitates Rosetta stone to carry out
mergers and acquisition by driving
larger market. Rosseta Stone can
acquire and merge with other
organizations, by this, it can increase
its revenue, profitability and market
share as well. This in turn, company
will be able to gain competitive
advantages and reach success.
Company will be obliged to comply with
the rules and regulations of SEC and
Security Act, 1933, which may incur high
cost (Boone, Floros and Johnson, 2016).
The cost of IPO in USA is approximately $1
million which includes listing, printing and
legal fees etc.
Investors also have controlling power
through which they can take part in the
decision-making hence, dilution of control
is also a disadvantage of going public.
Listing the shares enable entrepreneur
to maintain liquidity because it allows
venture capitalists to liquidate their
holdings.
It also imposes reporting requirement on
Rosetta stone through which, it has to report
its operations, financial position etc. to the
investors. In case, when Rosseta Stone does
not have profitability and running in loss,
then it will create negative impact on the
shareholders and they can sale their
investment. Moreover, it will be very
difficult for the company to take borrowings
from banks because financial institutions
only provide money to the profit gaining
enterprises for their fund security.
The success and growth of the business
is also based upon shareholder’s value
Company will have to pay return to the
shareholders in the terms of dividend which
9
⊘ This is a preview!⊘
Do you want full access?
Subscribe today to unlock all pages.
Trusted by 1+ million students worldwide
(Esfahanipour, Goodarzi and Jahanbin,
2016). Henceforth, by providing larger
the return to the investors out of its
earnings, enable firm to enhance
shareholders worth and build a strong
market image.
increase cost and decline net yield
(Filatotchev, Chahine and Bruton, 2016).
On the basis of above discussion, it can be said that Rosseta Stone has to list its shares
because although the cost of going public is approximately $1 million but still, it offers wide range
of advantages to the Rosseta stone as compare to the cost of gathering funds through external
borrowings. Hence, it becomes clear that manager has to go for IPO process to list its shares on a
recognized stock exchange.
3. Market-Multiples approach to identify range of prices for an IPO
Market multiple approach is a valuation model, according to which, stock prices can be
decided by taking into account the similar kind of assets at similar prices. The term “Market
Multiple” is a generic term which use number of components or indicators to value the stock of the
Rosetta stone. For instance, price to earnings (P/E) ratio is one of the multiples which can be used
by the businesses to decide offering prices for their IPO (Pinto, Robinson and Stowe, 2015). Out of
this, P/E ratio is often use factor which indicates the ratio between market price (MP) and earning
per share (EPS). According to this multiple, if Rosetta stone has less P/E ratio than, it will be
consider as undervalued firm than its competitors. In this method, valuation is based upon the
competitors which are operating in same industry (Cornell and Gokhale, 2016). With regards to
Rosetto Stone, Apollo Group Inc, American Public Education Inc, Corinthian Education Corp,
Capella Education, Strayer Education, DeVRY Inc, ITT Educational Service Inc. K12 Inc., Grand
Canyon Education, Inc. and New Oriental Ed. & Tech. Group Inc are its major competitors.
Another multiple of this approach is enterprise value which refers to the market
capitalization of Rosetta Stone by eliminating the impact of its financial assets and liabilities
(Moghaddam and Talebnia, 2016). As per this factor, enterprise value can be determined through
using following formula:
Enterprise value (EV) = Market capitalization + Debt fund + Minority interest – Cash and
equivalents – investment
Apart from that, this approach also use EV to EBITDA (Earnings before interest, tax,
10
Paraphrase This Document
Need a fresh take? Get an instant paraphrase of this document with our AI Paraphraser
depreciation and amortization) multiple to decide share price for going public. This method is
considered as more realistic method as compare to DCF valuation. The advantage of this method is
that it use investors ratios like earning per share, price-to-earnings ratio etc. to decide share price
(Reed and Rocholl, 2010). Contrary to this, the limitation of this method is that it does not provide
assistance to value share price in changing and competitive business era. Moreover, if competitors
valued their share price incorrectly than it may provide misleading results.
Questions with market-multiple approach:
One of the key problems that come first when applying market-multiple is to select the
correct comparables. It is because, there may be number of competitors operating in the market, in
such case, it is essential for the analyst to determine the most suitable and appropriate comparable.
In such respect, company has to select those peers which have similar return on capital employed
and growth rate as well. Moreover, as said earlier, that there are number of multiples henceforth,
business has to select the best multiple to determine the share price for Initial Public Offering (IPO).
In such regards, business has to select forward-looking multiples rather than historical results.
Movements in balance sheet:
Movement in balance sheet also affect the share pricing by market-multiple approach. For
instance, price earning multiple is greatly affected by the changes in capital structure and P/E is
usually higher in unlevered firm and lower in levered. Further, analyst also has to make necessary
adjustments regards to excess cash, non-operating assets, pension, employee stock option etc so as
to identify the correct price for IPO listing.
4. Application of Market-Multiple approach to arrive at a suitable share price for IPO
The market multiple approach emphasizes on ascertaining market value of the organization
on the basis of performance of company’s competitors. As per the cited scenario, Rosetta Stone is
desiring to list its share for IPO in 2009. Many of the analysts mostly prefer EV/EBITDA or
Enterprise value as their market-multiple of comparable firms who are operating in the industry to
value their share price. In such respect, EV/EBITDA states that how much amount of money, buyer
is required to pay in order to acquire the proxy cash flows (Caution, Platt and Platt, 2011). The main
benefit of this multiple over price-earning ratio is it does not affected by the capital structure of the
company as it is a measure of capital intensity. With regards to the current scenario, the sample of
companies are extracted from the industry to which Rossetto Stone belongs to. There are two
multiple will be use that are price earning ratio and EV/EBITDA to identify the stock price of IPO
for Rosseta Stone. Here. The formula of P/E multiple is as under:
11

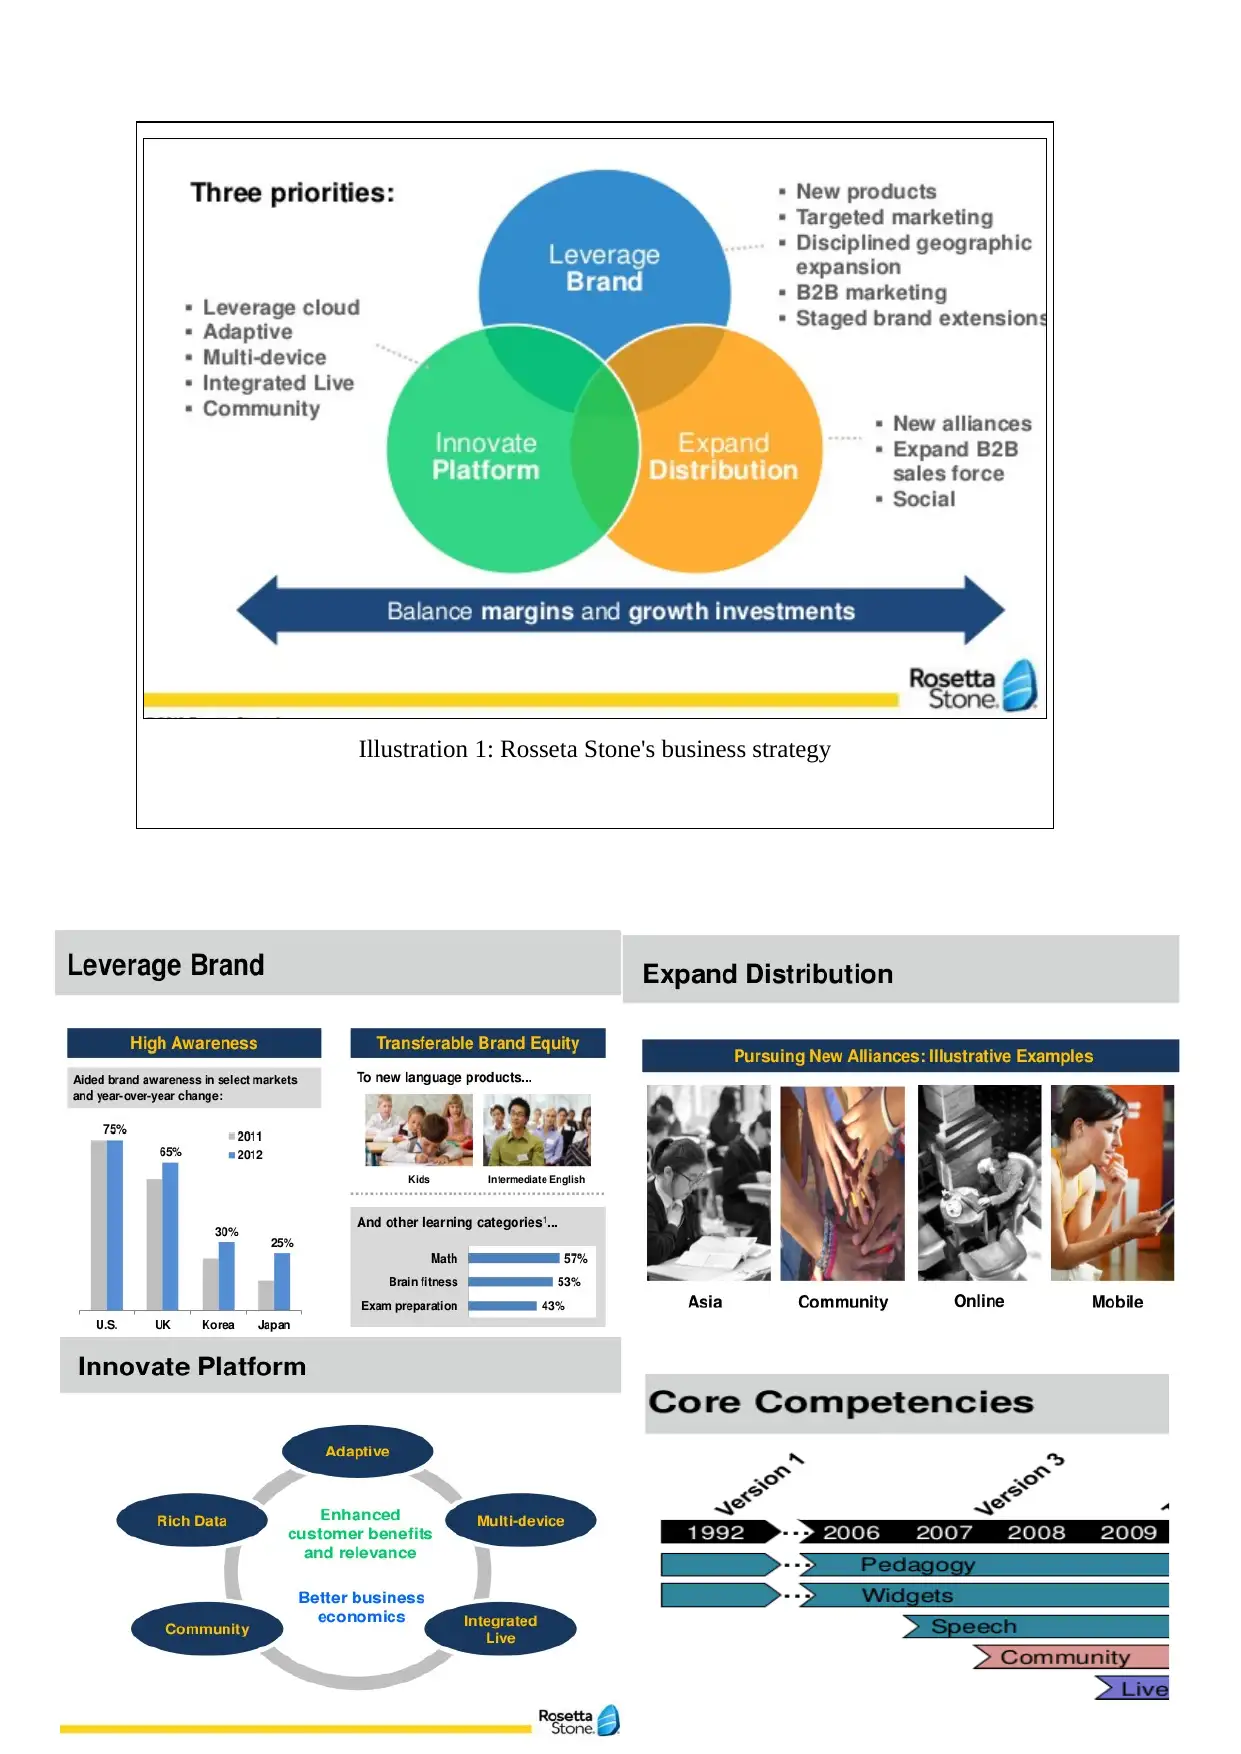
Price-earning multiple: Stock price per share / Earning per share(EPS)
Another multiple – Enterprise value / Earning before interest, tax, depreciation and amortization
Enterprise value – Market capitalization – long term debt+minority interest – cash and cash
equivalents – investment
Profit educations
Profit educations
12
Appolo Group Inc.
American Public Education Inc.
Corinthian Colleges, Inc.
Carrer Education Corp.
Capella Education
Strayer Education
DeVry Inc.
ITT Educational Services Inc.
K12 Inc.
Grand Canyon Education Inc.
New Oriental Ed.&Tech. Group, Inc.
0
5
10
15
20
25
30
35
40
45
19.2
42.4
28.7
19.5
31.5 33.2
23.2
19 18.3
32.9
14.5
29.3
18.1 20
23.4 25.8
17.5
13.6
35.4
24.3 24.5
PE ratio (2008) PE ratio (2009)
Appolo Group Inc.
American Public Education Inc.
Corinthian Colleges, Inc.
Carrer Education Corp.
Capella Education
Strayer Education
DeVry Inc.
ITT Educational Services Inc.
K12 Inc.
Grand Canyon Education Inc.
New Oriental Ed.&Tech. Group, Inc.
0
5
10
15
20
25
30
35
9.7
20.5
11.6
6.8
13.4
17.8
12.5
10.1
13.4
30.2
23.8
7.2
13.8
7.8 6.8
10.3
14.1
9.6
7.4 8.7
11.5
17.2
Ev /EBITDA (2008)
Ev /EBITDA (2009)
⊘ This is a preview!⊘
Do you want full access?
Subscribe today to unlock all pages.
Trusted by 1+ million students worldwide
1 out of 24
Related Documents


Your All-in-One AI-Powered Toolkit for Academic Success.
+13062052269
info@desklib.com
Available 24*7 on WhatsApp / Email
![[object Object]](/_next/static/media/star-bottom.7253800d.svg)
Unlock your academic potential
Copyright © 2020–2026 A2Z Services. All Rights Reserved. Developed and managed by ZUCOL.