Financial Markets and Investment: Royal Dutch Shell Valuation Analysis
VerifiedAdded on 2020/12/30
|9
|2513
|335
Report
AI Summary
This report presents a financial analysis of Royal Dutch Shell, evaluating its valuation using methods such as book value, equity value, dividend valuation, and free cash flow. It details the assumptions used in these calculations and analyzes the resulting financial performance, including revenue, profit, and key financial ratios. The analysis extends to market movements, comparing Royal Dutch Shell's performance with benchmarks like the S&P 500 and discussing the efficient market hypothesis. Furthermore, the report explores unconventional monetary policy tools and their impact on financial markets, referencing actions by central banks like the Federal Reserve and the European Central Bank. The report also includes a brief overview of British American Tobacco (BAT) and its financial highlights.
FINANCAL MARKETS AND
INVESTMENT ANALYSIS
INVESTMENT ANALYSIS
Paraphrase This Document
Need a fresh take? Get an instant paraphrase of this document with our AI Paraphraser
Table of Contents
INTRODUCTION...........................................................................................................................1
TASK a)...........................................................................................................................................1
Company's valuation method......................................................................................................2
TASK b)...........................................................................................................................................3
Assumption used to compute the value of organisation..............................................................3
TASK c)...........................................................................................................................................3
Analysis of result.........................................................................................................................3
TASK d)...........................................................................................................................................4
1) Large movements....................................................................................................................4
2) Reconcile these share price movements with the efficient market hypothesis.......................4
TASK e)...........................................................................................................................................5
Unconventional monetary policy tools.......................................................................................5
CONCLUSSION..............................................................................................................................6
REFERENCES................................................................................................................................7
INTRODUCTION
Investment and management strategies are essential aspect in terms of managing the
financial resources and management decisions in effective manner. Financial market and analysis
is mainly associated with analysing the best investment plans and the strategies related to
positive returns. This context is prepared to analyse the key financial information and dividend
valuation model and cash flow. Analysis of assumptions are defined and clear application of
assumptions are used in terms of Royal Dutch Shell (Doğan and Arslan, 2016). Application of
finance theory subject to real events are analysed and ability to critically evaluation price
movements are also defined in this context. Central bank policies are also linked with the
financial analysis and investment decisions of organisation.
TASK a)
Introduction of organisation
Royal Dutch Shell Plc is one of the emerging oil and gas organisation which deals in
British multinational oil and gas products, it has headquarters in the Netherlands and
incorporated in the United Kingdom. Company comes at the sixth position in oil and gas
company and sixth largest company in the world measured by 2016 revenues. It is Europe's
largest oil and gas company which is working across the globe and spreading the scope in
various ventures.
AS per capital structure and financial analysis it is seen that it was first introduced in the
2013 Fortune Global 500 List of the World's largest companies. Revenues were recorded as 84%
of the Netherlands' $556 billion GDP. As per revenue records US $305.1 billion revenue was
recorded for the year 2017. operating income was recorded as US $15.48 billion 2017. total
assets are recorded as US $407.0 billion for the year 2017 and the total equity was recorded as
$194.3 billion for the year 2017.
There are type of valuation methods are formed to estimate the worth of organisation.
Stakeholders, investors and financial organisations are main parties who put their interest to
invest their capital to get better results. Valuation methods helps to determined the cots of
organisation. With the help of this stakeholders and investors be able to determine the affectivity.
There are major valuation methods are defined below in order to determine the value of
organisation (Antony and Joseph, 2017).
1
⊘ This is a preview!⊘
Do you want full access?
Subscribe today to unlock all pages.
Trusted by 1+ million students worldwide
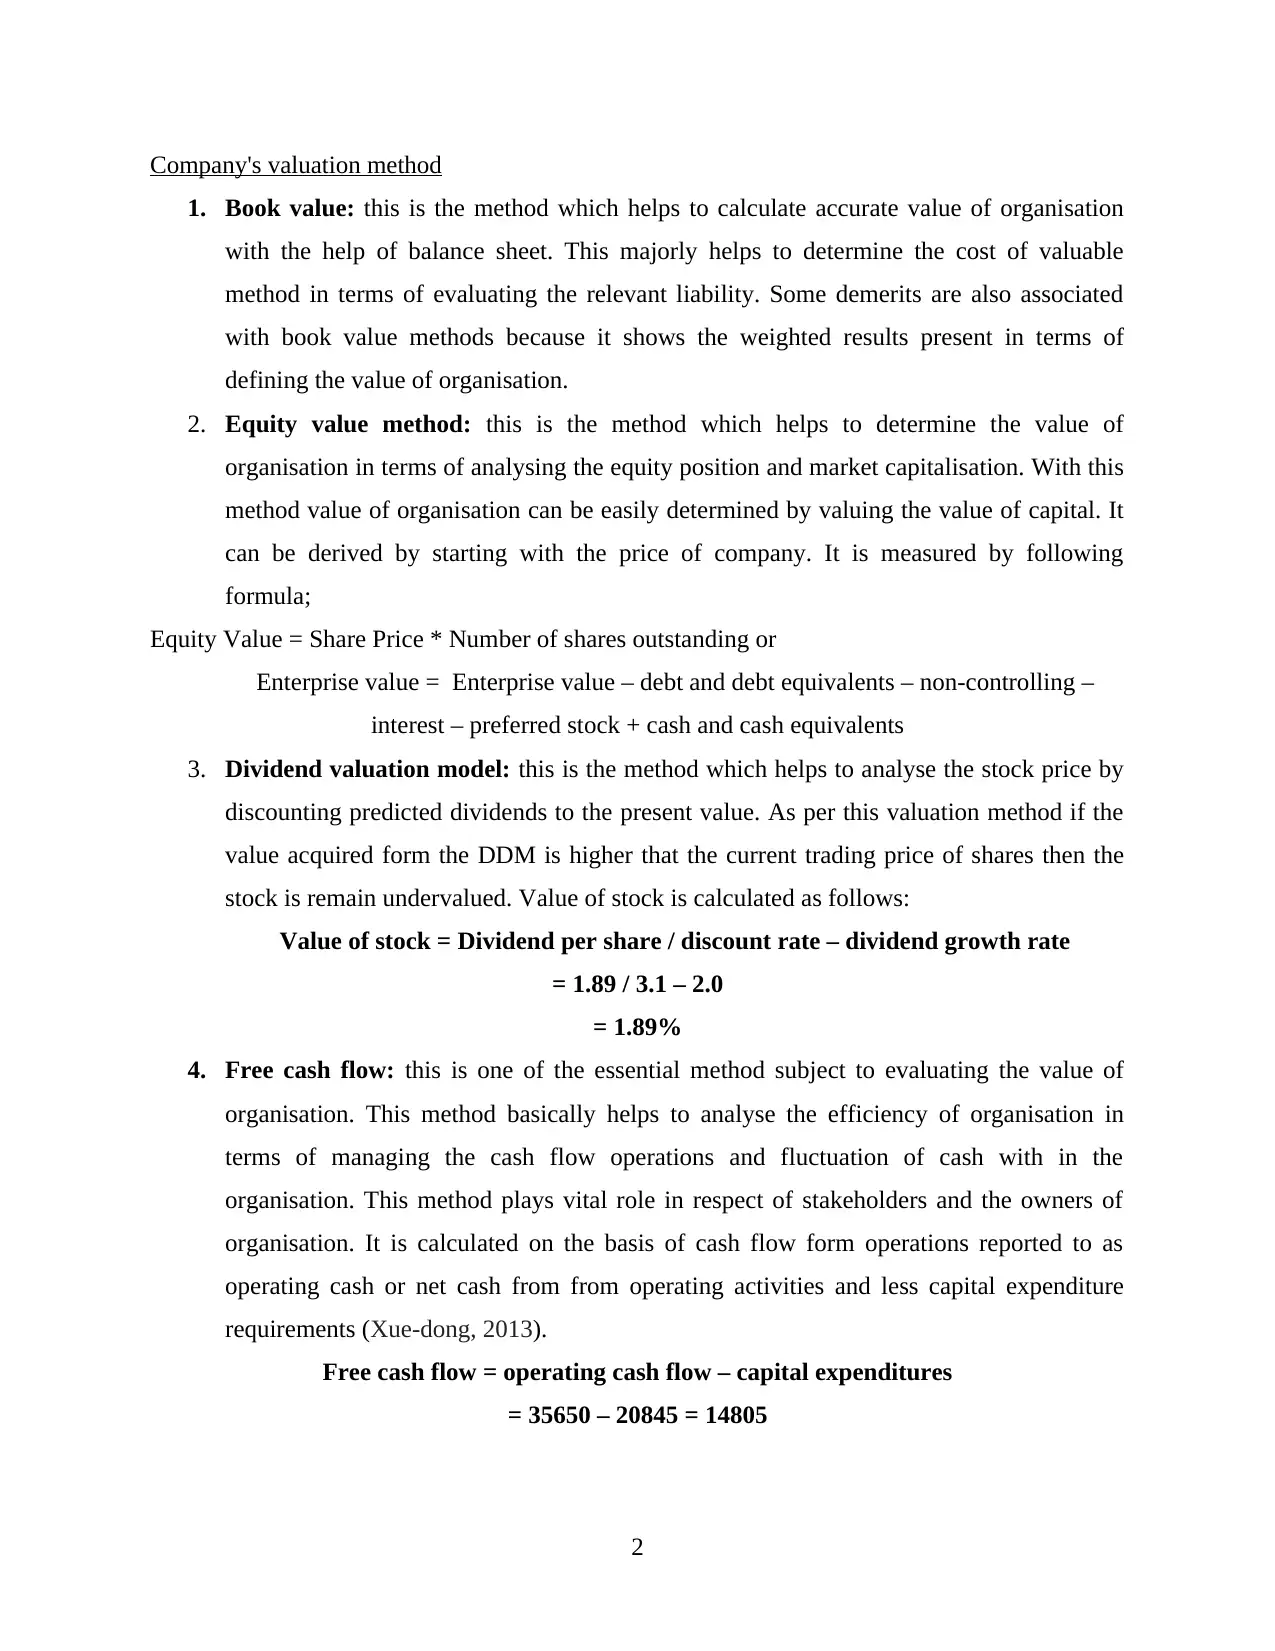
Company's valuation method
1. Book value: this is the method which helps to calculate accurate value of organisation
with the help of balance sheet. This majorly helps to determine the cost of valuable
method in terms of evaluating the relevant liability. Some demerits are also associated
with book value methods because it shows the weighted results present in terms of
defining the value of organisation.
2. Equity value method: this is the method which helps to determine the value of
organisation in terms of analysing the equity position and market capitalisation. With this
method value of organisation can be easily determined by valuing the value of capital. It
can be derived by starting with the price of company. It is measured by following
formula;
Equity Value = Share Price * Number of shares outstanding or
Enterprise value = Enterprise value – debt and debt equivalents – non-controlling –
interest – preferred stock + cash and cash equivalents
3. Dividend valuation model: this is the method which helps to analyse the stock price by
discounting predicted dividends to the present value. As per this valuation method if the
value acquired form the DDM is higher that the current trading price of shares then the
stock is remain undervalued. Value of stock is calculated as follows:
Value of stock = Dividend per share / discount rate – dividend growth rate
= 1.89 / 3.1 – 2.0
= 1.89%
4. Free cash flow: this is one of the essential method subject to evaluating the value of
organisation. This method basically helps to analyse the efficiency of organisation in
terms of managing the cash flow operations and fluctuation of cash with in the
organisation. This method plays vital role in respect of stakeholders and the owners of
organisation. It is calculated on the basis of cash flow form operations reported to as
operating cash or net cash from from operating activities and less capital expenditure
requirements (Xue-dong, 2013).
Free cash flow = operating cash flow – capital expenditures
= 35650 – 20845 = 14805
2
Paraphrase This Document
Need a fresh take? Get an instant paraphrase of this document with our AI Paraphraser
TASK b)
Assumption used to compute the value of organisation
There are majorly three methods are used to calculate the value of Royal Dutch Shell
organisation. There are some assumption also taken in to execute the valuation method for better
evaluation and affectivity.
Book value method: as per above analysis it is observed that the valuation of
organisation was measured as 25.9 and and S&P was seen as 500 was recorded as 22.9. price
book value for the year 2017 was recorded as 1.4 with S&P 500 3.2, price in respect of sales are
analysed as 1.0 and S&P 500 was recorded as 2.2, price and cash flow was recorded RDSB was
recorded as 7.4 and S&P 500 was recorded as 14.3 for the year 2017.
Dividend valuation method: as per dividend it is calculate that current yield rate of
return marked as follows 2.0 S&P 500 2.0 for the year 2016. 5.2 earning yield was calculated as
5.2, dividend yield was recorded as 5.3, cash return was recorded as 4.5. RDSB was recorded as
5.3 % and S&P 500 was recorded as 2.0 and RDSB 5 year average was calculated as 6.0.
Free cash flow: while calculating free cash flow of organisation there are two major
elements are taken in calculation. Operating cash flow and the capital expenditure are the
essential aspects in terms of managing the financial aspects in terms of analysing the free cash
flow. It is observed that the net cash flow form operations get increased by $16306 million in
terms. As per analysis of last year's capital expenditure it is observed that the capital expenditure
was recorded as $20845 million for the year which get decreased by $1271 for the year 2017
(Jens, 2017).
TASK c)
Analysis of result
As per the valuation method it is observed that the company has fair market value in
terms of the financial performance. it is concluded that the organisation obtained revenues of
worth $305179 million and gross profit was calculated as $55080 million in terms of defining the
strategies and plans. As per above analysis it is observed that the value of Royal Dutch Shell
positive outcome come across. It is observed that the organisation will get the values and plans in
terms with the help of determining
as per valuation of method it is observed that the price value get increased in comparison
to last financial years. There is a fractional analysis done in respect of determining the financial
3
performance and analysis of dividend policy. Price earning of five year's are evaluated as 27.5
and price book value was recorded as 1.2. price cash flow was recorded as 7.0 and the dividend
yield percentage was recorded as 6.0. moreover the cash flow was recorded as $14805 during the
year 2017 which was recorded more than the last financial years. Capital expenditure for the year
2017 was recorded as 20845 which was least comparison to last five year's financial reports.
Overall the performance of financial present favourable conditions and stakeholders has vast
opportunities in terms of investing capital (CibotariuIrina-Stefana, 2016).
TASK d)
1) Large movements
As per financial reports produced by British American Tobacco BAT lots of variations
and fluctuation are recorded in terms of sustainability and price of organisation. Organisation
basically transforms the tobacco products by offering an unrivalled suite of potentially reduced
the product risk. As per statistical report produced by BAT for the year 2017 present following
figures;
According to Key group statistics it is seen that the revenues for the year 2017 was
recorded as £20292 million, profit from operations were recorded as £6476 million, group
cigarette and tobacco heating products volumes were recorded as £686 billion, market share
growth in 2017 was calculated as +40 basis points, global drive brands volume was recorded as
£357 billion. Global drive brands market share growth was recorded as +110 basis points and
major taxed paid during the year 2017 was recorded as £37.4 billion (Gustafsson and Autio,
2011).
Markets where brands are sold recorded as 200+, markets where largest market share was
recorded as 55+, group environmental health and safety expenditure were recorded as £20
million, group research and development expenditure recorded as US $2.5 billion invested in
developing and commercialising next generation products are considered as 2012. group
charitable and community donations are recorded as £18.7 million. Shareholder ( Combined
South Africa and UK registered) as 115842 and apart form it American depositary Shares are
recorded as $10917 for the year 2017.
2) Reconcile these share price movements with the efficient market hypothesis
As per the reconcile share price of movements are considered that price earning was
recorded as 2.1 for the and S&P 500 was recorded as 20.6, five year's average price earning was
4
⊘ This is a preview!⊘
Do you want full access?
Subscribe today to unlock all pages.
Trusted by 1+ million students worldwide
recorded as 18.8. it is concluded that the price book was recorded as 1.5 BATS and S&P 500 was
recorded as 3.1 and average 5 year's was recorded as 11.9, price and sales was recorded as 3.9
BATS, S&P 500 as 2.2 and five year's average was recorded as 5.2. price cash flow was recorded
as 14.8, S&P 500 was recorded as 13.5 and 5 year's average was recorded as 18.5, dividend yield
percentage was considered 3.9% S&P 500 was recorded as 2.0% and Bats 5 years average was
recorded as 4.0% (Kayahan, 2018).
TASK e)
Unconventional monetary policy tools
Financial markets went down during the recession period and it is observed that the
markets are starting to get rattled by the winding down of unconventional monetary policies in
many advanced economics. There were only two international banks were managing the
operations and management such as Bank of Japan and the Swiss National Bank. These are the
only bank which were following monetary policies for long term perspective. The US Federal
Reserve started phasing out he assets purchase program and started normalising the interest rats
in late 2015.
As per US Federal Reserve it is observed that the asset purchase program was introduced
in 2014. the European Central Bank is musing at present and QE policy in 2018. starting phase
was recoded as interest rates. Bank of England was finished its latest round of QE was launched
after the Brexit referendum last June. As per analysis of worth of organisation in terms of Fed's
previous two tightening cycles, as per the equilibrium rate was recorded as 6.5% and 5.25%,
respectively. The global financial crisis and ensuing recession exploit in 2007-09. the fed cut the
policy to 5.25% to 0%. these was the major fluctuations made in respect of pursuing
unconventional monetary policies. There are type of accounting policies are defined in respect of
launching QE for the first time (Jacob, 2016).
After implementing the plans it was analysed that the monetary policy and cycle was seen
that the equilibrium was recorded as 3% and the next recession hit the point. There was enough
scope for the manoeuvre effectively and interest rates also cut down with the Zero price and low
interest rates. It is seen that meaningful aspects are considered in terms of four options, each with
its own cost and benefits. This was the major aspects which was considered while fluctuating
with the prices and the plans (Aydin and Cavdar, 2015).
5
Paraphrase This Document
Need a fresh take? Get an instant paraphrase of this document with our AI Paraphraser
CONCLUSSION
This report is prepared to analyse the investment strategies and the investment plans for
managing the investment as per stakeholders perspective. There is a cost evaluation of
organisations done of Royal Dutch Shell and analysation of financial strategies are also defined
in this context. It is also observed that the which valuation method is beneficial in terms of
attracting the stakeholders perspective.
6
REFERENCES
Books and Journals:
Doğan, C. and Arslan, Ü., 2016. Political Globalization and Foreign Direct Investment Inflows in
Turkey. International Journal of Business and Social Research. 6(5). pp.43-48.
Antony, A. and Joseph, A.I., 2017. Influence of Behavioural Factors Affecting Investment
Decision—An AHP Analysis. Metamorphosis. 16(2). pp.107-114.
Xue-dong, K.A.N.G., 2013. Analysis and Research on Financing Model of Intercity
Railway. Journal of Railway Engineering Society. 8. p.024.
Jens, C. E., 2017. Political uncertainty and investment: Causal evidence from US gubernatorial
elections. Journal of Financial Economics. 124(3). pp.563-579.
Cibotariu. Irina-Stefana, 2016. The Benefits of the Company regarding the Investment in Human
Resource. Eur. JL & Pub. Admin.. 3. p.29.
Gustafsson, R. and Autio, E., 2011. A failure trichotomy in knowledge exploration and
exploitation. Research Policy. 40(6). pp.819-831.
Kayahan, C., 2018. Understanding the Financial Derivatives Instruments. In Risk and
Contingency Management: Breakthroughs in Research and Practice (pp. 45-59). IGI
Global.
Jacob, M.B., 2016. Pedagogy of Financial Education among College Students. Economics and
Culture. 13(2). pp.23-34.
Aydin, A.D. and Cavdar, S.C., 2015. Prediction of financial crisis with artificial neural network:
an empirical analysis on Turkey. International Journal of Financial Research, 6(4),
p.36.
7
⊘ This is a preview!⊘
Do you want full access?
Subscribe today to unlock all pages.
Trusted by 1+ million students worldwide
1 out of 9
Related Documents


Your All-in-One AI-Powered Toolkit for Academic Success.
+13062052269
info@desklib.com
Available 24*7 on WhatsApp / Email
![[object Object]](/_next/static/media/star-bottom.7253800d.svg)
Unlock your academic potential
Copyright © 2020–2026 A2Z Services. All Rights Reserved. Developed and managed by ZUCOL.