Comprehensive Financial and Ethical Analysis of BG Group's Operations
VerifiedAdded on 2022/08/29
|8
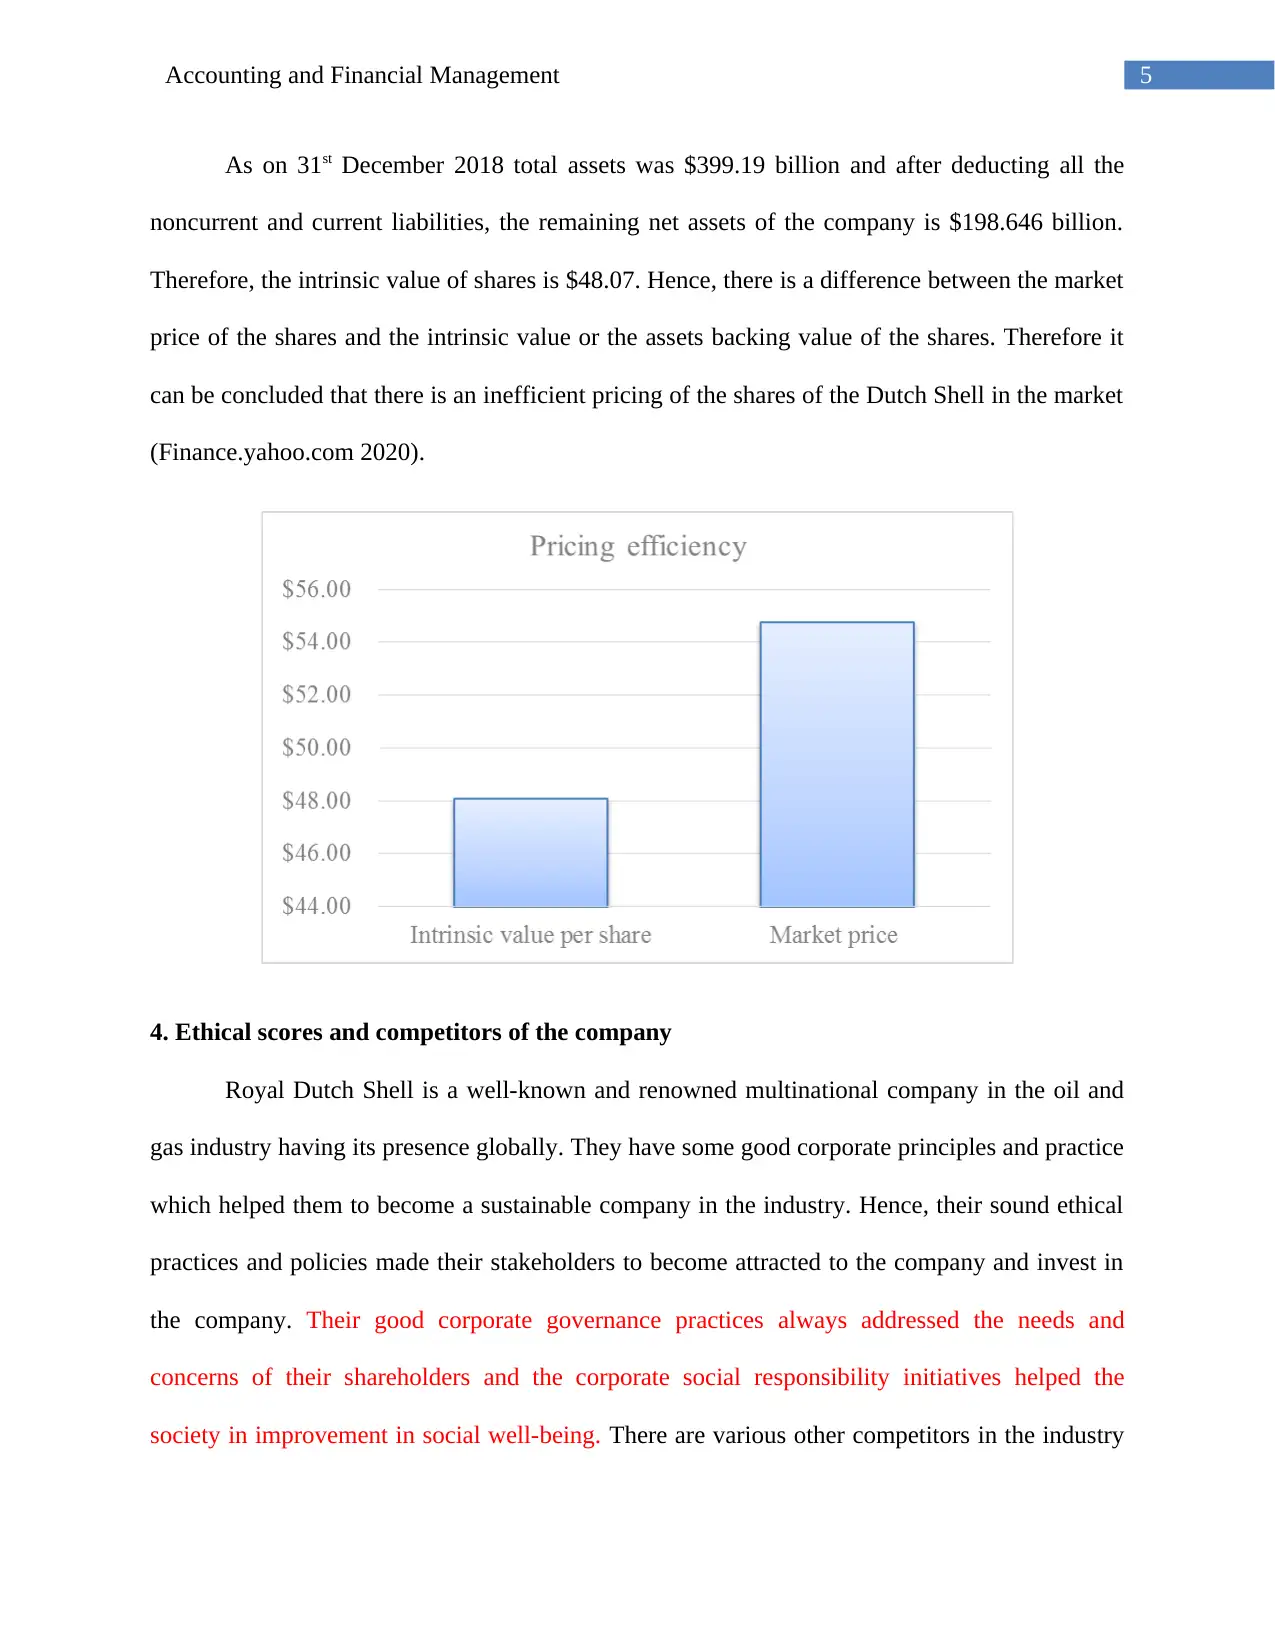
|1303
|14
Report
AI Summary
This report offers a comprehensive financial analysis of the BG Group, examining its capital structure, risk and return on shares, and pricing efficiency. The analysis, based on data from the Dutch Shell acquisition, reveals that the company maintained a balanced capital structure, with approximately 50% equity and 50% debt. The report calculates the average return and risk coefficient of the shares, comparing them to risk-free rates. Furthermore, it assesses the pricing efficiency by comparing the market price to the intrinsic value of the shares. The report also evaluates the ethical scores and compares the company to its competitors, highlighting its sound corporate governance practices. References include annual reports and financial websites.

1 out of 8
Related Documents


Your All-in-One AI-Powered Toolkit for Academic Success.
+13062052269
info@desklib.com
Available 24*7 on WhatsApp / Email
![[object Object]](/_next/static/media/star-bottom.7253800d.svg)
Copyright © 2020–2026 A2Z Services. All Rights Reserved. Developed and managed by ZUCOL.