Royal Holloway Strategic Finance: CAPM Usefulness and Limitations
VerifiedAdded on 2023/03/30
|8
|2324
|135
Essay
AI Summary
This essay provides a comprehensive analysis of the Capital Asset Pricing Model (CAPM), a widely used model in finance for investment decisions. It explores the model's usefulness, benefits, and limitations, particularly in light of recent developments and alternative models like the Fama-French three-factor and five-factor models. The essay delves into the underlying assumptions of CAPM, its application in determining asset pricing, and the challenges faced in its practical implementation. It also discusses the Security Market Line (SML) as a graphical representation of CAPM, and compares CAPM with the Fama-French models, highlighting the factors considered by each model in calculating the rate of return. The essay concludes that while CAPM remains a valuable tool, its reliance on assumptions and the emergence of more comprehensive models necessitate a critical evaluation of its applicability in today's dynamic business environment.

Capital Asset Pricing Model
1
1
Paraphrase This Document
Need a fresh take? Get an instant paraphrase of this document with our AI Paraphraser
Introduction
The Capital Asset Pricing Model (CAPM) is regarded as the best model in finance for
facilitating investment decisions by depicting a relation between the risks and returns of a
security. It however incorporates the use of various assumptions of a perfect capital market as
per which a linear relation is present between the expected returns and the market beta and does
not take into account other factors are necessary for explaining the expected returns from a
security. It has been regarded as a credible and reliable model for pricing of assets and foresting
the performance of an asset in the present dynamic business environment. It is theoretical model
used for determining the required rate of return of an asset on the basis of condition that an asset
is added into a well-diversified portfolio. As such, it is based on the condition that an asset
should be independent added into a diversified portfolio. CAPM is regarded as one of the best
asset pricing model but there have been other alternative models as well that have been
developed in the context of determining the price of an asset. These alternative models include
three-factor and five-factor model that have been proposed by Eugene Fama and Kenneth French
(Fama & French). In this context, this essay has been developed for presenting a discussion
regarding the usefulness, benefits and limitations of CAPM model in finance and its applicability
for determining the rate of return of an asset (Galariotis & Giouvria, 2015). The various
assumptions and estimates that the model has incorporated for determination of rate of return of
an asset has been discussed in detail within the essay. It also provides discussion about the
methods that can be used for eliminating the use of CAPM and also significant problems that
have been faced in its application.
Critical discussion on Capital Assets Pricing Model on the basis of its usefulness and
underlying assumptions
Concept of Capital asset pricing model
This model finds extensive use in pricing of assets by providing an analysis of the risk
undertaken by an investor and the expected returns to be achieved on the basis of risks
undertaken by them. The model has found extensive use in the field of finance as it is considered
to be the most reliable model that is used for determining an asset price by depicting a relation
between its associated risk and the returns. The CAPM model is being used extensively for
depicting the relation between expected rate of return on an investment and its associated
systematic risk (Fama and French, 2014). The formula that has been provided by the
model for determining the rate of return on an asset can be depicted as follows:
Ri = Rf + β (Rm – Rf)
The different components of the above stated formula:
where ‘Ri’ depicts required return on investment
2
‘Rf’ is the risk free rate of return. The factor is not held constant and fluctuates in accordance
with the systematic risk in reference to the rest of the market
‘β’ is systematic risk or beta factor that depicts the risk in relation to the entire market
segment and is non-diversifiable as it is inherent within the overall market
‘Rm – Rf’ represents the equity risk premium that can be regarded as the additional risk for
investing within the capital market in addition with the associated premium return (Galariotis
& Giouvria, 2015).
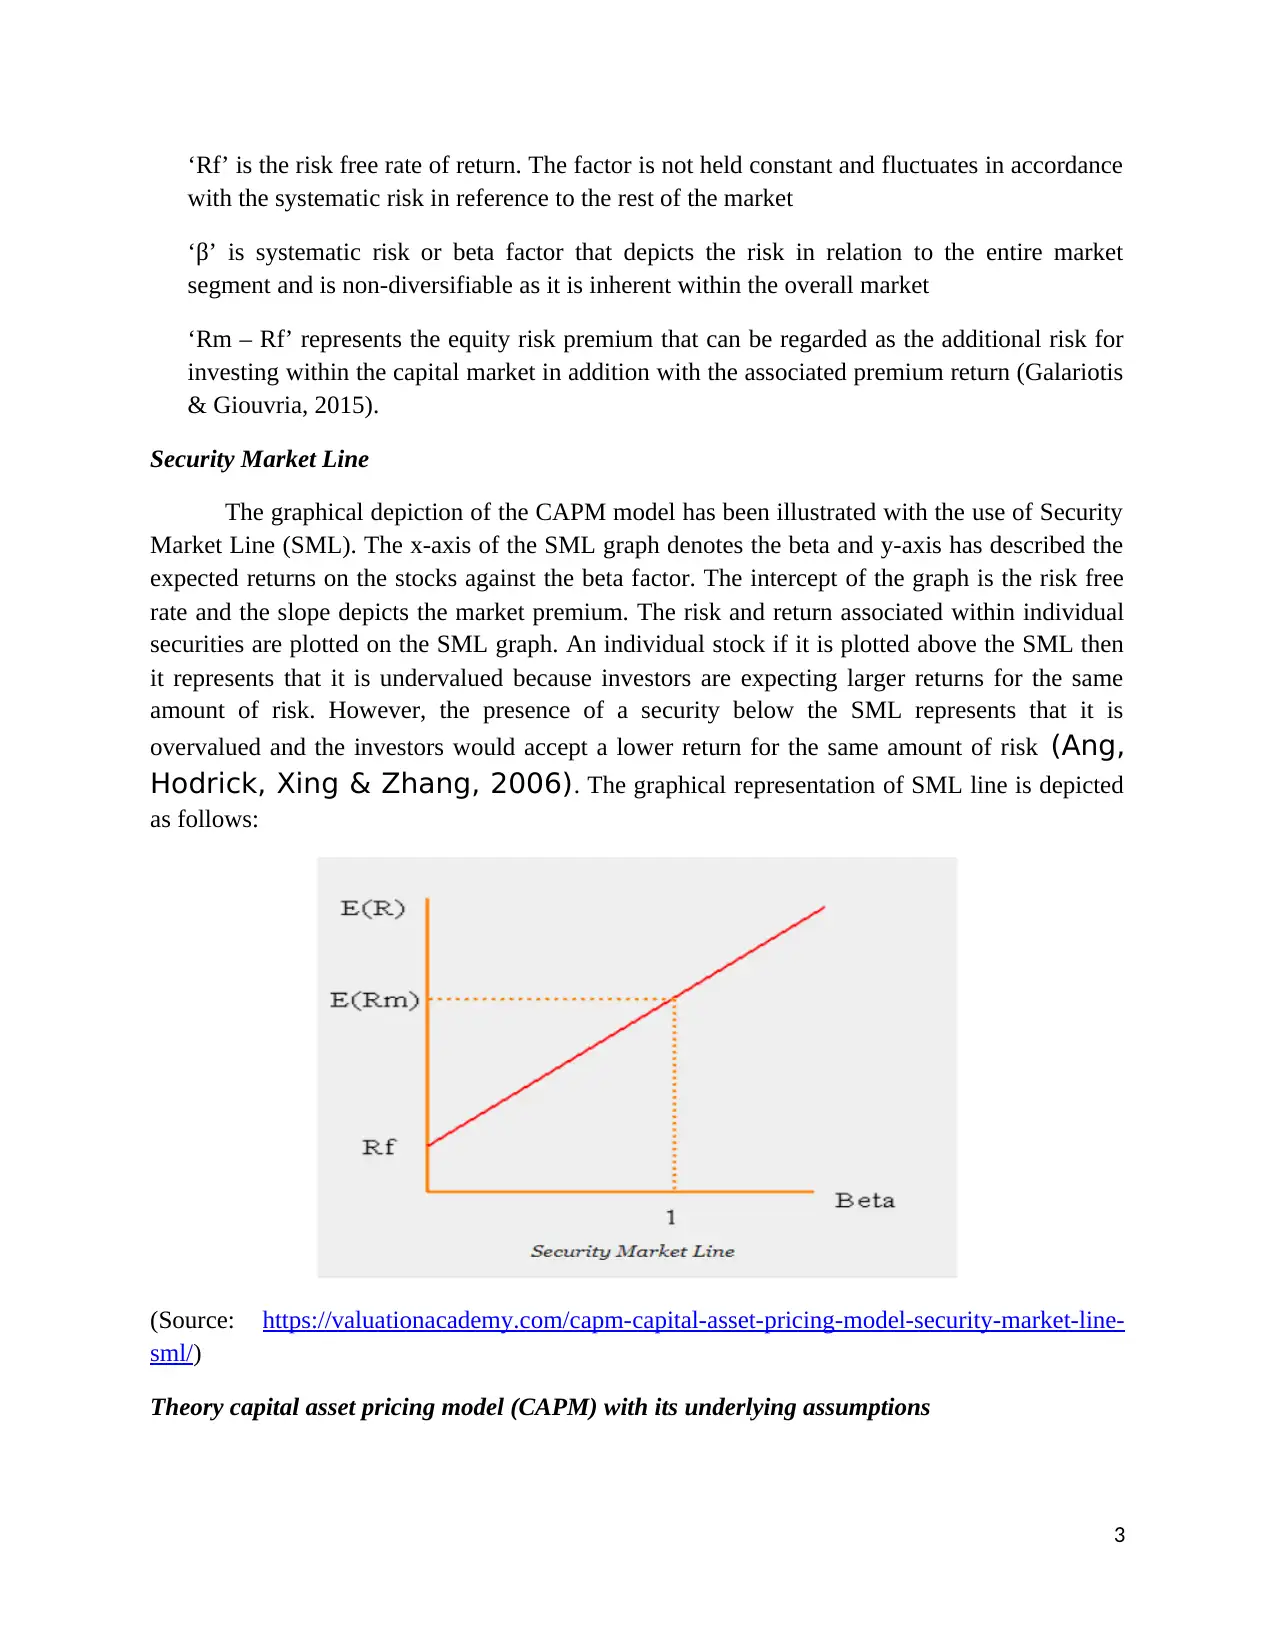
Security Market Line
The graphical depiction of the CAPM model has been illustrated with the use of Security
Market Line (SML). The x-axis of the SML graph denotes the beta and y-axis has described the
expected returns on the stocks against the beta factor. The intercept of the graph is the risk free
rate and the slope depicts the market premium. The risk and return associated within individual
securities are plotted on the SML graph. An individual stock if it is plotted above the SML then
it represents that it is undervalued because investors are expecting larger returns for the same
amount of risk. However, the presence of a security below the SML represents that it is
overvalued and the investors would accept a lower return for the same amount of risk (Ang,
Hodrick, Xing & Zhang, 2006). The graphical representation of SML line is depicted
as follows:
(Source: https://valuationacademy.com/capm-capital-asset-pricing-model-security-market-line-
sml/)
Theory capital asset pricing model (CAPM) with its underlying assumptions
3
with the systematic risk in reference to the rest of the market
‘β’ is systematic risk or beta factor that depicts the risk in relation to the entire market
segment and is non-diversifiable as it is inherent within the overall market
‘Rm – Rf’ represents the equity risk premium that can be regarded as the additional risk for
investing within the capital market in addition with the associated premium return (Galariotis
& Giouvria, 2015).
Security Market Line
The graphical depiction of the CAPM model has been illustrated with the use of Security
Market Line (SML). The x-axis of the SML graph denotes the beta and y-axis has described the
expected returns on the stocks against the beta factor. The intercept of the graph is the risk free
rate and the slope depicts the market premium. The risk and return associated within individual
securities are plotted on the SML graph. An individual stock if it is plotted above the SML then
it represents that it is undervalued because investors are expecting larger returns for the same
amount of risk. However, the presence of a security below the SML represents that it is
overvalued and the investors would accept a lower return for the same amount of risk (Ang,
Hodrick, Xing & Zhang, 2006). The graphical representation of SML line is depicted
as follows:
(Source: https://valuationacademy.com/capm-capital-asset-pricing-model-security-market-line-
sml/)
Theory capital asset pricing model (CAPM) with its underlying assumptions
3
⊘ This is a preview!⊘
Do you want full access?
Subscribe today to unlock all pages.
Trusted by 1+ million students worldwide
This model has been build to help in portfolio selection as described by Markowtiz in its
research paper. CAPM model has been developed considering the law of investor’s behaviour in
selecting the best portfolio. As outlined by Markowtiz, the selection of portfolio is dependent
upon the mean variance maxim which means investors consider only the mean variance frontier
in the available portfolios. It means selection of portfolio is dependent upon the two main
criteria, portfolio with given level of risk having maximum return or portfolio with given of
return with minimum risk. Investors will make a choice of portfolio form the given efficient set
that best suites its risk preferences (Li, 2012).
This pricing model is regarded as the extension of the portfolio theory as provided by
Markowitz. The theory provided by Markowitz provides detailed explanation on rationality of
the investors in selecting the most efficient portfolio on the basis of risk and return preference. In
this regards capital asset pricing model proves to best model in establishing the relationship and
providing information on how assets in portfolio should be priced in the given capital market.
According to the underlying assumption provided in CAPM model, risk parameter (beta
coefficient) differs as per the market proxy for which the particular belongs. When any asset or
security having beta of zero will have return equal to the risk free rate of return but in actual the
return results will be slightly greater than the risk free rate of return. It reflects presence of non
beta risk factors within the asset that can be termed as unsystematic risk (Elbannan,
2015). There have been empirical evidences that reflect that in long run, high risk portfolio
will have higher returns as compared to low risk portfolio. But in short run it is not the case as
risk and return diverge strikingly and it is impossible to establish the relationship between risk
and return. So it can be said that CAPM proves to be successful measure of asset pricing only
when the underlying assumptions have been successfully placed in the capital market but in short
period of investment it is not possible to do so (Krueger, 2010).
It is critically based on its assumptions to provide the required output. In case the
assumptions defined under CAPM does not holds true than output gathered by the CAPM Model
will not be able prove the asset pricing and relationship between risk and return differs to the
larger extent (Lewellen & Nagel, 2006). In this context, some of the basic assumptions
defined under CAPM model are provided below:
It is expected that investors make decisions solely on the assessment of risk and return i.e.
they make use of expected return (Calculated through CAPM) and standard deviation
measures
The transactions of sale and purchase have been undertaken in the infinitely divisional units
i.e investors are free to purchase and sale n number of securities in the given capital market
There has been no limit on short selling of N number of shares in the given capital market
4
Paraphrase This Document
Need a fresh take? Get an instant paraphrase of this document with our AI Paraphraser
There has established perfect competition in the market and no single investor has the power
to influence the prices of securities
There has been no transaction cost involved in purchase and sale of securities
There has been no income tax (Economic Discussion, 2009)
Explanation on how Fama French Three Factor Model and Five Factor Model are better
than Capital Asset pricing model
The Fama French Three Factor Model was developed by Nobel laureates Eugene Fama
and his teammate Kenneth French in the early 90’s. It is an asset pricing model and is regarded
as an extended version CAPM by adding two more factors other than risk factor of Beta
coefficient. The two other factors that are added with risk factor Beta is size risk and value risk
factors. It is grounded on Arbitrage Pricing Theory (APT) that is a very prominent model which
states that high or low market value of a particular stock will be balanced in future automatically
with the market price or industry price. The theory depicts that non diversifiable risk is having a
quality of complexity because systematic risk is dependent on various economic risk factors and
macro events such as interest rate changes, oil prices, government spending, foreign exchange
rates and others (Rossi, 2012).
The theory of CAPM in Comparison to TFM is dependent only on change in beta when
there is a change in market. The asset pricing model provided by Fama and French has
considered the factors in addition with beta having a connection with the returns provided by a
security. The model of Fama and French detected highly varied return by companies having
different market financing but having same beta. The return is also contingent on the book to
market value. Thus, the Three Factor Model have been evolved by Fama and French that
describes that returns realized on a security is dependent on market return, the return on the size
of the portfolio and the return on a high minus low book to market portfolio (Erding, 2017).
SMB is the abbreviation used for differentiating between small and the big cap portfolios and
HML is used to recognize the variances between high and low book market portfolios.
(Lohramann, 2014). This model is the result of an econometric throwback of historical stock
prices (Eraslan, 2013).
Modified Fama French Model or Fama French five factor model
Fama French in the year 2014 have widened their three factor model to five factor model
by inclusion of factors such as momentum, quality and low volatility, among others. Author
wished to check whether returns can be explained and forecasted more meticulously by adding
more factors to the three factor model. So Author developed the five factor model that can
automatically correlate with returns. The fourth factor Profitability is added considering the
concept that entities having higher future earnings will have higher return in the stock market.
The fifth factor Investment is included by adding the concept of internal investment and returns.
5
According to it companies may learn a loss in stock market that is reporting profits towards the
major growth projects. Studies have shown that returns go with the short term trend before
following long term trends (Blanco, 2012).
The reason why Fama French Three factor and CAPM model is considered only one risk
factor while calculating rate of return whereas TFM and modified model considers that while
calculating rate of return other factors do have effect on the rate of return along with beta. CAPM
model has many assumptions that are sometimes not go correct with the company in which it
deals. Different companies are affected by different risk factors and while calculating the rate of
return all the risk factors should be considered to get an actual rate of return. For example
changes in oil prices will have effect on U.S. Oil’s and Hunt Oil Co.’s rate of return but it will
not affect the rate of return of Woodward steel company (Lohramann, 2014).
Conclusion
It can be concluded from the above discussion that CAPM is still regarded as the best
method that is used by investors for determination of the expected returns on an asset through its
different assumptions and estimates have received criticism. The use of different assumptions in
the model has raised significant concerns regarding its wider use in valuation of securities. The
assumption of perfect market in the CAPM model has been criticized and it has negatively
impacted its practical usefulness. This is because it is not possible to assume that in a market
there does not have any taxes and transaction costs. The use of alternative model such as three-
factor model have provided an alternative to CAPM but yet it has been regarded as the best
model to be used for asset pricing has it takes into consideration the factor of beta that is
systematic risk.
6
⊘ This is a preview!⊘
Do you want full access?
Subscribe today to unlock all pages.
Trusted by 1+ million students worldwide
References
Ang, A., Hodrick, R.J., Xing, Y. & Zhang, X. (2006). The cross section
volatility and Expected Returns. The Journal of Finance, 61, 1,
pp.259 -299.
Blanco, B. (2012). The use of CAPM and Fama and French Three Factor Model: portfolios
selection. Public and Municipal Finance 1(2), pp.61-70.
Economic Discussion. (2009). CAPM: Assumptions and Limitations. Retrieved 9 June, 2019,
from http://www.economicsdiscussion.net/portfolio-management/capm/capm-assumptions-
and-limitations-securities-financial-economics/29904
Elbannan, M.A. (2015). The Capital Asset Pricing Model: An Overview
of the Theory. International Journal of Economics and Finance
7(1), pp. 216-228.
Eraslan, V. (2013). Fama and French Three-Factor Model: Evidence from Istanbul Stock
Exchange. Business and Economics Research Journal 4(2), pp.11-22.
Erding, Y. (2017). Comparison of CAPM, Three-Factor Fama-French Model and Five-Factor
Fama-French Model for the Turkish Stock Market. Retrieved 9 June, 2019, from
https://www.intechopen.com/books/financial-management-from-an-emerging-market-
perspective/comparison-of-capm-three-factor-fama-french-model-and-five-factor-fama-french-
model-for-the-turkish-
Fama, E.F. and French, K.R. (2014). A five-factor asset pricing
model. Journal of Financial Economics 116, pp.1-22.
Galariotis, E. & Giouvria, E. (2015). On the stock market liquidity and the
business cycle: A multi country approach. International Review
of Financial Analysis 38, pp.44-69.
Krueger, G. (2010). The Size Effect and the Capital Asset Pricing Model. Retrieved 9 June,
2019, from https://www.minneapolisfed.org/~/media/files/mea/contest/2010papers/
gupta.pdf?la=en
Lewellen, J & Nagel, S. (2006). The conditional CAPM Does not
Explain Asset Pricing Anomalies. The Journal of Financial
Economics, 82, 2, pp.289-314.
7
Paraphrase This Document
Need a fresh take? Get an instant paraphrase of this document with our AI Paraphraser
Li, X. (2012). Applicability Evaluation to Capital Asset Pricing Model.
National Conference on Information Technology and Computer
Science.
Lohramann, C. (2014). Comparison of the CAPM, the Fama-French Three Factor Model and
Modifications. Retrieved 9 June, 2019, from https://www.grin.com/document/304738
Rossi, F. (2012). The Three-Factor Model: Evidence from the Italian Stock Market. Research
Journal of Finance and Accounting 3(9), pp. 151-159.
8
1 out of 8
Related Documents


Your All-in-One AI-Powered Toolkit for Academic Success.
+13062052269
info@desklib.com
Available 24*7 on WhatsApp / Email
![[object Object]](/_next/static/media/star-bottom.7253800d.svg)
Unlock your academic potential
Copyright © 2020–2026 A2Z Services. All Rights Reserved. Developed and managed by ZUCOL.