Data Analysis and Transformation of Patient Survey Data using RStudio
VerifiedAdded on 2022/11/15
|17
|2130
|263
Report
AI Summary
This report analyzes patient survey data (HCAHPS) using RStudio, focusing on data transformation and descriptive statistics. The study investigates the distribution of inpatient stay ratings, addressing skewness through log, square root, and cube root transformations. Descriptive statistics and visualizations are used to assess the data before and after transformation. The analysis also addresses missing data, comparing results with and without handling missing values, particularly in a subset of data from Rhode Island. The report explores the impact of different transformations on data characteristics and interpretation, providing insights into the inpatient experience and the importance of data distribution analysis. The R code used for the analysis is also provided in the appendix.

Running head: RSTUDIO/TRANSFORM DATA 1
RStudio/Transform Data
Name:
Institution:
RStudio/Transform Data
Name:
Institution:
Paraphrase This Document
Need a fresh take? Get an instant paraphrase of this document with our AI Paraphraser
RSTUDIO/TRANSFORM DATA 2
Introduction
Understanding health care service quality is vital as it helps the policymakers and
stakeholders find the best way to improve the services. Patient survey (HCAHPS) – National
data will be used to assess how the inpatients stay ratings are. This is a national standardized
survey of inpatients stays experience during treatment. Thus, the data used are representative
of the entire population. In this case, it is quite essential not to only concentrate with point
estimates rather look at the distribution of the data in general. For instance, a variable might
have few outliers, and when the average is used to describe the data it might not be
representative as it might be inflated or deflated. The report will assess the point and data
distribution, in general, using both descriptive and visual aids. Data transformation was
performed, and descriptive statistics assessed.
Methods
The square root, log, and cube root data transformation was applied as the data were a bit
skewed. This kind of transformation helps in reducing the skewness coefficient as well as
changing some distribution shape. In this case, these transformations are ideal as they ensure
that the resultant data and descriptive analysis have a simple interpretation. The log and
square root transformation help in linearizing/straighten some non-linear relationship, which
helps in modelling the data in a simpler form. However, in some cases, when log-
transformation is used, it may lead to inconsistency and wrong choice of the model. Thus, the
transformed data may give a wrong impression. Sometimes the transformed data may lose
meaning and become quite hard to interpret.
RSTUDIO/TRANSFORM DATA 3
Results
PART 1: Transformations
The descriptive analysis of the data before the transformation was carried out and the results
are as follows:
summary(Percent)
Min. 1st Qu. Median Mean 3rd Qu. Max.
1.00 40.00 102.00 72.46 102.00 103.00
The summary shows that on average the HCAHPS Answer Percent was around 72.46% (sd =
36.30906%) (Chatfield, 2018). This implies that most of the in patients had a better
experience on their inpatient hospital stay. The minimum HCAHPS Answer Percent was
1.00% and a maximum of 103.00%. The lower quartile was 40.00% and upper quartile was
102.00%, implying that the middle 50% of the inpatient experience was between 40.00% and
102.00%. The median was 102.00%, which is significantly greater than the mean. This
suggests that the data are highly positively skewed.
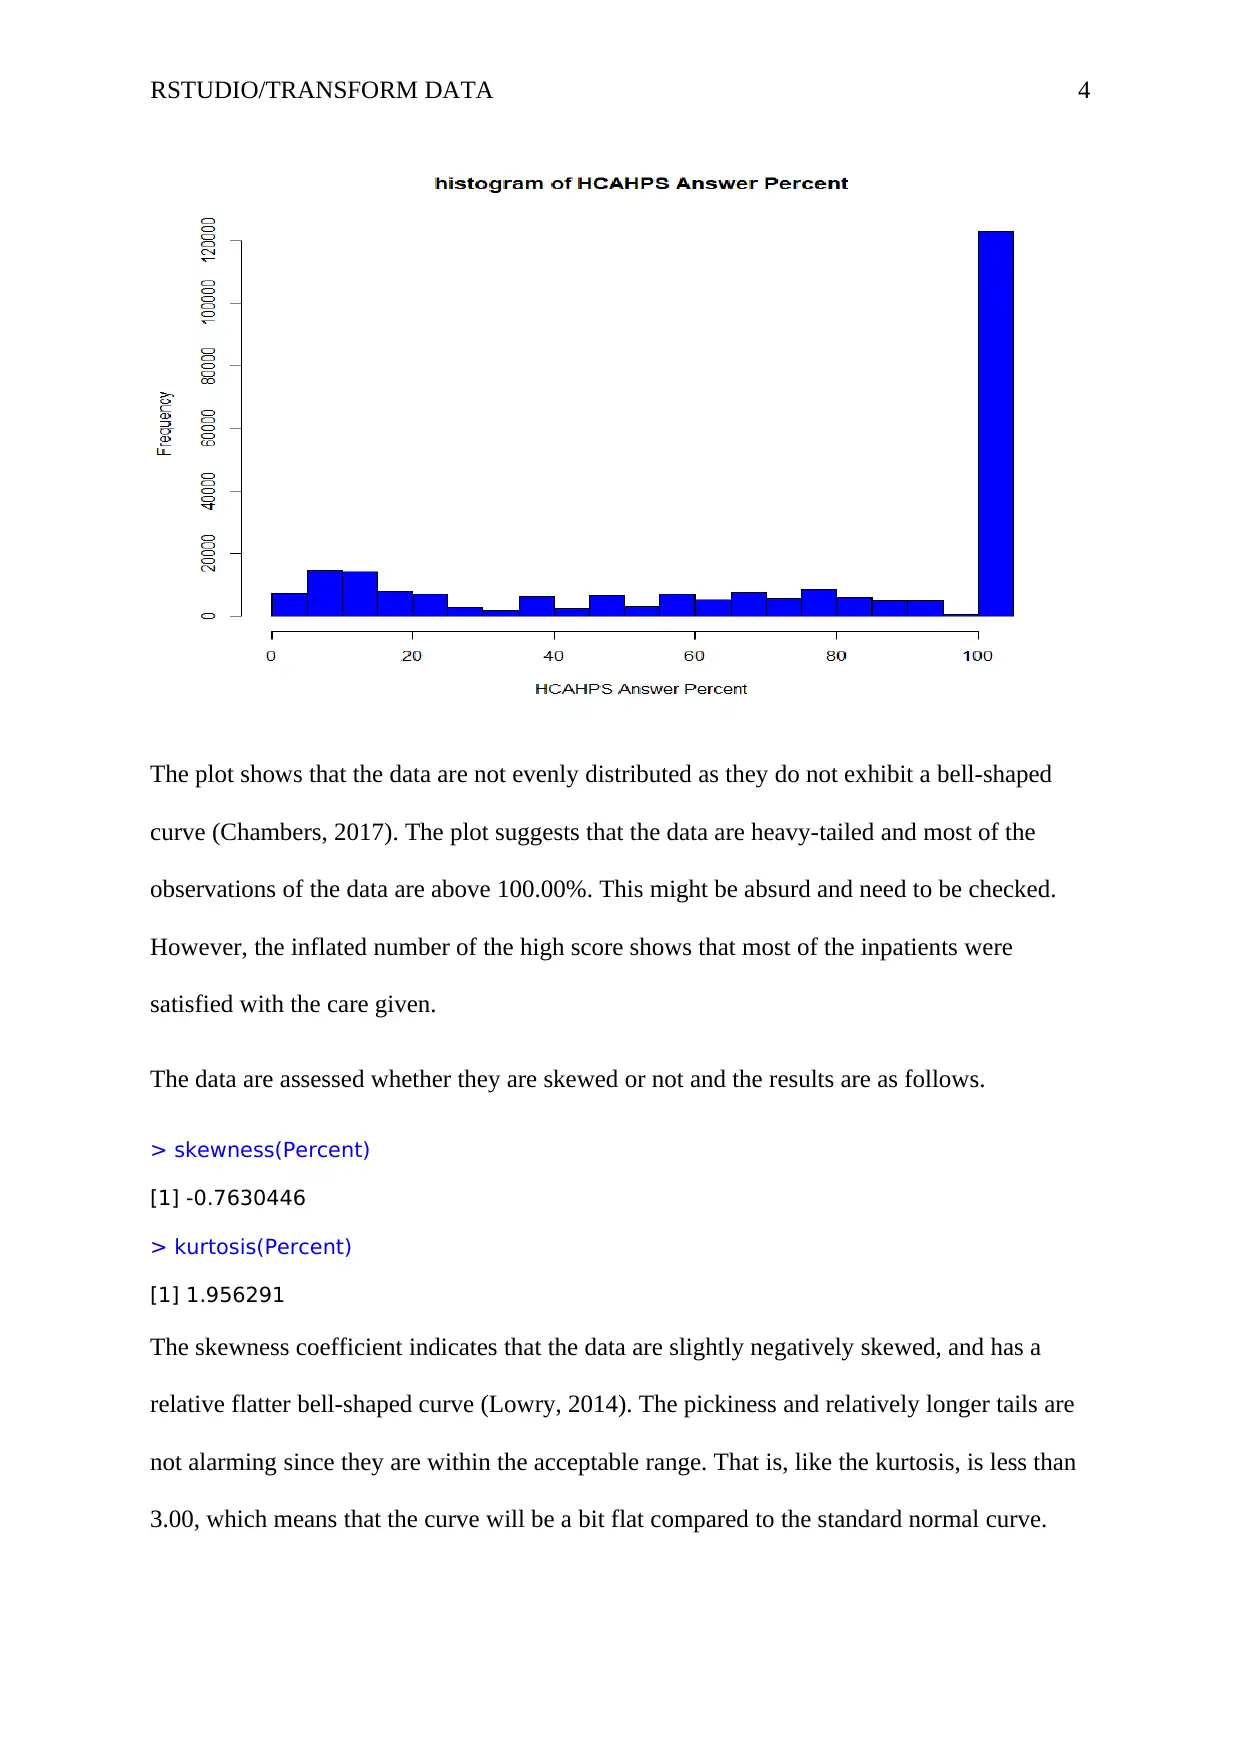
A visual analysis was carried out and the histogram plotted is as follows.
Results
PART 1: Transformations
The descriptive analysis of the data before the transformation was carried out and the results
are as follows:
summary(Percent)
Min. 1st Qu. Median Mean 3rd Qu. Max.
1.00 40.00 102.00 72.46 102.00 103.00
The summary shows that on average the HCAHPS Answer Percent was around 72.46% (sd =
36.30906%) (Chatfield, 2018). This implies that most of the in patients had a better
experience on their inpatient hospital stay. The minimum HCAHPS Answer Percent was
1.00% and a maximum of 103.00%. The lower quartile was 40.00% and upper quartile was
102.00%, implying that the middle 50% of the inpatient experience was between 40.00% and
102.00%. The median was 102.00%, which is significantly greater than the mean. This
suggests that the data are highly positively skewed.
A visual analysis was carried out and the histogram plotted is as follows.
⊘ This is a preview!⊘
Do you want full access?
Subscribe today to unlock all pages.
Trusted by 1+ million students worldwide
RSTUDIO/TRANSFORM DATA 4
The plot shows that the data are not evenly distributed as they do not exhibit a bell-shaped
curve (Chambers, 2017). The plot suggests that the data are heavy-tailed and most of the
observations of the data are above 100.00%. This might be absurd and need to be checked.
However, the inflated number of the high score shows that most of the inpatients were
satisfied with the care given.
The data are assessed whether they are skewed or not and the results are as follows.
> skewness(Percent)
[1] -0.7630446
> kurtosis(Percent)
[1] 1.956291
The skewness coefficient indicates that the data are slightly negatively skewed, and has a
relative flatter bell-shaped curve (Lowry, 2014). The pickiness and relatively longer tails are
not alarming since they are within the acceptable range. That is, like the kurtosis, is less than
3.00, which means that the curve will be a bit flat compared to the standard normal curve.
Paraphrase This Document
Need a fresh take? Get an instant paraphrase of this document with our AI Paraphraser
RSTUDIO/TRANSFORM DATA 5
The data transformation using the log-transformation was carried out, and the summary
command. The results are as tabulated below.
> summary(log_Percent)
Min. 1st Qu. Median Mean 3rd Qu. Max.
0.000 3.689 4.625 4.003 4.625 4.635
> sd(log_Percent)
[1] 0.9435911
The summary indicates that on average, the log percentage HCAHPS Answer was 4.003 (SD
= 0.9436). The interquartile range was 0.936, which represent the difference between the
upper and lower quartile values. The median is still higher than the mean, which deduces that
the data re still negatively skewed (Chatfield, 2018).
The skewness and kurtosis coefficients are as summarized below.
> skewness(log_Percent)
[1] -1.588733
> kurtosis(log_Percent)
[1] 4.707022
The skewness coefficient is greater than 1, which is a clear indication than the data are
heavily negative skewed. Also, the kurtosis coefficient is greater than 3.00, indicating that the
data are picked. The visual display of the log-transformed data is as illustrated below.
The data transformation using the log-transformation was carried out, and the summary
command. The results are as tabulated below.
> summary(log_Percent)
Min. 1st Qu. Median Mean 3rd Qu. Max.
0.000 3.689 4.625 4.003 4.625 4.635
> sd(log_Percent)
[1] 0.9435911
The summary indicates that on average, the log percentage HCAHPS Answer was 4.003 (SD
= 0.9436). The interquartile range was 0.936, which represent the difference between the
upper and lower quartile values. The median is still higher than the mean, which deduces that
the data re still negatively skewed (Chatfield, 2018).
The skewness and kurtosis coefficients are as summarized below.
> skewness(log_Percent)
[1] -1.588733
> kurtosis(log_Percent)
[1] 4.707022
The skewness coefficient is greater than 1, which is a clear indication than the data are
heavily negative skewed. Also, the kurtosis coefficient is greater than 3.00, indicating that the
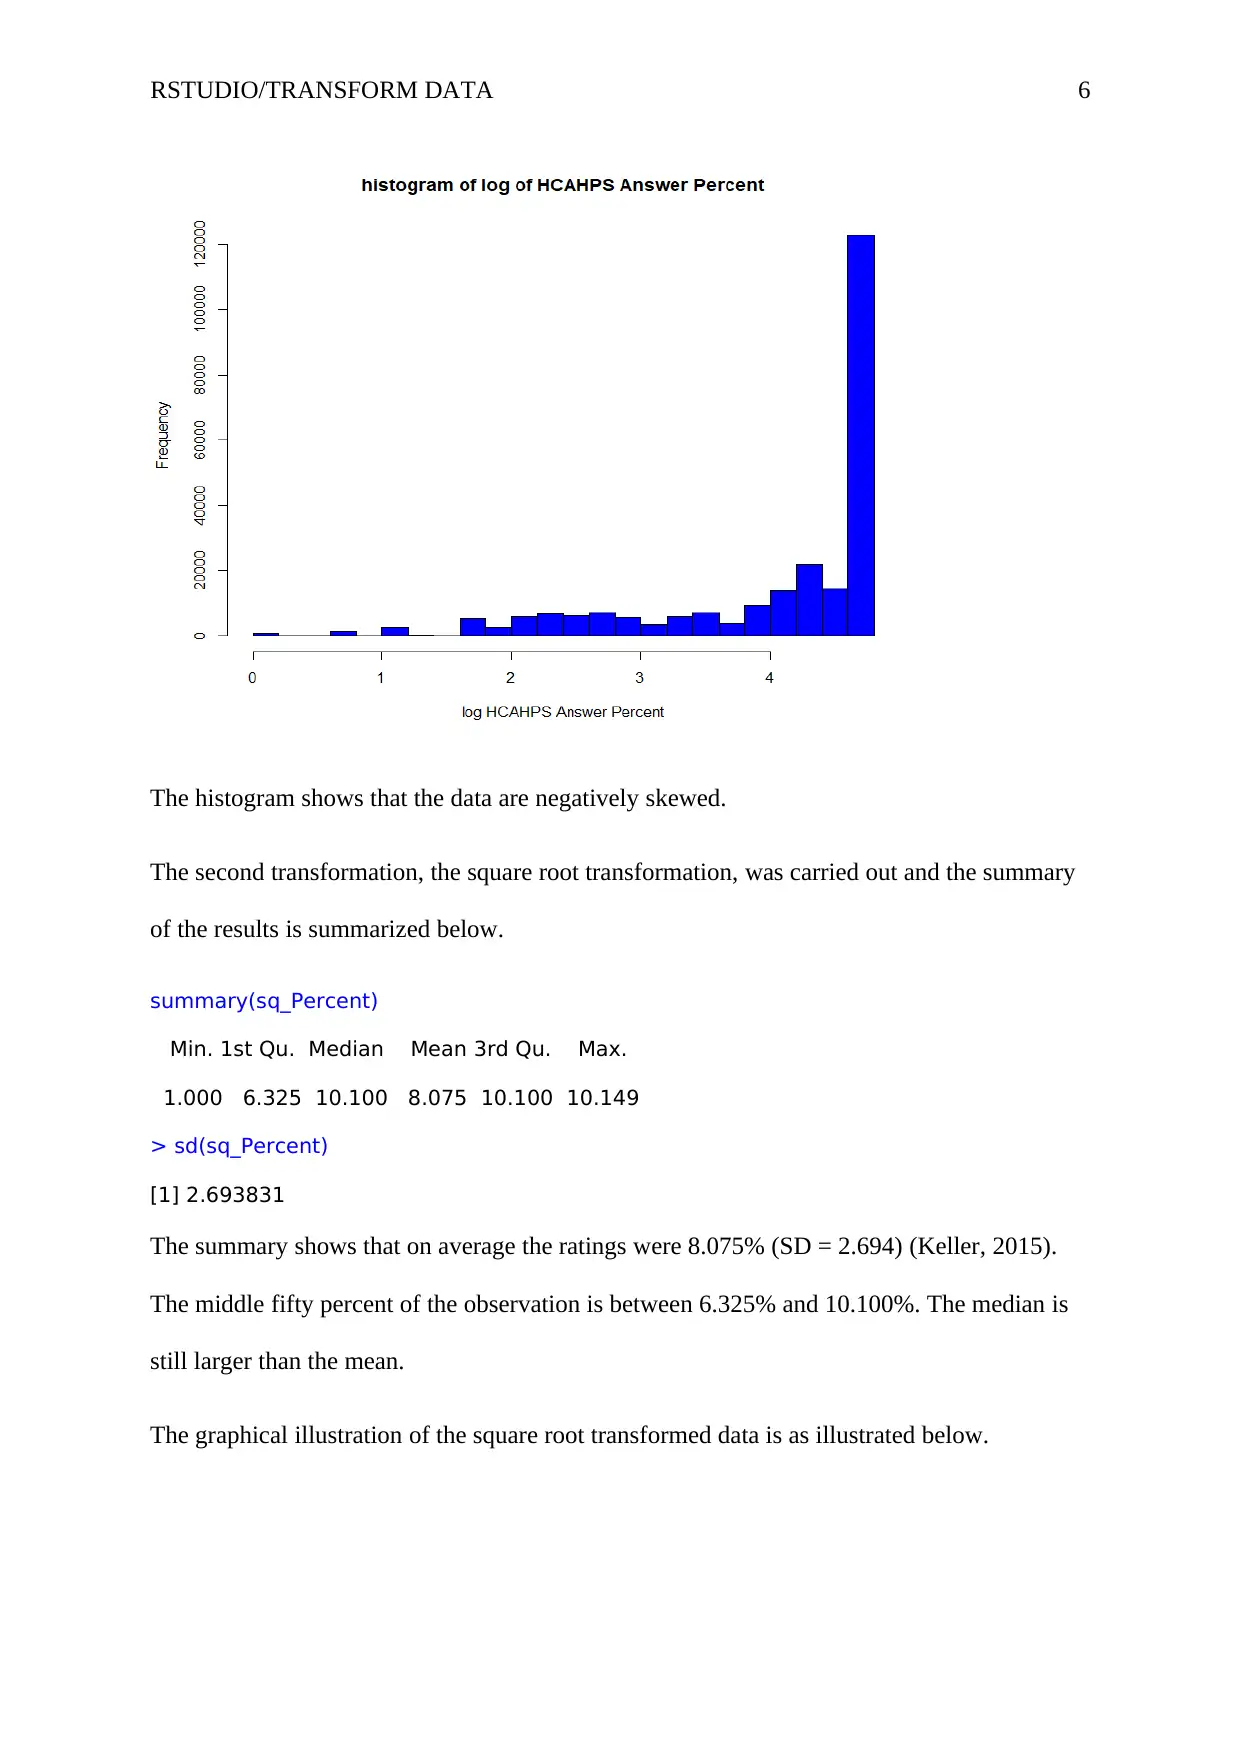
data are picked. The visual display of the log-transformed data is as illustrated below.
RSTUDIO/TRANSFORM DATA 6
The histogram shows that the data are negatively skewed.
The second transformation, the square root transformation, was carried out and the summary
of the results is summarized below.
summary(sq_Percent)
Min. 1st Qu. Median Mean 3rd Qu. Max.
1.000 6.325 10.100 8.075 10.100 10.149
> sd(sq_Percent)
[1] 2.693831
The summary shows that on average the ratings were 8.075% (SD = 2.694) (Keller, 2015).
The middle fifty percent of the observation is between 6.325% and 10.100%. The median is
still larger than the mean.
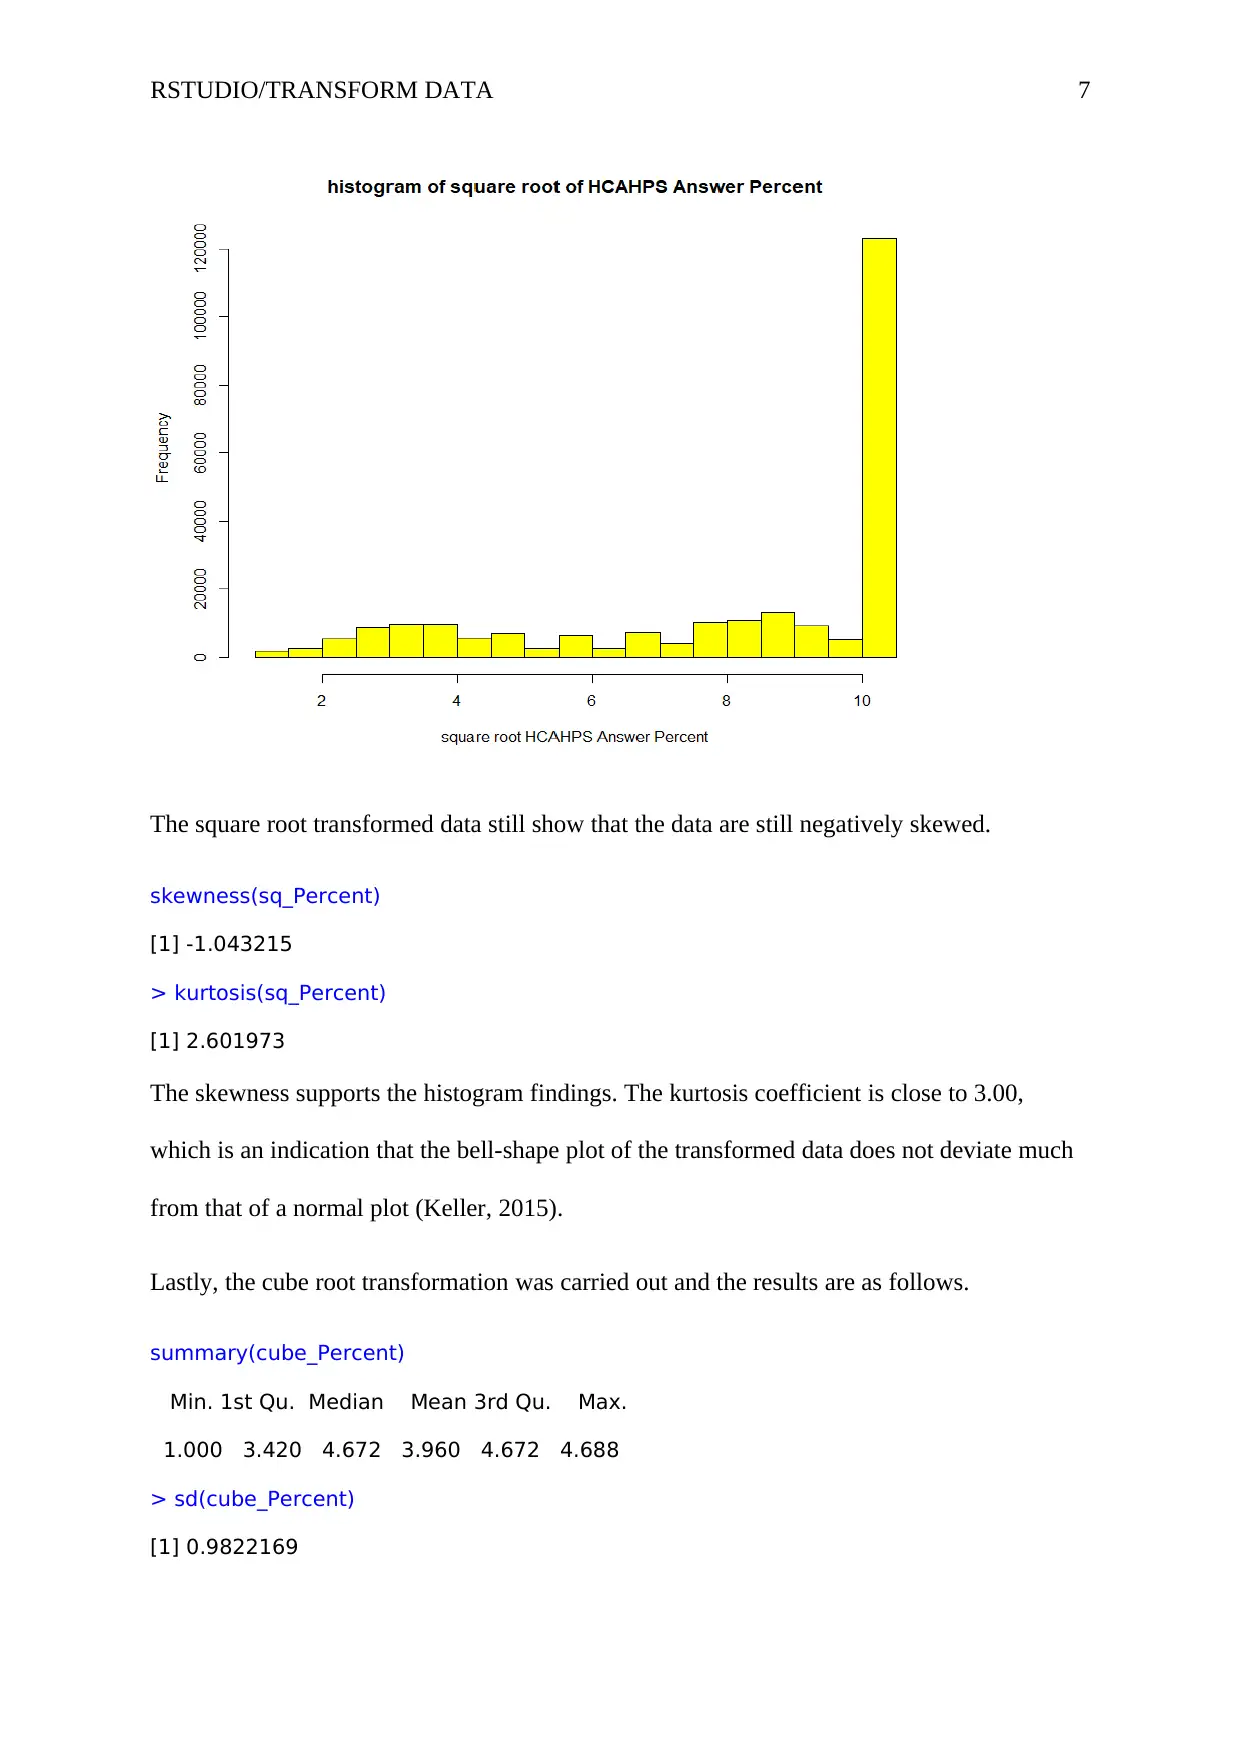
The graphical illustration of the square root transformed data is as illustrated below.
The histogram shows that the data are negatively skewed.
The second transformation, the square root transformation, was carried out and the summary
of the results is summarized below.
summary(sq_Percent)
Min. 1st Qu. Median Mean 3rd Qu. Max.
1.000 6.325 10.100 8.075 10.100 10.149
> sd(sq_Percent)
[1] 2.693831
The summary shows that on average the ratings were 8.075% (SD = 2.694) (Keller, 2015).
The middle fifty percent of the observation is between 6.325% and 10.100%. The median is
still larger than the mean.
The graphical illustration of the square root transformed data is as illustrated below.
⊘ This is a preview!⊘
Do you want full access?
Subscribe today to unlock all pages.
Trusted by 1+ million students worldwide
RSTUDIO/TRANSFORM DATA 7
The square root transformed data still show that the data are still negatively skewed.
skewness(sq_Percent)
[1] -1.043215
> kurtosis(sq_Percent)
[1] 2.601973
The skewness supports the histogram findings. The kurtosis coefficient is close to 3.00,
which is an indication that the bell-shape plot of the transformed data does not deviate much
from that of a normal plot (Keller, 2015).
Lastly, the cube root transformation was carried out and the results are as follows.
summary(cube_Percent)
Min. 1st Qu. Median Mean 3rd Qu. Max.
1.000 3.420 4.672 3.960 4.672 4.688
> sd(cube_Percent)
[1] 0.9822169
Paraphrase This Document
Need a fresh take? Get an instant paraphrase of this document with our AI Paraphraser
RSTUDIO/TRANSFORM DATA 8
The descriptive summary indicates that the average rating was 3.960 (SD = 0.9822). The
interquartile range is 1.252, whereas the range is 3.688. This shows a bit of consistency
compared to the actual data, log-transformed, and square root transformed data. This
transformation is also expected to have the least coefficient of variation (standard
deviation/mean). Hus, the cube root transformation has the largest effect on data distribution.
Part 2: Missing data
The count for the NAs in the sub-data was carried out and the results are as follows.
> sum(is.na(sub$HCAHPS.Answer.Percent))
[1] 231
The summary shows that there were in total 231 Na’s in the variable HCSHPS answer
percent in the new dataset (Chatfield, 2018). These Na’s are replaced with zero, and summary
statistics computed. The results are as follows.
summary(sub$HCAHPS.Answer.Percent)
Min. 1st Qu. Median Mean 3rd Qu. Max.
0 0 7 20 26 92
sd(sub$HCAHPS.Answer.Percent)
[1] 27.70453
The average score rating is 20% (SD = 27.7045). This rating shows that most of the patients
in Rhode Island (RI) were not satisfied with the inpatient services. The middle 50% of the
patients rated the inpatient experience between zero and 26.00%. The graphical distribution
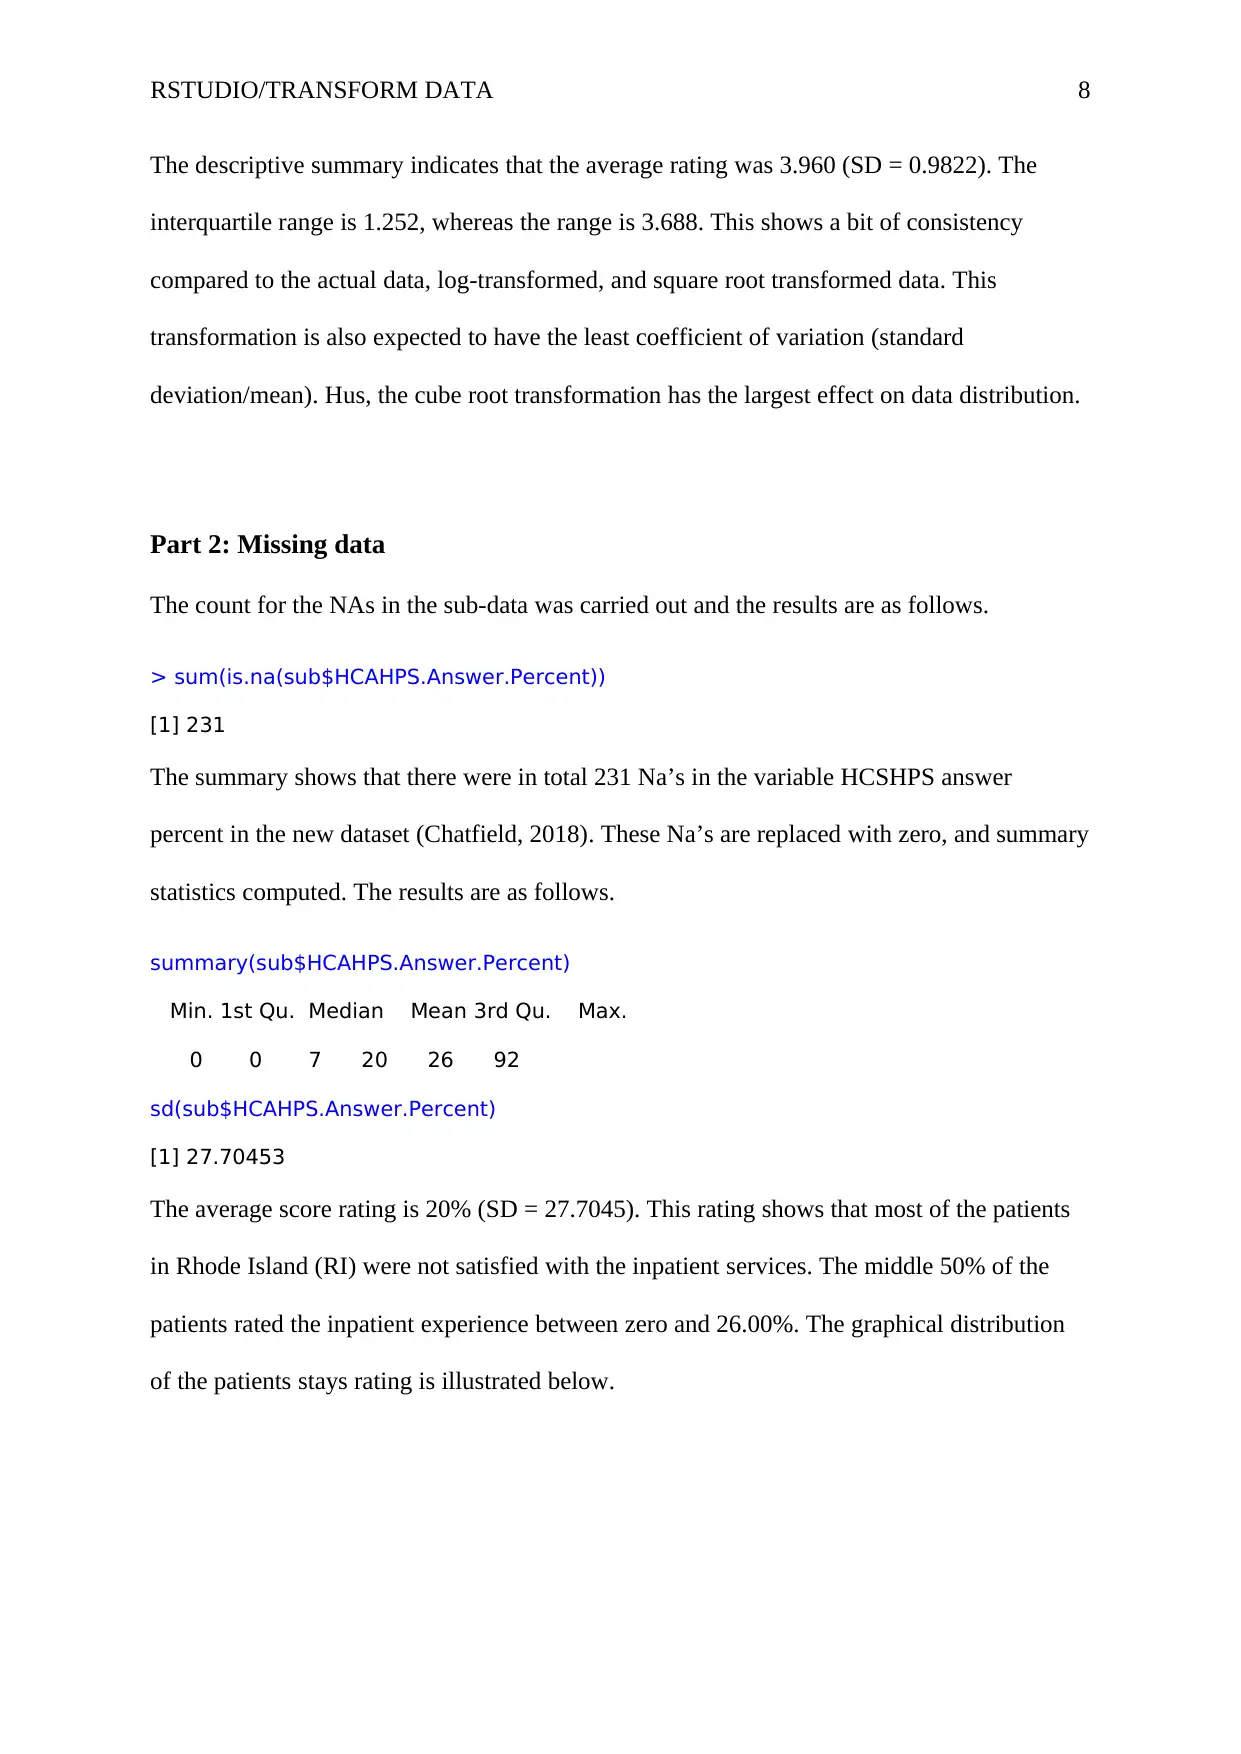
of the patients stays rating is illustrated below.
The descriptive summary indicates that the average rating was 3.960 (SD = 0.9822). The
interquartile range is 1.252, whereas the range is 3.688. This shows a bit of consistency
compared to the actual data, log-transformed, and square root transformed data. This
transformation is also expected to have the least coefficient of variation (standard
deviation/mean). Hus, the cube root transformation has the largest effect on data distribution.
Part 2: Missing data
The count for the NAs in the sub-data was carried out and the results are as follows.
> sum(is.na(sub$HCAHPS.Answer.Percent))
[1] 231
The summary shows that there were in total 231 Na’s in the variable HCSHPS answer
percent in the new dataset (Chatfield, 2018). These Na’s are replaced with zero, and summary
statistics computed. The results are as follows.
summary(sub$HCAHPS.Answer.Percent)
Min. 1st Qu. Median Mean 3rd Qu. Max.
0 0 7 20 26 92
sd(sub$HCAHPS.Answer.Percent)
[1] 27.70453
The average score rating is 20% (SD = 27.7045). This rating shows that most of the patients
in Rhode Island (RI) were not satisfied with the inpatient services. The middle 50% of the
patients rated the inpatient experience between zero and 26.00%. The graphical distribution
of the patients stays rating is illustrated below.
RSTUDIO/TRANSFORM DATA 9
As earlier suggested, most of the patients were not happy with their stay at the hospital. Also,
the plot indicates that the RI data are positively skewed (Chambers, 2017). The skewed and
kurtosis coefficient supports this finding.
skewness(sub$HCAHPS.Answer.Percent)
[1] 1.291427
> kurtosis(sub$HCAHPS.Answer.Percent)
[1] 3.190957
When the NA’s are removed when performing the analysis. The results are as follows.
summary(sub1$HCAHPS.Answer.Percent, na.rm = TRUE)
Min. 1st Qu. Median Mean 3rd Qu. Max. NA's
⊘ This is a preview!⊘
Do you want full access?
Subscribe today to unlock all pages.
Trusted by 1+ million students worldwide
RSTUDIO/TRANSFORM DATA 10
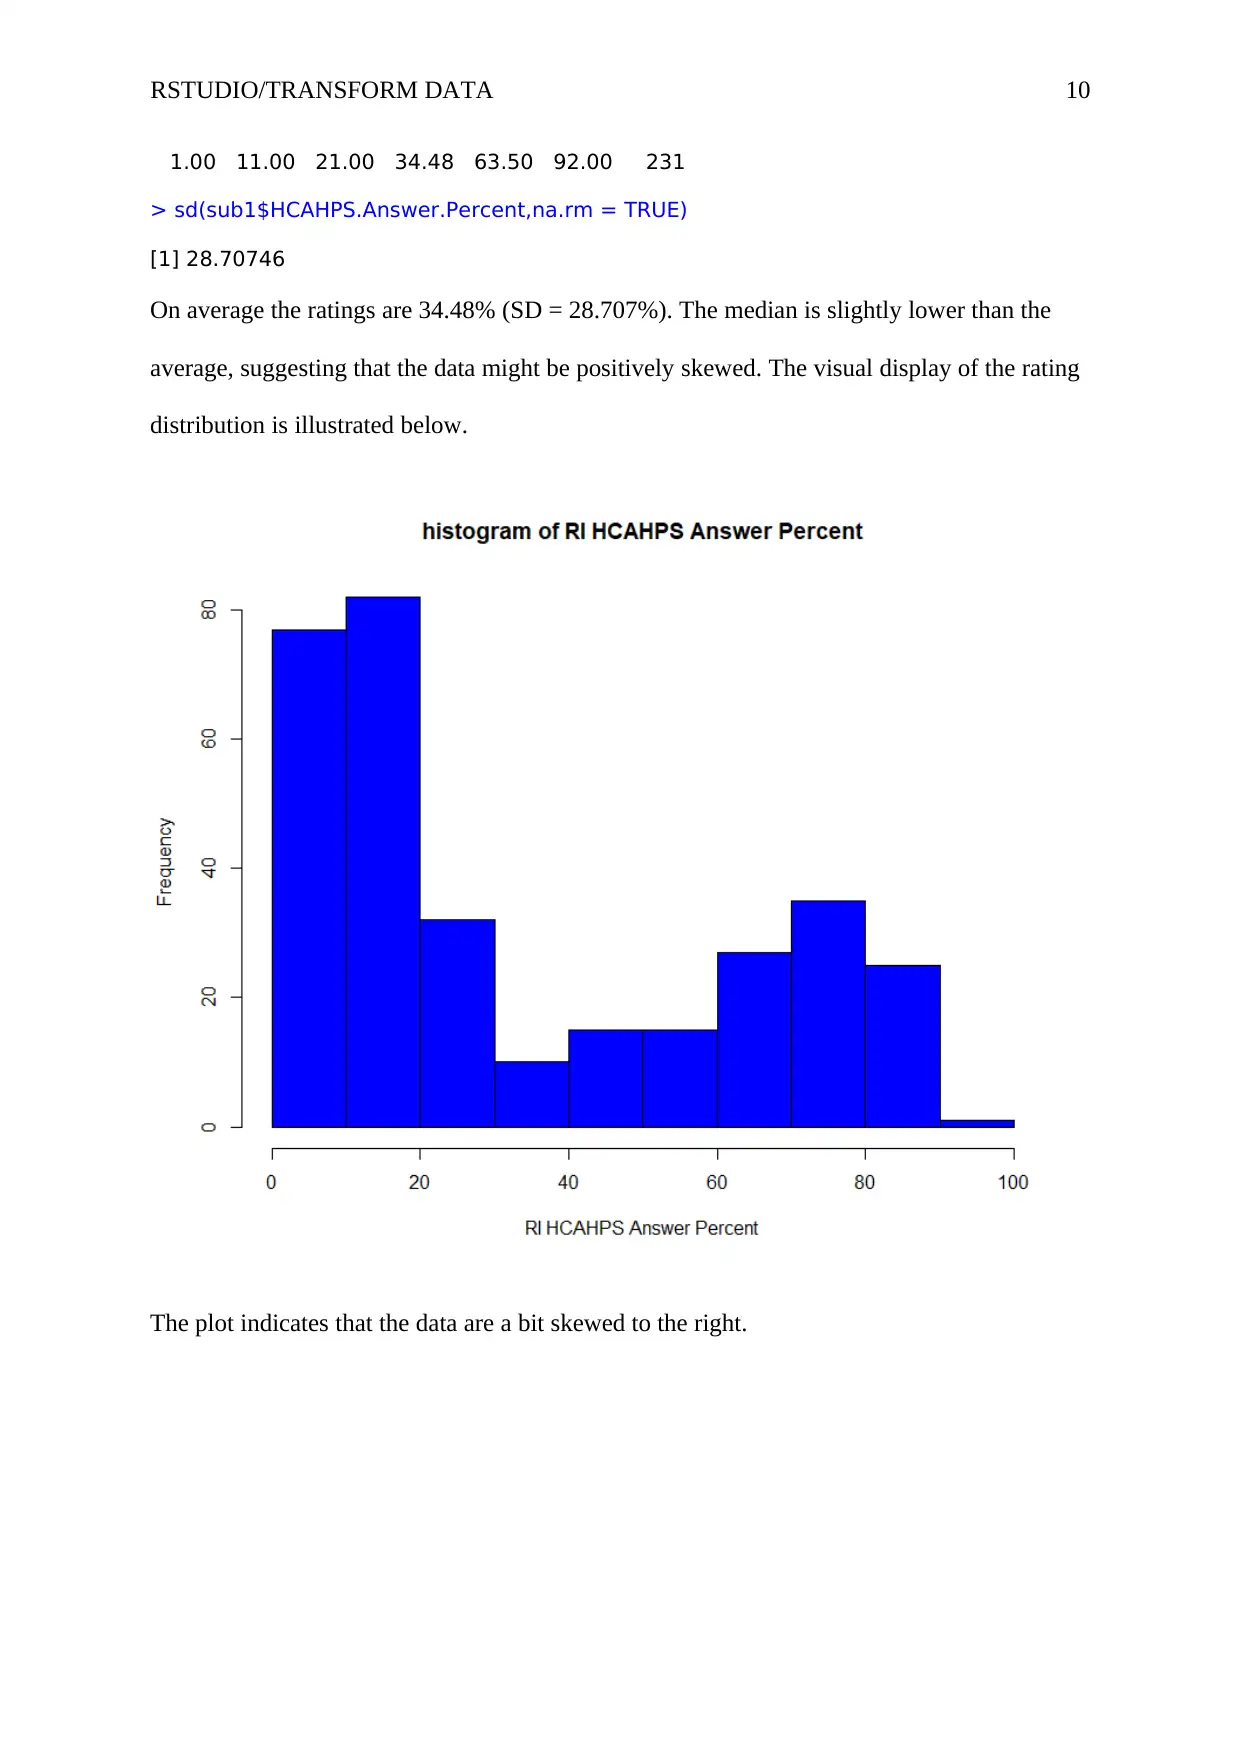
1.00 11.00 21.00 34.48 63.50 92.00 231
> sd(sub1$HCAHPS.Answer.Percent,na.rm = TRUE)
[1] 28.70746
On average the ratings are 34.48% (SD = 28.707%). The median is slightly lower than the
average, suggesting that the data might be positively skewed. The visual display of the rating
distribution is illustrated below.
The plot indicates that the data are a bit skewed to the right.
Paraphrase This Document
Need a fresh take? Get an instant paraphrase of this document with our AI Paraphraser

RSTUDIO/TRANSFORM DATA 11
RSTUDIO/TRANSFORM DATA 12
References
Chambers, J. M. (2017). Graphical Methods for Data Analysis: 0. Chapman and Hall/CRC.
Chatfield, C. (2018). Statistics for technology: a course in applied statistics (3rd Edition ed.).
New York: Routledge.
Keller, G. (2015). Statistics for Management and Economics, Abbreviated. Cengage
Learning.
Lowry, R. (2014). Concepts and applications of inferential statistics.
⊘ This is a preview!⊘
Do you want full access?
Subscribe today to unlock all pages.
Trusted by 1+ million students worldwide
1 out of 17
Your All-in-One AI-Powered Toolkit for Academic Success.
+13062052269
info@desklib.com
Available 24*7 on WhatsApp / Email
![[object Object]](/_next/static/media/star-bottom.7253800d.svg)
Unlock your academic potential
Copyright © 2020–2026 A2Z Services. All Rights Reserved. Developed and managed by ZUCOL.