Biostatistics: PUBH620 Road Traffic Accident Predictors Analysis
VerifiedAdded on 2022/11/16
|9
|2819
|72
Report
AI Summary
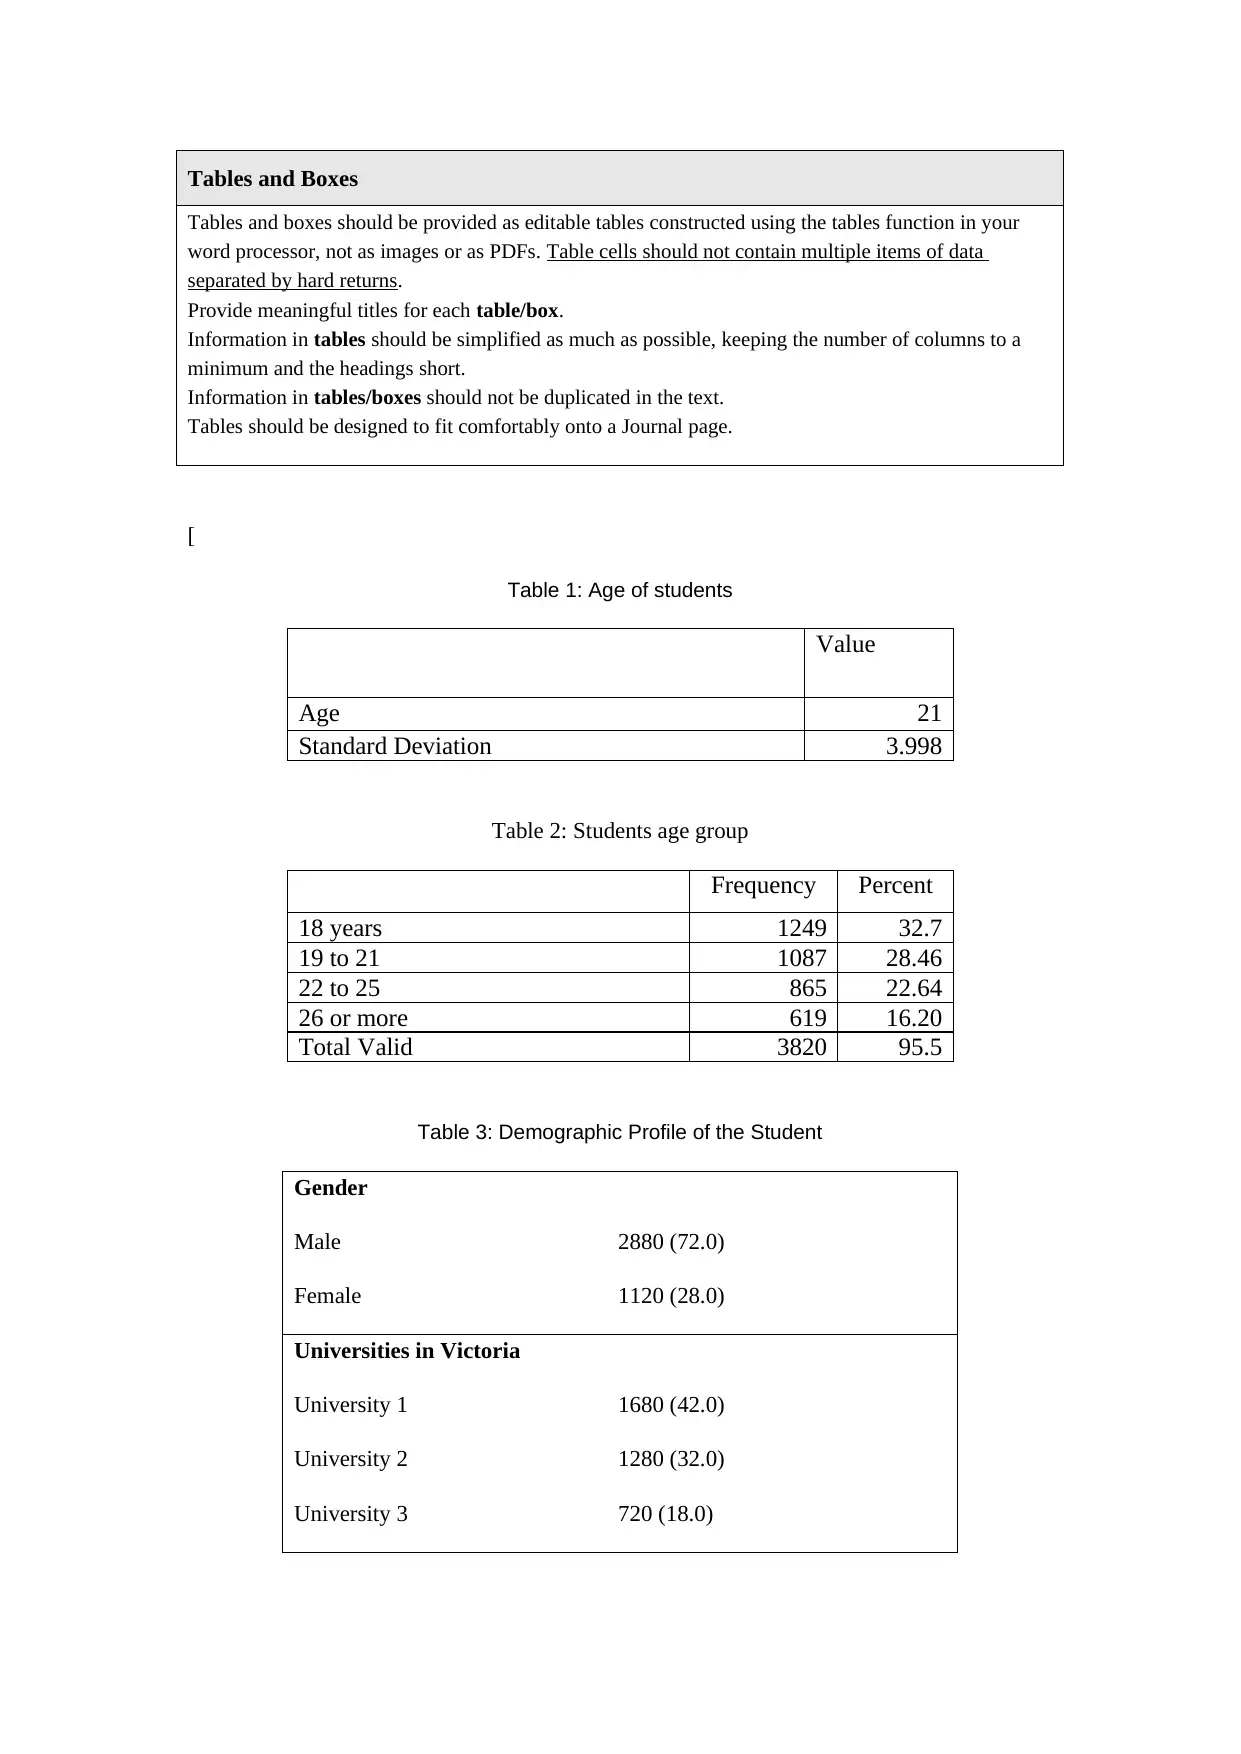
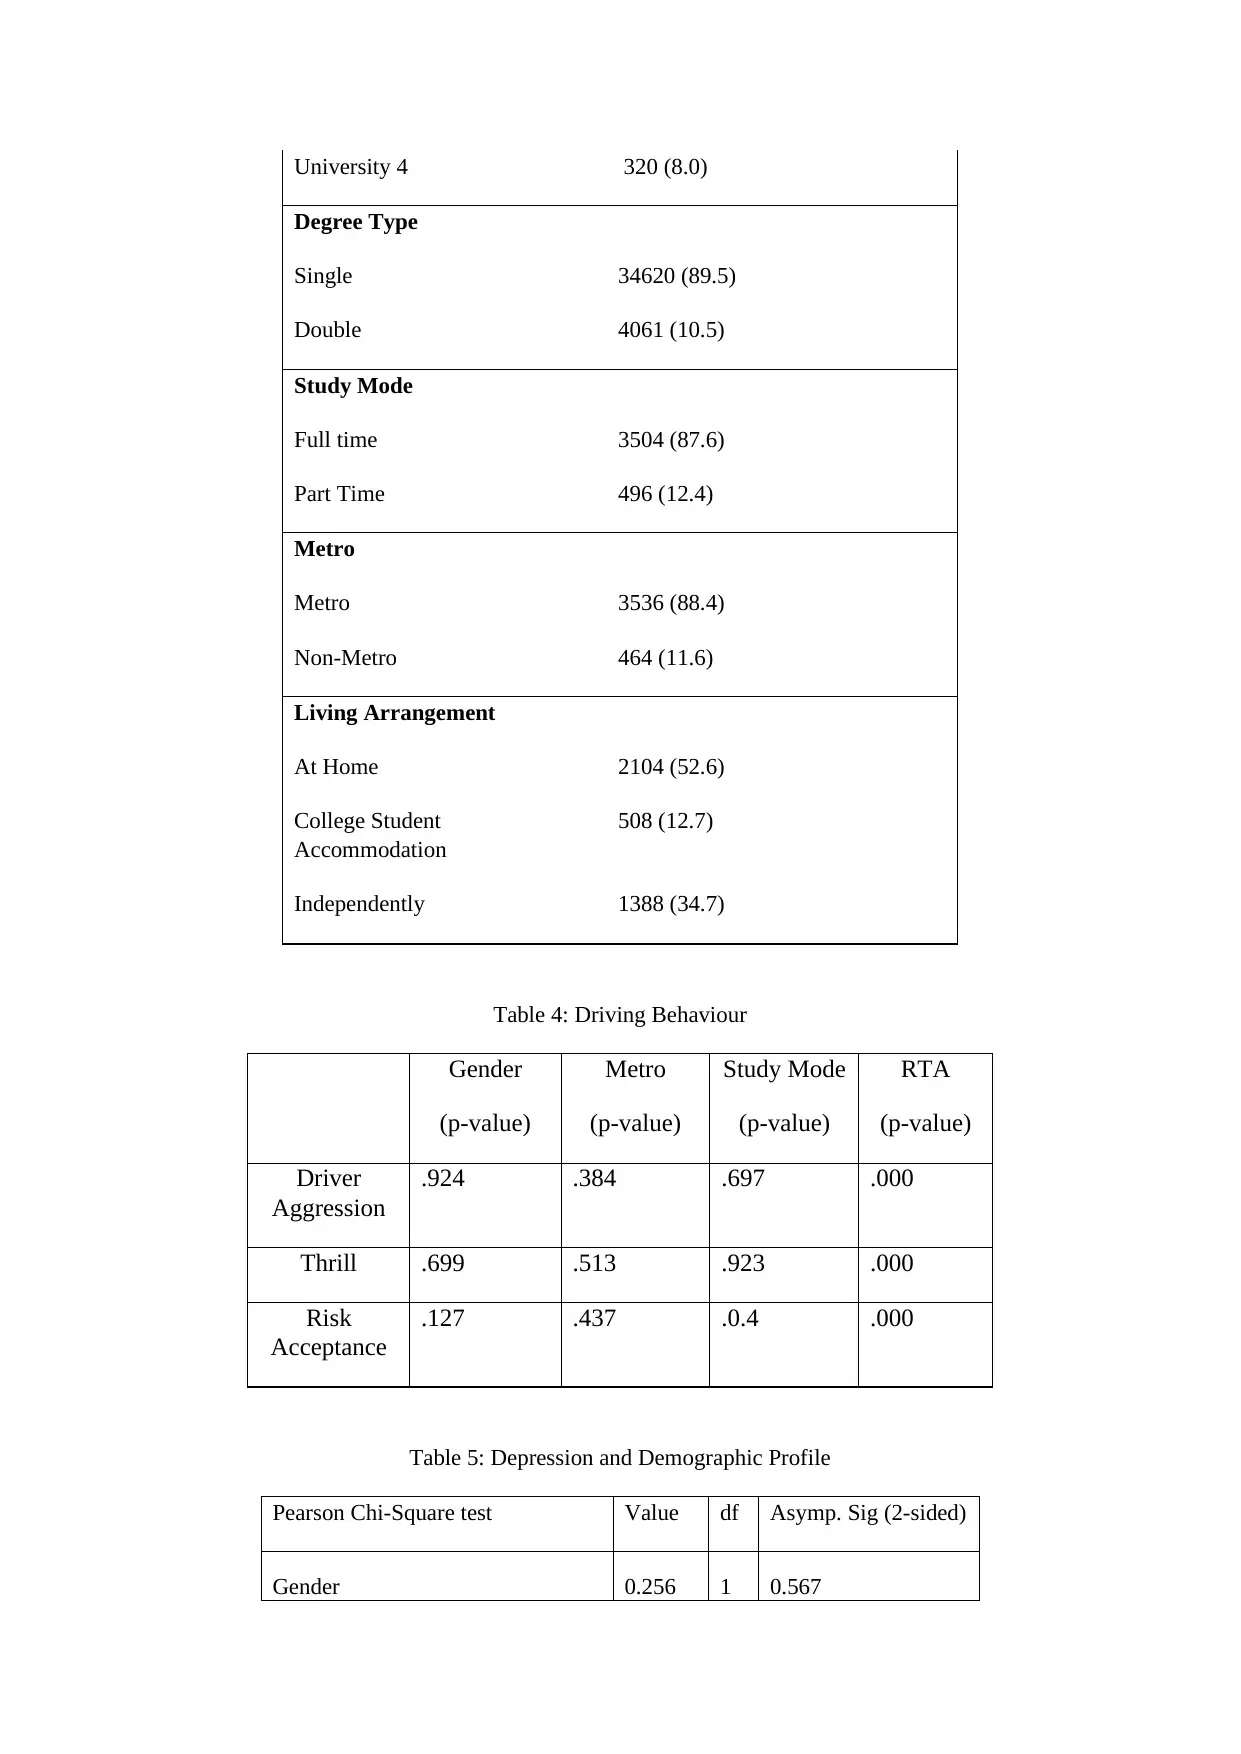
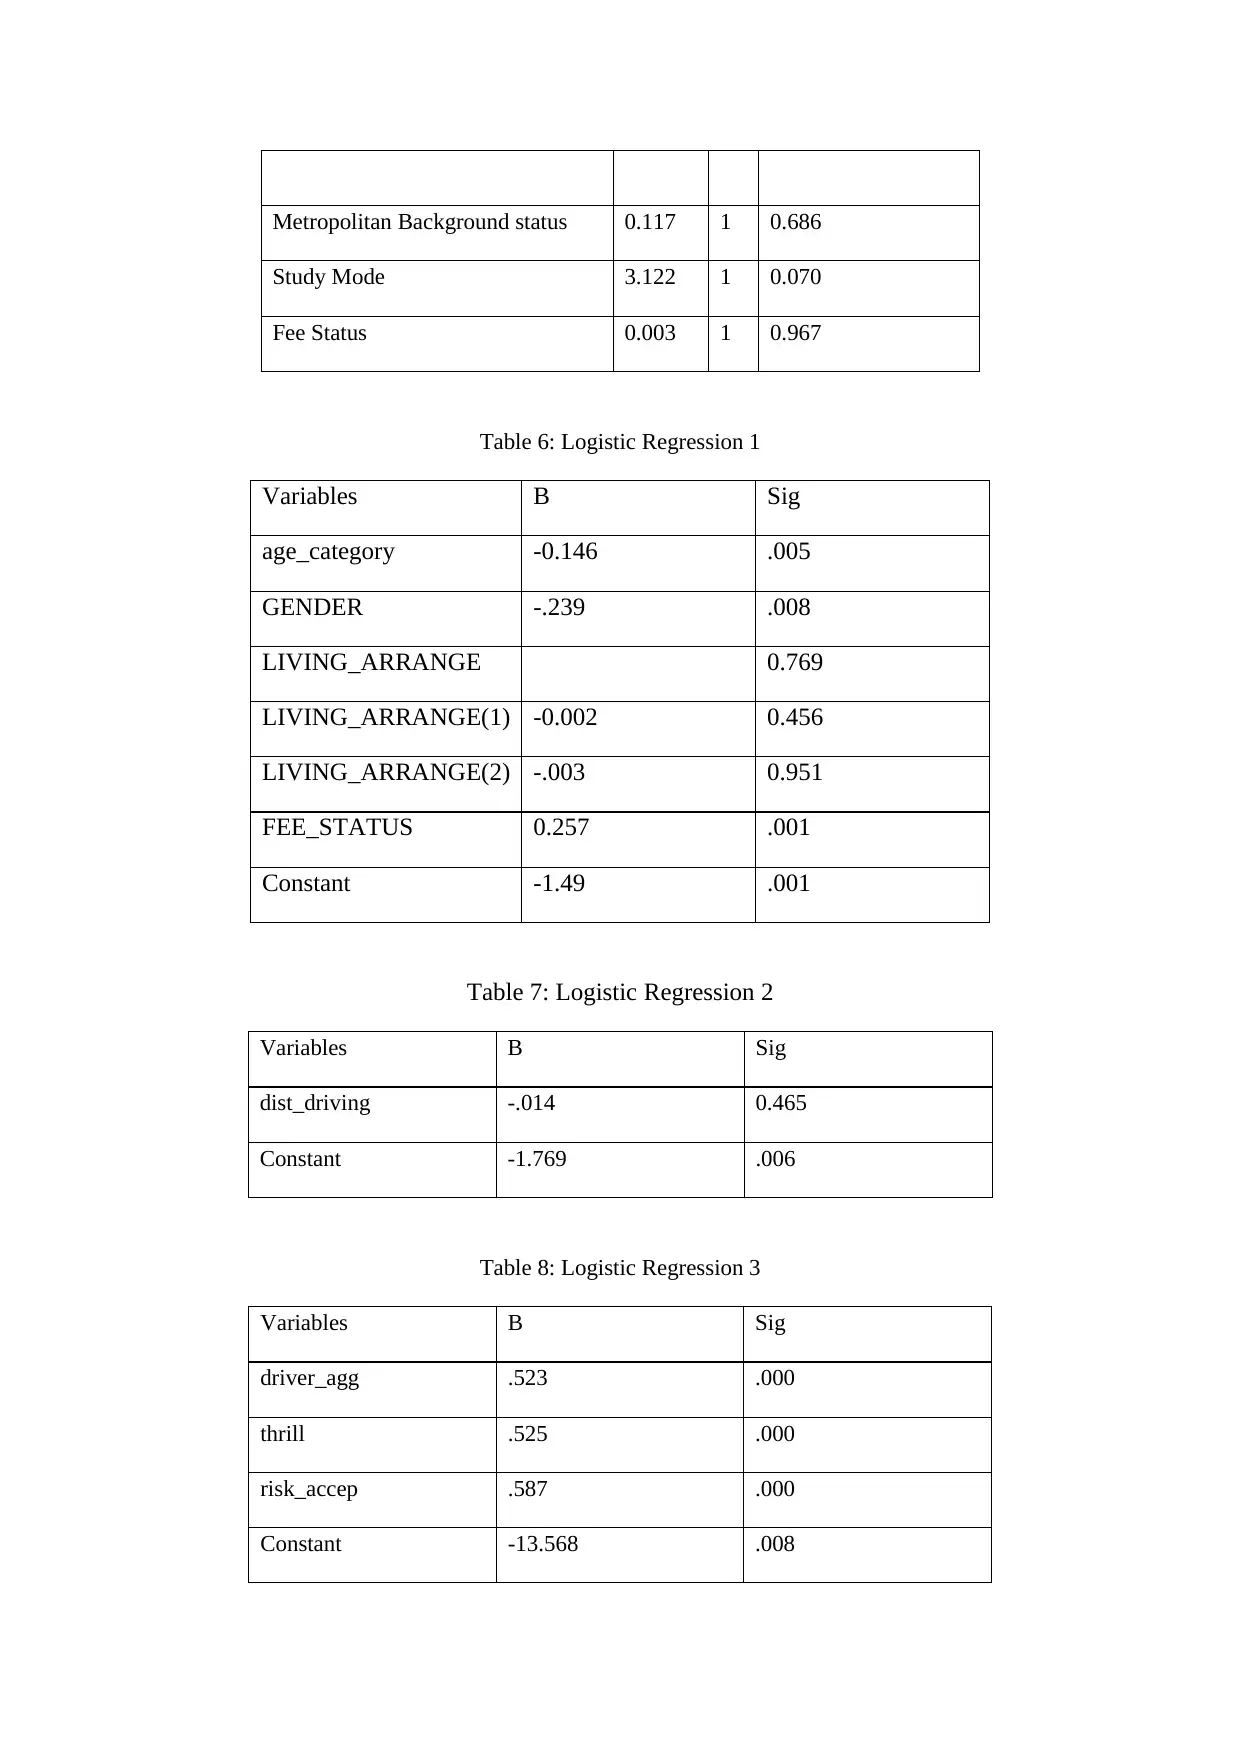
This report, prepared for the PUBH620 Biostatistics course at ACU, analyzes predictors of road traffic accidents (RTA) based on a student survey. The study investigated the influence of driver age, gender, risk-taking behavior, and other demographic factors on crash rates. The research, conducted using a longitudinal cohort study design, involved 4000 students across various universities in Victoria. Key findings include the statistically significant impact of age and gender on RTA, with younger drivers (17-29) and males exhibiting higher accident propensity. The study also examined the roles of aggression, thrill-seeking, and risk acceptance in driving behavior. The report is structured in IMRAD format, including an introduction, methods, results, and discussion, and adheres to the Medical Journal of Australia (MJA) manuscript submission guidelines. The data analysis revealed that the introduction of risk-taking behavior in logistic regression reduced the odds corresponding to male and odds corresponding to 17-29 year olds. The risk taking nature of individual across age and gender of individuals is able to explain the rise in crashes. The study's limitations include the reliance on self-reported data. The findings are presented with tables and statistical analyses, offering valuable insights into the factors contributing to road traffic accidents and providing a comprehensive analysis suitable for academic journal submission.
Contribute Materials
Your contribution can guide someone’s learning journey. Share your
documents today.

Medical Journal of Australia Manuscript submission template
Type of article
See Types of articles published by the MJA
[add article type here]
Title [add title here]
Abstract
Articles requiring a descriptive 15-word introductory line are: Perspectives, Ethics and
law, Reflection and History articles, and Editorials.
For these article types, please also supply a 100-word (maximum) abstract. Note this is not
for publication but may be used in correspondence with reviewers for the a selection of
articles see MJA Instructions for authors to identify these types of articles
Articles requiring 250-word structured abstracts are:
Research (original) (use the headings: Objectives, Design, Setting, Participants, Main
outcome measures, Results, Conclusions and Trial registration [if applicable]);
Systematic reviews and Meta-analyses (use the headings: Objective, Study design, Data
sources, , Data synthesis, Conclusions);
Guidelines etc: (use the headings: Introduction, Main recommendations and Changes in
management as result of the guideline)
Articles requiring 250-word unstructured dot-point summary are: Narrative reviews
Abstract word count [153]
[
A study was performed with a group of people who shared the related information to
analyse the impact of risk-taking behaviour on the crash rates depending on age and gender.
The sample size used in the study is 4000 and the age of individuals lies between 17 and 88
collected through random sampling across Victoria. The attributes that are covered in the
study, are driving behaviour, general-risk taking behaviour, demographic characteristics and
self-reported crashes. The individuals aged 17-29, surveyed under this study were more likely
to have an experience of accident compared to the individuals aged over 50. The introduction
of risk taking behaviour in logistic regression has reduced the odds corresponding to male and
odds corresponding to 17-29 year olds. Score of drivers’ aggression is recorded higher for
males compared to females and thus for thrill seeking and risk acceptance cases. The risk
taking nature of individual across age and gender of individuals is able to explain the rise in
crashes.
]
Secure Best Marks with AI Grader
Need help grading? Try our AI Grader for instant feedback on your assignments.

Text
Research reports should be written in IMRAD format (Introduction, Methods, Results and
Discussion).
Lessons from practice should be written using headings “Clinical record” and “Discussion”.
Text word count [1205]
[
Introduction
The studies reveal that, the involvement of male driver was in 3 crashes out of 4 in
Australia for the year 1999 and 2000 along with the young drivers aged between 17 and 25
years who were involved in every 1 accident out 5 in the year 2000 (Bates et al., 2014). On
the other hand, at the same time and the same aged female drivers were recorded only 7% of
crashes. Many of the individuals take risks and this can be proved as an significant provider to
mortality as well as morbidity. There are enough studies in social science literature which
discussed about the nature and functionality of risk taking behaviour and empirical studies on
age and gender related to the risk taking behaviour and crashes while driving (Bogstrand et
al., 2015). The important factors behind the accidents and crashes are alcohol and rash
driving. There is one more reason which is thrill to drive that is nothing but the reckless
behaviour mostly seen in the university students.
The risk taking behaviour is due to various driven vehicles and the exposure to injury
to the individuals. The car drivers think this happens due to the craziness to the behaviour of
taking risk (Svetina, 2016). As a whole, an enforcement like parental enforcement, is seen to
be maintained for the reason of that specific time and age bracket that thrives for the
excitement and thrills.
Depending on the literature, the self-reported survey has been conducted among the
university students. The major focus of study was on the traffic accidents which had occurred
in the last three years. Depending on the thrill and excitement, the estimation of traffic
accident was completed while driving including the crashes.
Methods
The number of students surveyed were 4000 who were enrolled for 3 years in a
university to examine the cause of crash and accidents on road. The students of under aged
that is below 18 years were not included in the study. The estimation method of reporting was
self-reporting on road accidents. The study was conducted across the universities of Victoria.
The survey recorded the data on nature and the characteristics of the students while driving on
the roads (Sagberg et al., 2015). The aggression that is the reason of accidents is weighed
against the thrill seeking and the risk acceptance that are other factors raising accidents. The
measurement was in the Donovan scale.

The self-reporting of accidents was the key factor in identifying the incidence of
accidents. The Donovan scale is used here to measure the behaviour of the student. The
reckless aggression of the drivers is also measured in the Donovan scale (Redshaw, 2017).
The scoring of the variables is described below:
The Aggression of drivers was measure from 0 to 12 for low level of aggression to
high level aggression.
The thrill seeking behaviour was measured from 0 to 8 for low level of thrill to high
level of thrill.
The acceptance of risk to the driver is measured from 0 to 15 for low level of risk to
high level of risk.
The study protocol was accepted by the ACU Ethical Research Committee.
Demographic Profile
The study has collected data on 4000 students from the students of Victoria. The
average age was 21 years which has standard deviation of 3.998 presented in table 1. The
table shows that 32.7% of the students belongs from the age of 18 years. The table 2 presents
the percentage and frequency of age group of the students. 28.46% students belonged from
the age group of 19 to 21 years. Table 3 presents the demographic details of students like their
gender, university, number of degrees, study mode and living arrangement. The male
respondents were 72% of the sample size and the female individuals were 28% of the sample
size. The maximum observations were from the 1st university in Victoria which is equal to
42% of the sample size. 32% of the individuals were from 2nd university in Victoria. 89.5%
of the students had single degree and 10.5% of the students had double degree. 88.4% of the
students lived in metro areas and 11.6% of the students lived in non-metro areas. 52.6% of the
students were studying from home.
Results
The nature of the driving of students like aggression, thrill and risk acceptance were
estimated across gender, metro, study mode and RTA. The table 4 presents the p-value for
their relations and most of the p-values are greater than 0.05 that indicate insignificant
relation between two variables. For the instance, the aggression of driver across the gender is
in significant with p-value equals to 0.924. Similarly, aggression across metro and study
mode is also insignificant. The insignificance is due to the p-value that is greater than 0.05.
Like, aggression, thrill and risk acceptance were also insignificant across gender, metro and
study mode. Like, thrill across gender is in significant with p-value equals to 0.699. Risk
acceptance across gender is in significant with p-value equals to 0.127. However, the RTA
and driving nature and behavioural act is statistically significant at 5% significance level as
the p-value is less than 0.05.
The table 5 presents the depression and demographic profile which shows that the
depression across gender, metropolitan and fee status is insignificant at 5% significance level
as the p-value is greater than 0.05. The p-associated p-values with gender, metropolitan
background status, and study mode and fee status are 0.567, 0.686, 0.07 and 0.967
respectively.

The analysis used the demographic profile to predict and analyse the crashes and
accidents on road. The analysis result presented in table 6 shows that the age category is
statistically significant at 5% significance level with p-value 0.005. The gender is statistically
significant at 5% significance level with p-value 0.008. The fee status is statistically
significant at 5% significance level with p-value 0.001. A rise in gender and age reduces the
propensity of crash and accident significantly it is confirmed by the negative coefficient of the
variables. The fee status increases the propensity of an accident with a rise in fee as the
coefficient is positive and it is significant at 5% significance level. Table 7 shows that the
drivers who drive 10 km or more are less likely to be a victim of accident.
The table 8 presents the significant influence of driver age, thrill and risk acceptance
on RTA. The slope coefficient of driver age is 0.523 with p-value 0.00 which indicates 5%
statistical significance level. The slope coefficient of thrill is 0.525 with p-value 0.00 which
indicates 5% statistical significance level. The slope coefficient of risk acceptance is 0.587
with p-value 0.00 which indicates 5% statistical significance level. The risk acceptance is
found to have more influence on the RTA.
Discussion
The study reveals about the relation between the risk acceptance, thrill, driver age,
gender, driving a significant distance regularly, fee status and living arrange.
The previous studies found that there is a significant negative relation between age
and propensity of RTA (Caird et al., 2014). This is found that the variables like aggression,
risk acceptance and thrill seeking attitude strongly influence thee road traffic accidents (RTA)
(Zhang & Chan, 2016).
Self reported nature of collecting samples is the major limitation of the study.
]
Secure Best Marks with AI Grader
Need help grading? Try our AI Grader for instant feedback on your assignments.

References
References should be in APA6 and should not appear as endnotes.
References to material on the Internet should include the organisation, the page title, the article title and
the author (if there is one) as well as the URL and the date page was visited.
[
Reference
Bates, L. J., Davey, J., Watson, B., King, M. J., & Armstrong, K. (2014). Factors contributing
to crashes among young drivers. Sultan Qaboos university medical journal, 14(3), e297.
Bogstrand, S. T., Larsson, M., Holtan, A., Staff, T., Vindenes, V., & Gjerde, H. (2015).
Associations between driving under the influence of alcohol or drugs, speeding and seatbelt
use among fatally injured car drivers in Norway. Accident Analysis & Prevention, 78, 14-19.
Caird, J. K., Johnston, K. A., Willness, C. R., Asbridge, M., & Steel, P. (2014). A meta-
analysis of the effects of texting on driving. Accident Analysis & Prevention, 71, 311-318.
Redshaw, S. (2017). In the company of cars: Driving as a social and cultural practice. CRC
Press.
Sagberg, F., Selpi, Bianchi Piccinini, G. F., & Engström, J. (2015). A review of research on
driving styles and road safety. Human factors, 57(7), 1248-1275.
Svetina, M. (2016). The reaction times of drivers aged 20 to 80 during a divided attention
driving. Traffic injury prevention, 17(8), 810-814.
Weiss, H. B., Kaplan, S., & Prato, C. G. (2014). Analysis of factors associated with injury
severity in crashes involving young New Zealand drivers. Accident Analysis &
Prevention, 65, 142-155.
Zhang, T., & Chan, A. H. (2016). The association between driving anger and driving
outcomes: A meta-analysis of evidence from the past twenty years. Accident Analysis &
Prevention, 90, 50-62.
]

Tables and Boxes
Tables and boxes should be provided as editable tables constructed using the tables function in your
word processor, not as images or as PDFs. Table cells should not contain multiple items of data
separated by hard returns.
Provide meaningful titles for each table/box.
Information in tables should be simplified as much as possible, keeping the number of columns to a
minimum and the headings short.
Information in tables/boxes should not be duplicated in the text.
Tables should be designed to fit comfortably onto a Journal page.
[
Table 1: Age of students
Value
Age 21
Standard Deviation 3.998
Table 2: Students age group
Frequency Percent
18 years 1249 32.7
19 to 21 1087 28.46
22 to 25 865 22.64
26 or more 619 16.20
Total Valid 3820 95.5
Table 3: Demographic Profile of the Student
Gender
Male 2880 (72.0)
Female 1120 (28.0)
Universities in Victoria
University 1
University 2
University 3
1680 (42.0)
1280 (32.0)
720 (18.0)

University 4 320 (8.0)
Degree Type
Single
Double
34620 (89.5)
4061 (10.5)
Study Mode
Full time
Part Time
3504 (87.6)
496 (12.4)
Metro
Metro
Non-Metro
3536 (88.4)
464 (11.6)
Living Arrangement
At Home 2104 (52.6)
College Student
Accommodation
508 (12.7)
Independently 1388 (34.7)
Table 4: Driving Behaviour
Gender
(p-value)
Metro
(p-value)
Study Mode
(p-value)
RTA
(p-value)
Driver
Aggression
.924 .384 .697 .000
Thrill .699 .513 .923 .000
Risk
Acceptance
.127 .437 .0.4 .000
Table 5: Depression and Demographic Profile
Pearson Chi-Square test Value df Asymp. Sig (2-sided)
Gender 0.256 1 0.567
Paraphrase This Document
Need a fresh take? Get an instant paraphrase of this document with our AI Paraphraser

Metropolitan Background status 0.117 1 0.686
Study Mode 3.122 1 0.070
Fee Status 0.003 1 0.967
Table 6: Logistic Regression 1
Variables B Sig
age_category -0.146 .005
GENDER -.239 .008
LIVING_ARRANGE 0.769
LIVING_ARRANGE(1) -0.002 0.456
LIVING_ARRANGE(2) -.003 0.951
FEE_STATUS 0.257 .001
Constant -1.49 .001
Table 7: Logistic Regression 2
Variables B Sig
dist_driving -.014 0.465
Constant -1.769 .006
Table 8: Logistic Regression 3
Variables B Sig
driver_agg .523 .000
thrill .525 .000
risk_accep .587 .000
Constant -13.568 .008

]
1 out of 9
Related Documents

Your All-in-One AI-Powered Toolkit for Academic Success.
+13062052269
info@desklib.com
Available 24*7 on WhatsApp / Email
Unlock your academic potential
© 2024 | Zucol Services PVT LTD | All rights reserved.