Runway Incursion Avoidance Research: FAA Technology Evaluation
VerifiedAdded on 2020/04/21
|13
|3317
|54
Report
AI Summary
This report investigates the effectiveness of current technologies, such as ASDE-X, FAROS, and RWSL, in reducing runway incursions. The research analyzes data from the FAA, NTSB, and NASA databases between 2013 and 2015, focusing on the impact of these technologies at various airports. The study employs quantitative data analysis, including graphical representations and comparisons across different airports, to determine the correlation between passenger traffic, technology implementation, and the frequency of runway incursions. The findings reveal that despite the implementation of these technologies, the number of runway incursions has continued to increase, suggesting that the technologies are not performing as expected in reducing the number of incursions. The report also addresses potential biases in data collection and analysis, aiming for an unbiased assessment of technology effectiveness.

RUNWAY INCURSION AVOIDANCE 1
Name:
Registration:
Course:
Professor:
Date:
Name:
Registration:
Course:
Professor:
Date:
Paraphrase This Document
Need a fresh take? Get an instant paraphrase of this document with our AI Paraphraser
RUNWAY INCURSION AVOIDANCE 2
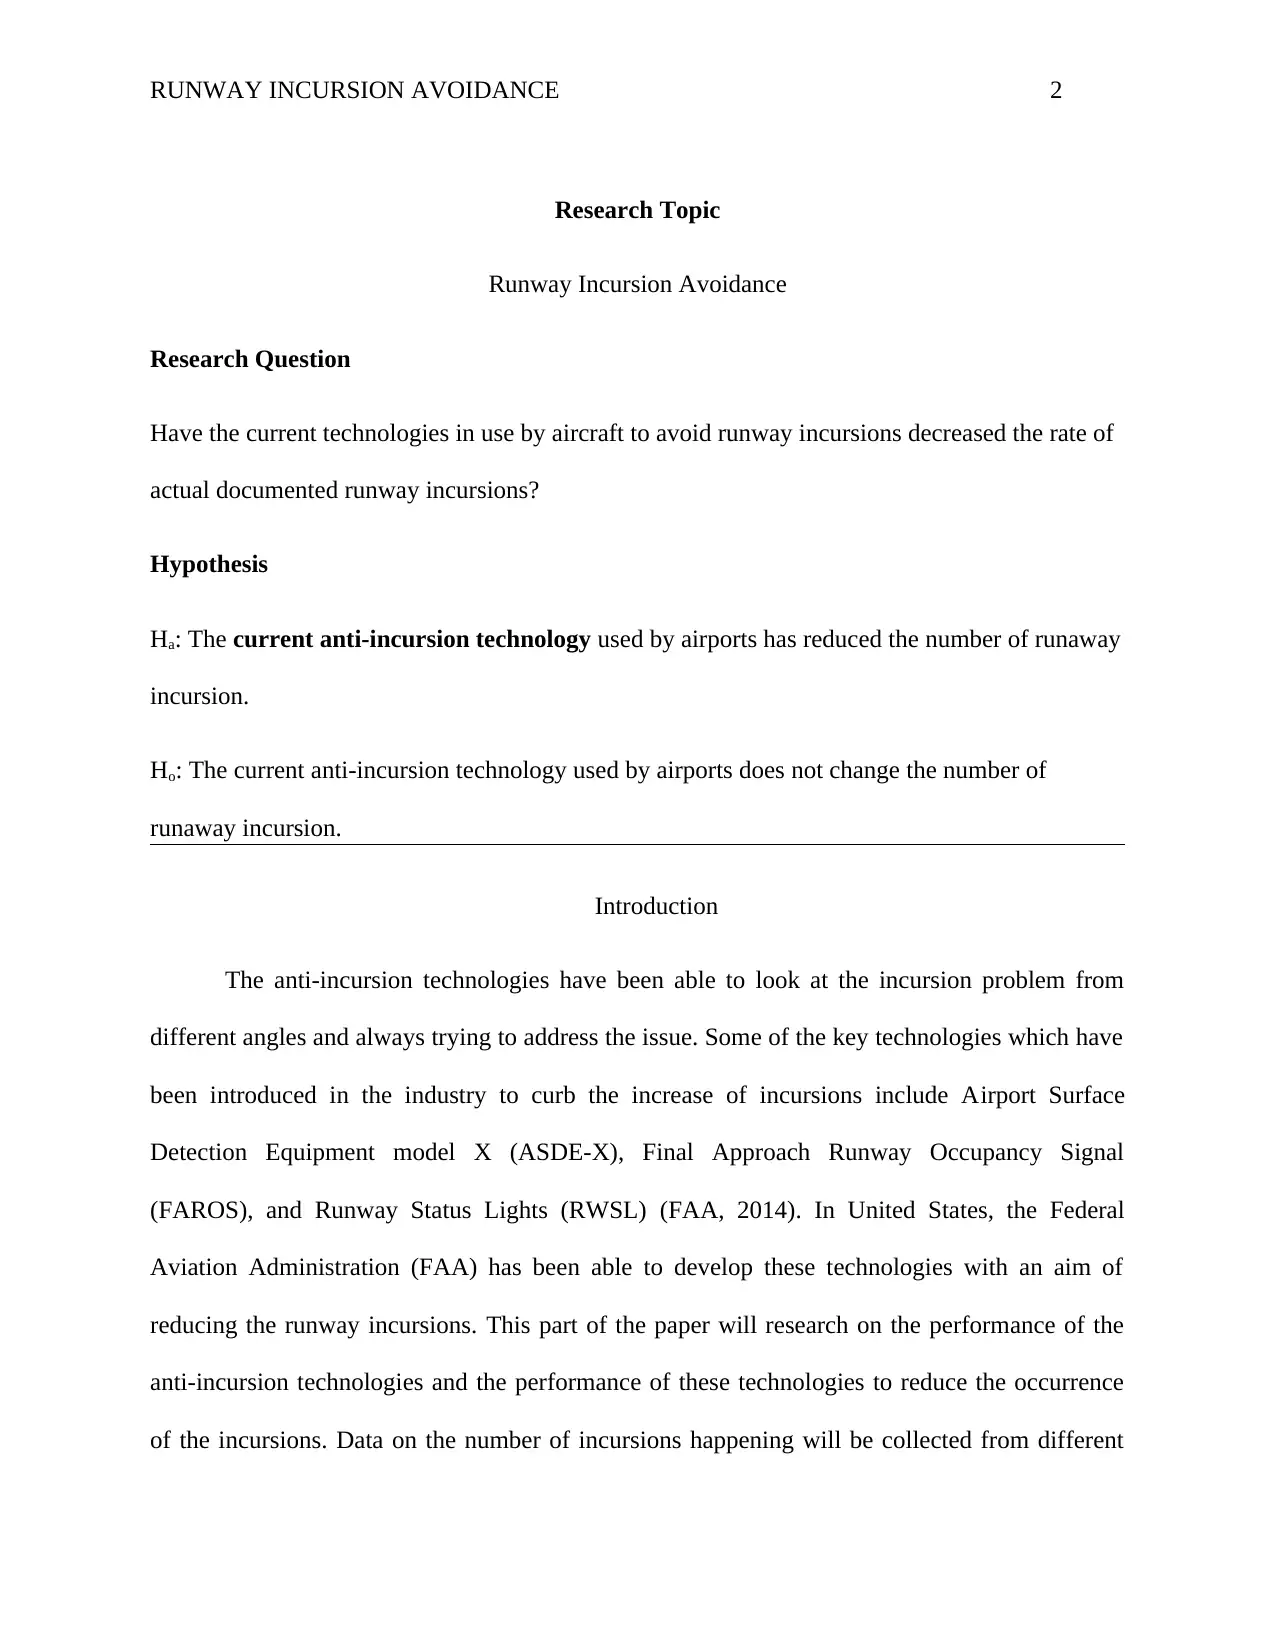
Research Topic
Runway Incursion Avoidance
Research Question
Have the current technologies in use by aircraft to avoid runway incursions decreased the rate of
actual documented runway incursions?
Hypothesis
Ha: The current anti-incursion technology used by airports has reduced the number of runaway
incursion.
Ho: The current anti-incursion technology used by airports does not change the number of
runaway incursion.
Introduction
The anti-incursion technologies have been able to look at the incursion problem from
different angles and always trying to address the issue. Some of the key technologies which have
been introduced in the industry to curb the increase of incursions include Airport Surface
Detection Equipment model X (ASDE-X), Final Approach Runway Occupancy Signal
(FAROS), and Runway Status Lights (RWSL) (FAA, 2014). In United States, the Federal
Aviation Administration (FAA) has been able to develop these technologies with an aim of
reducing the runway incursions. This part of the paper will research on the performance of the
anti-incursion technologies and the performance of these technologies to reduce the occurrence
of the incursions. Data on the number of incursions happening will be collected from different
RUNWAY INCURSION AVOIDANCE 3
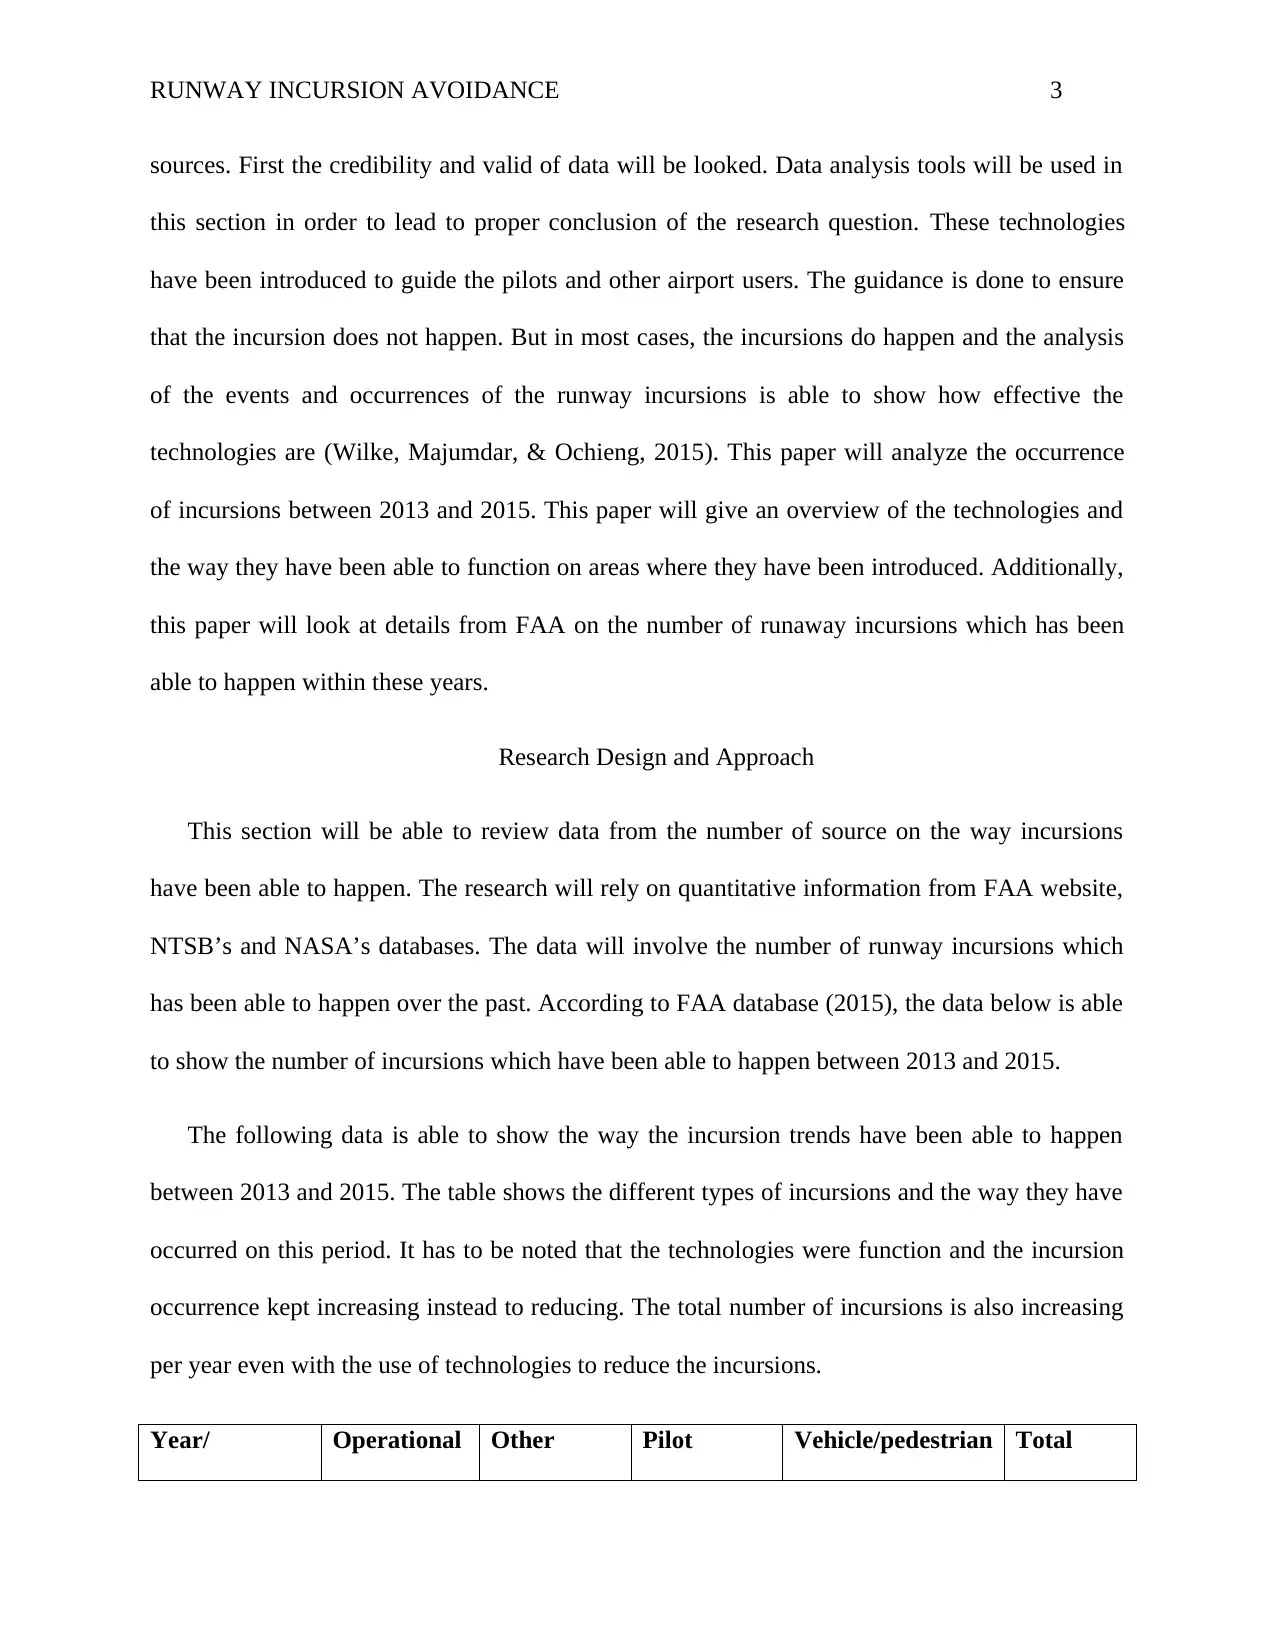
sources. First the credibility and valid of data will be looked. Data analysis tools will be used in
this section in order to lead to proper conclusion of the research question. These technologies
have been introduced to guide the pilots and other airport users. The guidance is done to ensure
that the incursion does not happen. But in most cases, the incursions do happen and the analysis
of the events and occurrences of the runway incursions is able to show how effective the
technologies are (Wilke, Majumdar, & Ochieng, 2015). This paper will analyze the occurrence
of incursions between 2013 and 2015. This paper will give an overview of the technologies and
the way they have been able to function on areas where they have been introduced. Additionally,
this paper will look at details from FAA on the number of runaway incursions which has been
able to happen within these years.
Research Design and Approach
This section will be able to review data from the number of source on the way incursions
have been able to happen. The research will rely on quantitative information from FAA website,
NTSB’s and NASA’s databases. The data will involve the number of runway incursions which
has been able to happen over the past. According to FAA database (2015), the data below is able
to show the number of incursions which have been able to happen between 2013 and 2015.
The following data is able to show the way the incursion trends have been able to happen
between 2013 and 2015. The table shows the different types of incursions and the way they have
occurred on this period. It has to be noted that the technologies were function and the incursion
occurrence kept increasing instead to reducing. The total number of incursions is also increasing
per year even with the use of technologies to reduce the incursions.
Year/ Operational Other Pilot Vehicle/pedestrian Total
⊘ This is a preview!⊘
Do you want full access?
Subscribe today to unlock all pages.
Trusted by 1+ million students worldwide
RUNWAY INCURSION AVOIDANCE 4
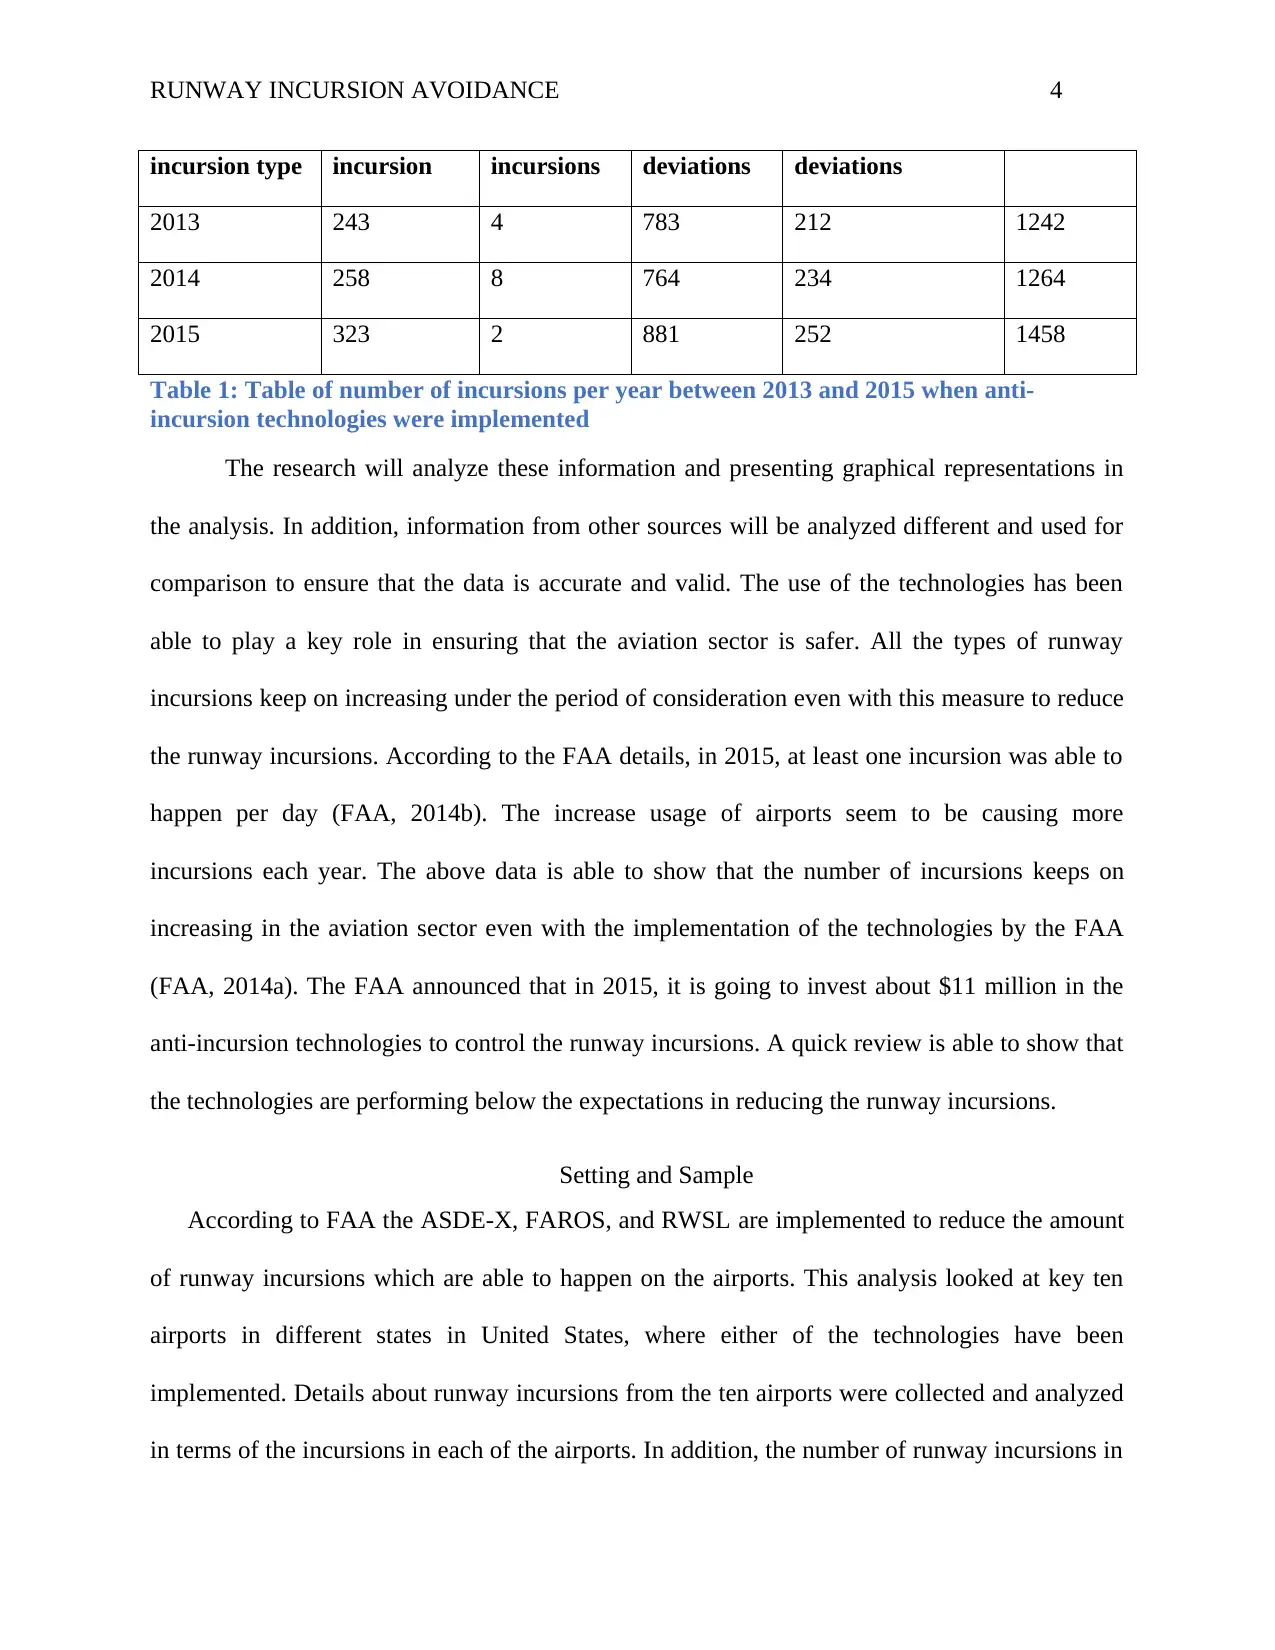
incursion type incursion incursions deviations deviations
2013 243 4 783 212 1242
2014 258 8 764 234 1264
2015 323 2 881 252 1458
Table 1: Table of number of incursions per year between 2013 and 2015 when anti-
incursion technologies were implemented
The research will analyze these information and presenting graphical representations in
the analysis. In addition, information from other sources will be analyzed different and used for
comparison to ensure that the data is accurate and valid. The use of the technologies has been
able to play a key role in ensuring that the aviation sector is safer. All the types of runway
incursions keep on increasing under the period of consideration even with this measure to reduce
the runway incursions. According to the FAA details, in 2015, at least one incursion was able to
happen per day (FAA, 2014b). The increase usage of airports seem to be causing more
incursions each year. The above data is able to show that the number of incursions keeps on
increasing in the aviation sector even with the implementation of the technologies by the FAA
(FAA, 2014a). The FAA announced that in 2015, it is going to invest about $11 million in the
anti-incursion technologies to control the runway incursions. A quick review is able to show that
the technologies are performing below the expectations in reducing the runway incursions.
Setting and Sample
According to FAA the ASDE-X, FAROS, and RWSL are implemented to reduce the amount
of runway incursions which are able to happen on the airports. This analysis looked at key ten
airports in different states in United States, where either of the technologies have been
implemented. Details about runway incursions from the ten airports were collected and analyzed
in terms of the incursions in each of the airports. In addition, the number of runway incursions in
Paraphrase This Document
Need a fresh take? Get an instant paraphrase of this document with our AI Paraphraser
RUNWAY INCURSION AVOIDANCE 5
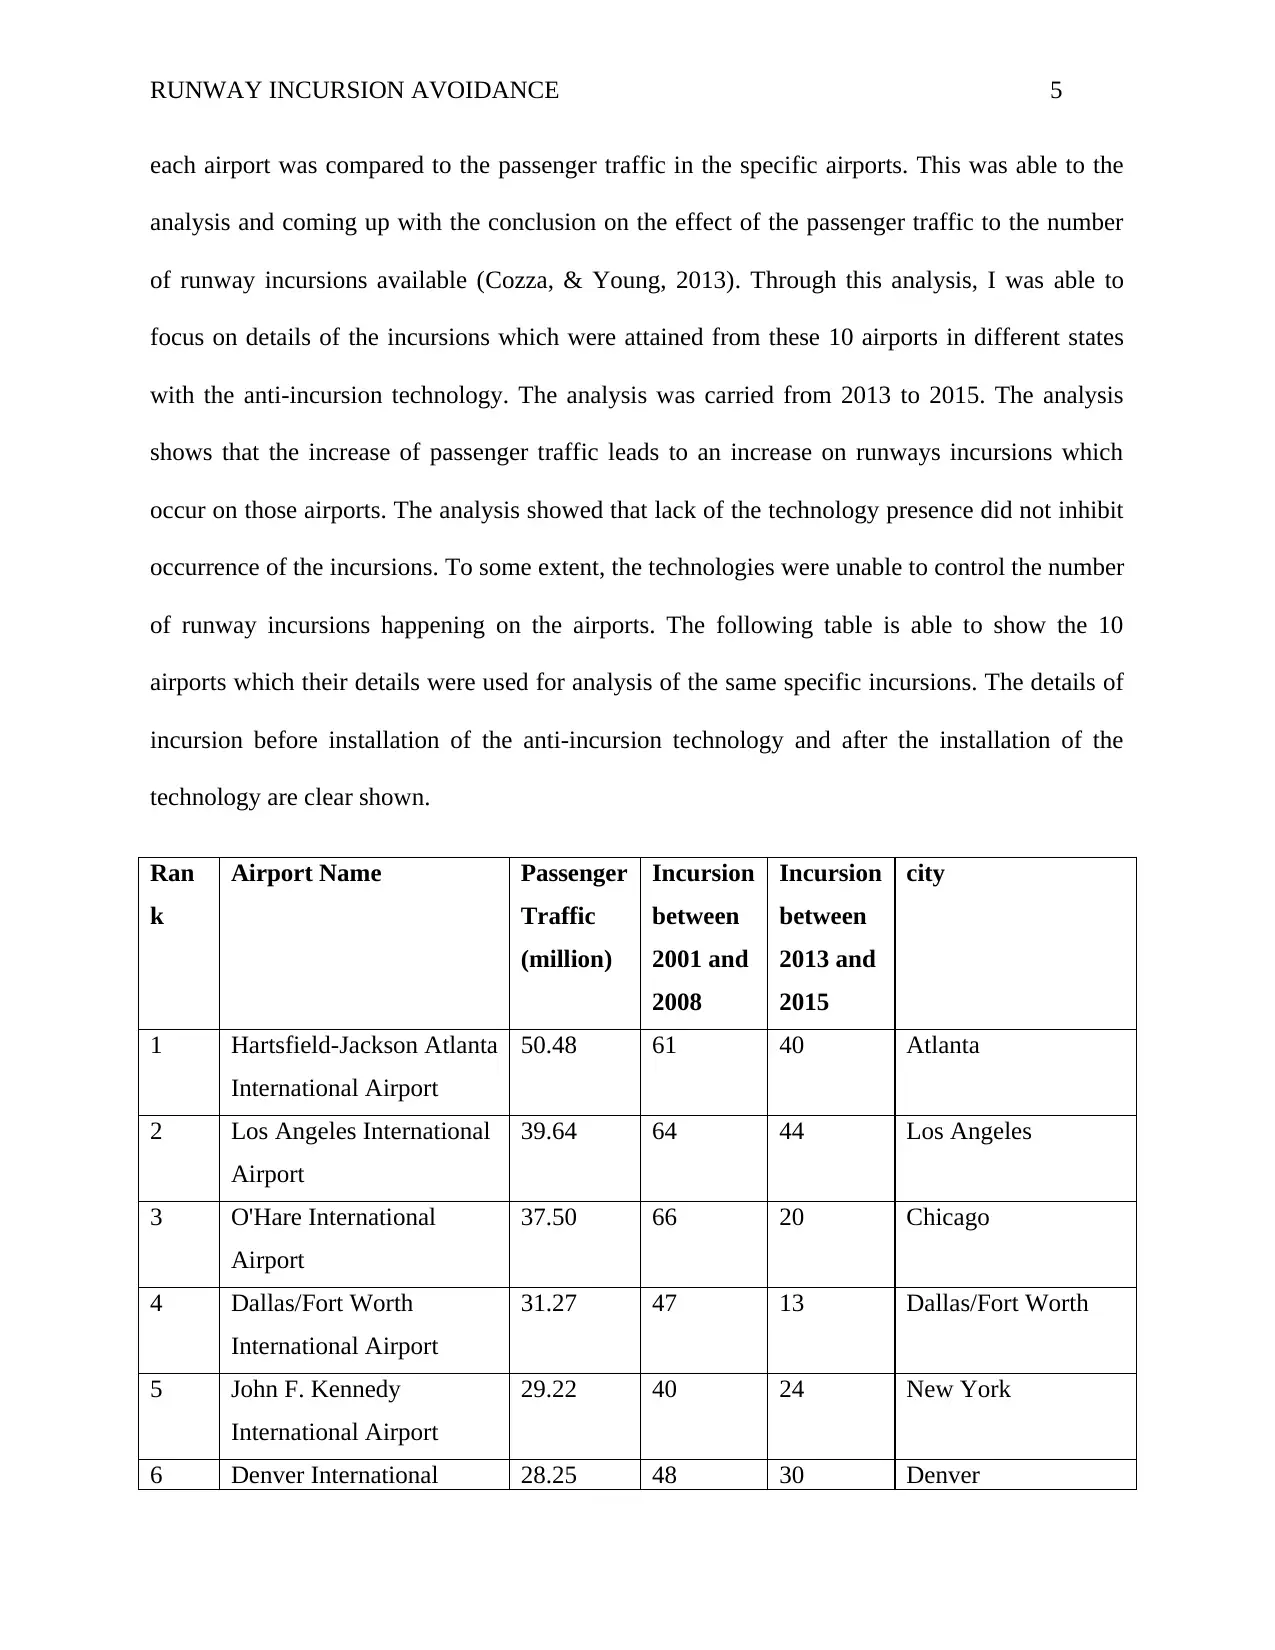
each airport was compared to the passenger traffic in the specific airports. This was able to the
analysis and coming up with the conclusion on the effect of the passenger traffic to the number
of runway incursions available (Cozza, & Young, 2013). Through this analysis, I was able to
focus on details of the incursions which were attained from these 10 airports in different states
with the anti-incursion technology. The analysis was carried from 2013 to 2015. The analysis
shows that the increase of passenger traffic leads to an increase on runways incursions which
occur on those airports. The analysis showed that lack of the technology presence did not inhibit
occurrence of the incursions. To some extent, the technologies were unable to control the number
of runway incursions happening on the airports. The following table is able to show the 10
airports which their details were used for analysis of the same specific incursions. The details of
incursion before installation of the anti-incursion technology and after the installation of the
technology are clear shown.
Ran
k
Airport Name Passenger
Traffic
(million)
Incursion
between
2001 and
2008
Incursion
between
2013 and
2015
city
1 Hartsfield-Jackson Atlanta
International Airport
50.48 61 40 Atlanta
2 Los Angeles International
Airport
39.64 64 44 Los Angeles
3 O'Hare International
Airport
37.50 66 20 Chicago
4 Dallas/Fort Worth
International Airport
31.27 47 13 Dallas/Fort Worth
5 John F. Kennedy
International Airport
29.22 40 24 New York
6 Denver International 28.25 48 30 Denver
RUNWAY INCURSION AVOIDANCE 6
Airport
7 San Francisco
International Airport
25.71 36 19 San Francisco
8 McCarran International
Airport
22.67 39 21 Las Vegas
9 Charlotte Douglas
International Airport
21.96 31 19 Charlotte
10 Seattle–Tacoma
International Airport
21.89 45 26 Seattle/Tacoma
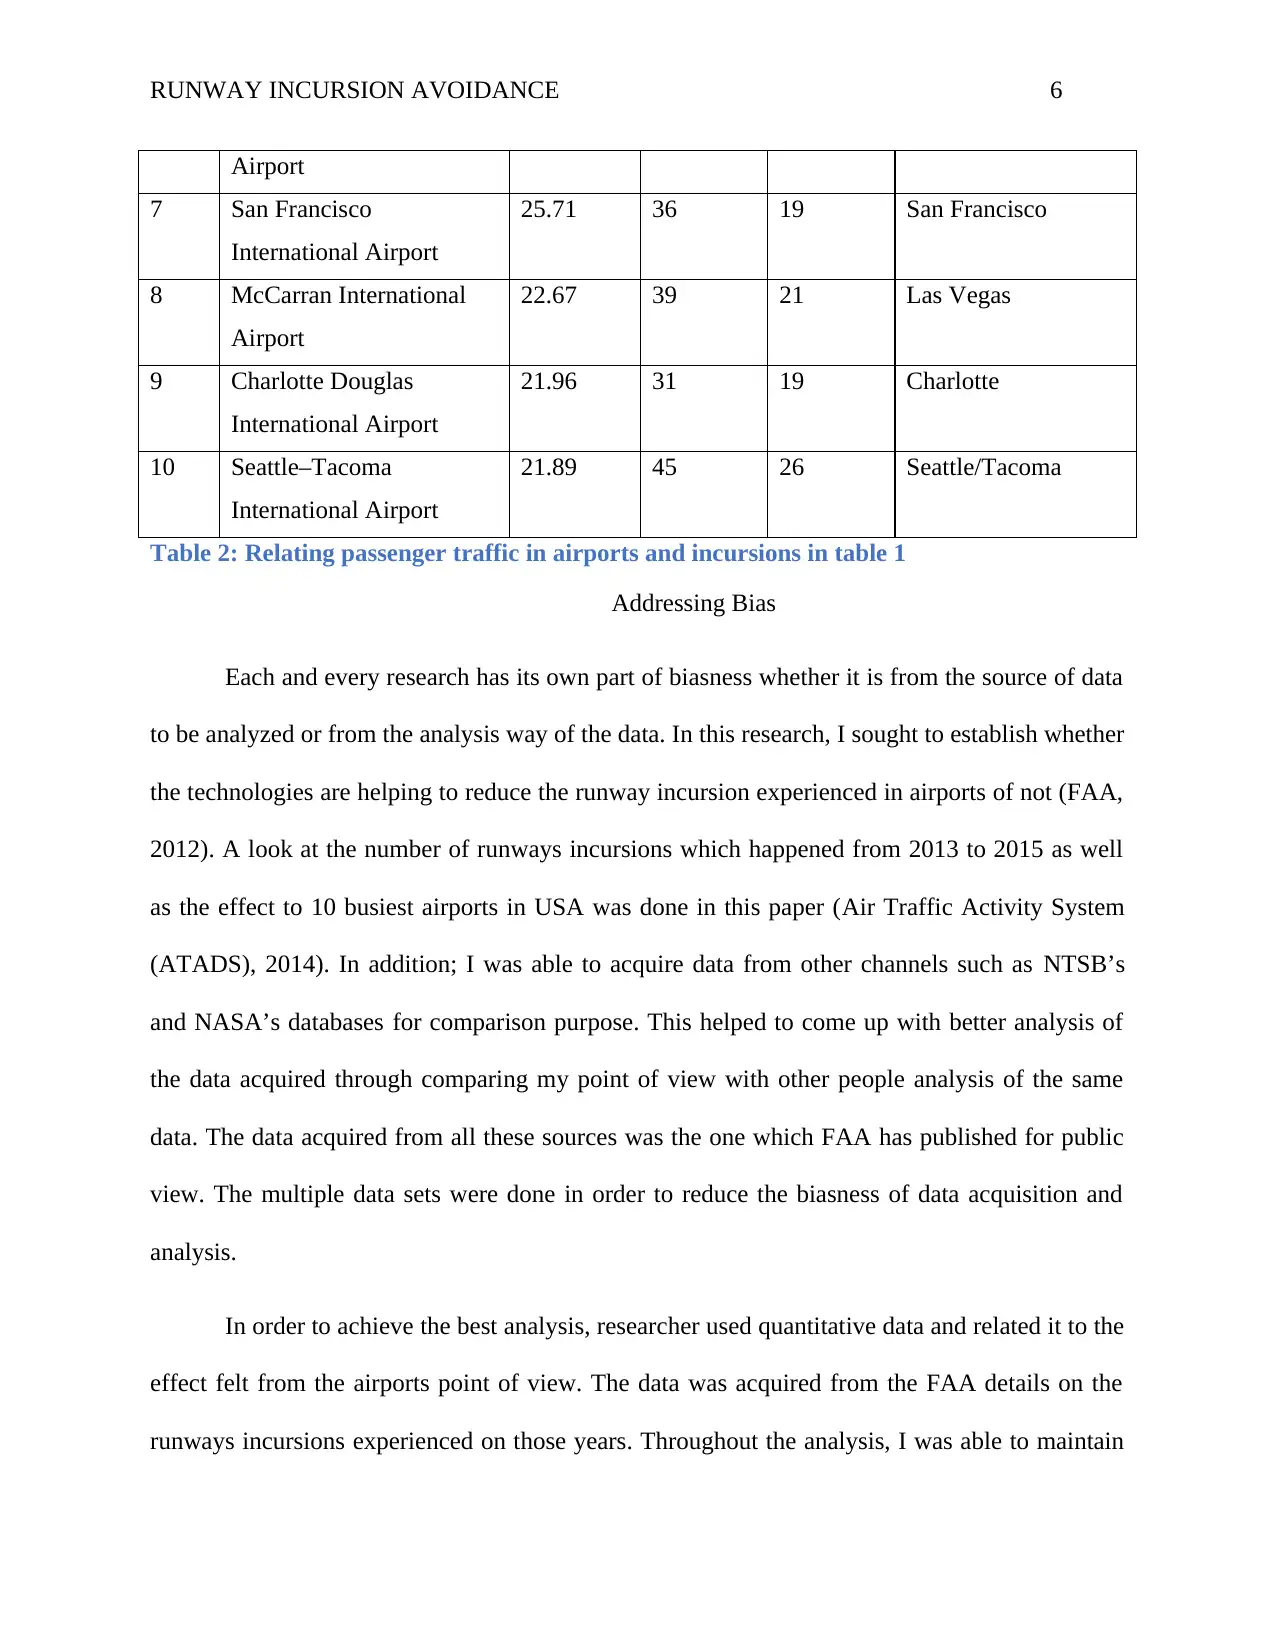
Table 2: Relating passenger traffic in airports and incursions in table 1
Addressing Bias
Each and every research has its own part of biasness whether it is from the source of data
to be analyzed or from the analysis way of the data. In this research, I sought to establish whether
the technologies are helping to reduce the runway incursion experienced in airports of not (FAA,
2012). A look at the number of runways incursions which happened from 2013 to 2015 as well
as the effect to 10 busiest airports in USA was done in this paper (Air Traffic Activity System
(ATADS), 2014). In addition; I was able to acquire data from other channels such as NTSB’s
and NASA’s databases for comparison purpose. This helped to come up with better analysis of
the data acquired through comparing my point of view with other people analysis of the same
data. The data acquired from all these sources was the one which FAA has published for public
view. The multiple data sets were done in order to reduce the biasness of data acquisition and
analysis.
In order to achieve the best analysis, researcher used quantitative data and related it to the
effect felt from the airports point of view. The data was acquired from the FAA details on the
runways incursions experienced on those years. Throughout the analysis, I was able to maintain
Airport
7 San Francisco
International Airport
25.71 36 19 San Francisco
8 McCarran International
Airport
22.67 39 21 Las Vegas
9 Charlotte Douglas
International Airport
21.96 31 19 Charlotte
10 Seattle–Tacoma
International Airport
21.89 45 26 Seattle/Tacoma
Table 2: Relating passenger traffic in airports and incursions in table 1
Addressing Bias
Each and every research has its own part of biasness whether it is from the source of data
to be analyzed or from the analysis way of the data. In this research, I sought to establish whether
the technologies are helping to reduce the runway incursion experienced in airports of not (FAA,
2012). A look at the number of runways incursions which happened from 2013 to 2015 as well
as the effect to 10 busiest airports in USA was done in this paper (Air Traffic Activity System
(ATADS), 2014). In addition; I was able to acquire data from other channels such as NTSB’s
and NASA’s databases for comparison purpose. This helped to come up with better analysis of
the data acquired through comparing my point of view with other people analysis of the same
data. The data acquired from all these sources was the one which FAA has published for public
view. The multiple data sets were done in order to reduce the biasness of data acquisition and
analysis.
In order to achieve the best analysis, researcher used quantitative data and related it to the
effect felt from the airports point of view. The data was acquired from the FAA details on the
runways incursions experienced on those years. Throughout the analysis, I was able to maintain
⊘ This is a preview!⊘
Do you want full access?
Subscribe today to unlock all pages.
Trusted by 1+ million students worldwide
RUNWAY INCURSION AVOIDANCE 7
independence of data processing and data collection. This was helping me to keep openness
regarding the outcome which I could achieve and introduction of biasness. This factor helped to
reduce any biasness which I could introduce to the data analysis and acquisition.
Data Collection and Analysis– I have coved this section.( do not write this)
Data Collection
The data for this research study will be collected from primary sources. These data will
not divide in to qualitative variables such as pilot gender (male / female), race (white, Hispanic,
etc.) or the aircraft fleet (B777, A330, A321,etc.). Instead of dividing in to qualitative variables
will be separated into two main groups that determines those that agree that change is required,
and those that disagree. To accomplish this study, the researcher will gather and organized data
will be quantitative. This primary data source includes pre-existing data retrieved from other
organizations and previous research studies conducted in this context. Moreover, crucial data
will be collected from NTSB’s and NASA’s databases to determine the inferential relationship
between various factors that are pertinent to the runway incursions. Further data on ground
vehicle technology equipment for drivers and pedestrians, existing flight technology for pilots,
communication systems can be obtained to investigate if the technology limitation is a potential
cause of these human-bound runaway incursions. These data will also obtain from pre-existing
data will be collected from primary sources. Identifying these potential factors will help the
researcher to develop the hypothesis.
Tabulating Data
The data will be tabulated using computer software. The sample data obtained for the
research study can be appropriately analyzed and will presented by using Microsoft excel (Dale,
Paraphrase This Document
Need a fresh take? Get an instant paraphrase of this document with our AI Paraphraser
RUNWAY INCURSION AVOIDANCE 8
2001). MS Excel extensively used for the entry and data management and it has a large range of
statistical functions that are very advantageous. Moreover, the tables creating by excel can be
compare different variables column wise, row wise or values either chart or table format. The
data will be presented in the APA-style format.
Graphical representation of Data
The data will be plotted to display the graphical characteristic and parameters of the data.
For effective analysis and better representation, histograms and plots can be used to graphically
demonstrate the obtained data. Therefore, the researcher will be using StatCrunchdata analysis
software to determine the shape of the distribution and to be applied on row data. StatCrunch
delivers an extensive array of numerical and graphical routines for analyzing data with numerous
features can be used for pedagogical purpose. These graphical characteristics and graphs will be
represented in APA-style format.
Understanding the Sampling Distribution
The statistical method to test the hypothesis will be determined based on the shape and
graphical characteristic of the graph. To determine the obtained data is parametric or non-
parametric used in StatCrunch histograms and the plots will be very essential. For an instant to
determine the data is parametric using histogram, it is essential that the shape of the frequency
histogram is identical shape of a bell-shaped curve and if not, it will be non-parametric. After
identifying the normality of data which determined using through StatCrunch, the decision will
be made on which appropriate statistical hypothesis method to be used to test the hypothesis.
As further described by James and Sood (2006), the different methods of hypotheses test
like the z-score, t-test, ANOVA and Chi-square can only be employed if the sample data has a
RUNWAY INCURSION AVOIDANCE 9
systematical distribution (i.e. is normally distribute and is not skewed to the left/right). For this
study researcher, will decide which hypotheses test to be used based on the shape of the data.
Using appropriate statistical method
The researcher will complete the analysis of the data using an appropriate statistical
method. For this research study, a significant level of 5% (i.e. p=0.05) can be used. The
significance level state the acceptance of result to a margin of 5% for committing a Type-I error.
In line with this, a 95% confidence interval will be used to describe the statistics for a broader
population in concern.
i.e. the p-value for the hypothesis testing will be =0.05.
As mentioned on the research question, runway incursions avoidance data could be built
on statistics hypothesis to determine the precise factors for each case of incident or incident
conditions and the possible technology to eliminate such faults (Freguson& Nelson, 2012). The
report explored and declared the potential of statistical analysis to provide safer air flights
operations through data analysis in the example of runaway incursions avoidance. The data
collected from multiple reports and can support such hypothesis or deny the validity of such
assumption to provide a mean of incursions avoidance.
Moreover, as mentioned above to test the hypothesis concern is depend on the results of the
statistical analysis. The p value must be > .05. This value designates the extreme threshold of
possibility of gaining an exact set of data that the researcher is eager to except, given the null
hypothesis is correct. If a statistical test designates that the probability of obtaining a particular
data set was <p value set by the researcher, the null hypothesis is accepted. If the statistical test
⊘ This is a preview!⊘
Do you want full access?
Subscribe today to unlock all pages.
Trusted by 1+ million students worldwide
RUNWAY INCURSION AVOIDANCE 10
indicates that the probability of obtaining a particular data set was ≥ p value, the null hypothesis
is rejected.
Should the null hypothesis be rejected, the analysis would suggest that the research
hypothesis is supported and the conclusion will have a statement similar to the following: “The
result of the statistical test of the hypotheses indicates that the null hypothesis can be rejected.
This suggests that the research hypothesis of this Graduate Capstone Paper is supported. The
result of the analysis is statistically significant at the p=0.05 value or 95% confidence interval”.
On the other hand, if the null hypothesis is not rejected, plausible explanations will be provided
as to why the null hypothesis was not rejected.
Validity and Reliability
Achieving credibility and accuracy is important for any research. The importance of
credibility is able to enhance coming up with viable conclusion. The FAA website updated its
data in quarterly basis and this shows that valid and accurate data is always updated. The
presence of the data before and after the technologies were installed on the different airports is
still present on the FAA website. The presence of the data from different periods is able to show
that the data is well stored and accurate and therefore can be used for research. Checking for the
validity of the data was another key step which is had to take in the process of conducting this
research. As noted by Air Line Pilots Association, International. (2007), the validity of the
analysis measures whether the researcher is measuring what he or she is required to measure.
The data analysis which I did was able to originate from the key source as required and chose the
key data to analyze the issue.
Paraphrase This Document
Need a fresh take? Get an instant paraphrase of this document with our AI Paraphraser
RUNWAY INCURSION AVOIDANCE 11
Updating the data at different periods is a key process to show the accuracy and
credibility of data source. In addition, in order to determine the validity and credibility of the
research, the data acquired from FAA was compared from other sources (FAA, 2015). Critical
thinking on the similarity of the data from the different sources was compared. In addition, the
annual data was compared with the different quarterly data which was available in FAA website.
Cumulating the data was able to prove the credibility and validity of the annual data presented.
Through these numerous aspects, the data used on this research was assumed to be valid and
credible.
Chapter Summary
Use of technologies to address the increase of incursions has been a key goal of FAA. The
introduction of the anti-incursion technologies has happened since 2002. Nevertheless, the
incursion increase has ever been experienced even with the implementation of these
technologies. The use of aviation sector has become a key section of travel for many people,
leading to increase of congestion on aviation stations. This increase had led to an increase on the
number of runway incursions occurring. Although the technologies have been implemented to
reduce the runway incursions, the opposite has been experienced year in year out. Quantitative
data was retrieved from FAA website, NTSB’s and NASA’s databases in order to enhance the
analysis. In addition, in order to enhance the credibility of the data source, the selection of the
databases and sources of data was closely selected. The use of the different systems and
databases was able to ensure that different data was compared in order to make proper
conclusion. This chapter collected quantitative data from different airports on the incursion. The
data collected included incursions occurring on different airports in US before the installation of
the anti-incursion technologies and also data of incursions after the installation of the

RUNWAY INCURSION AVOIDANCE 12
technologies. The data spans are able to show that the anti-incursion technologies have not
worked well in the reduction of such accidents and incidents in the airports.
technologies. The data spans are able to show that the anti-incursion technologies have not
worked well in the reduction of such accidents and incidents in the airports.
⊘ This is a preview!⊘
Do you want full access?
Subscribe today to unlock all pages.
Trusted by 1+ million students worldwide
1 out of 13
Related Documents


Your All-in-One AI-Powered Toolkit for Academic Success.
+13062052269
info@desklib.com
Available 24*7 on WhatsApp / Email
![[object Object]](/_next/static/media/star-bottom.7253800d.svg)
Unlock your academic potential
Copyright © 2020–2026 A2Z Services. All Rights Reserved. Developed and managed by ZUCOL.