PHM592 Assignment 1: Key Health Indicators and Rwanda's MDG
VerifiedAdded on 2022/08/26
|20
|4109
|21
Report
AI Summary
This report assesses Rwanda's progress towards achieving the health-related Millennium Development Goals (MDGs) from 1990 to 2015, considering the impact of the 1994 Tutsi genocide. It highlights improvements in life expectancy, child mortality, maternal mortality ratio, malaria and HIV prevalence, and child nutrition. The report also discusses changes and challenges faced, comparing them with other African countries. Key achievements include increased immunization coverage, reduced malaria mortality, and improved healthcare coverage in rural areas. The analysis emphasizes the importance of good health policy, effective execution of Health Vision 2020, and universal health coverage in Rwanda's success. The report concludes by stressing the need to address remaining inequalities and sustain progress in the context of the Sustainable Development Goals.
Running Head: KEY HEALTH INDICATORS FOR RWANDA
KEY HEALTH INDICATORS FOR RWANDA
Yusuf.S PHM592 329351 assignment1
KEY HEALTH INDICATORS FOR RWANDA
Yusuf.S PHM592 329351 assignment1
Paraphrase This Document
Need a fresh take? Get an instant paraphrase of this document with our AI Paraphraser
1KEY HEALTH INDICATORS FOR RWANDA
Table of Contents
Introduction:................................................................................................................................................2
Discussion:..................................................................................................................................................2
Indicators:................................................................................................................................................3
I. Improved life expectancy and reduced child mortality:...............................................................3
II. Maternal Mortality Ratio (MMR) per 100,000 live births:..........................................................3
III. Decreased malaria mortality and morbidity and low HIV prevalence Malaria morbidity............3
IV. Achievements regarding child nutrition:..................................................................................4
V. Other contributing Health indicators:...........................................................................................4
Changes and Challenges Faced while achieving the MDGS:..................................................................4
Comparison of the challenges faced with respect to Rwanda and other African countries:.....................5
Conclusion:..................................................................................................................................................6
Appendix:....................................................................................................................................................8
References:................................................................................................................................................14
2KEY HEALTH INDICATORS FOR RWANDA
Introduction:
MDG Progress Report for Rwanda evaluates the nation's accomplishments in regards to the
Millennium Development Goals (MDGs) (1), incorporating, where necessary and appropriate, a sub-
regional segmentation of results. Since the turn of the century the relatively excellent success of the
country in growth has been recorded. Rwanda released three up-to-date MDG nation surveys, one in
2003, one in 2007, and one in 2012, the latter based on 2010 results. Rwanda is demonstrating a different
case with the MDGs and findings being implemented. In 1990, Rwanda has been one of the countries in
Sub-Saharan Africa (SSA) with low results on fitness-related MDG metrics compounded by the 1990 to
1994 civil war and the 1994 genocide against Tutsi. Although most studies on Rwandan health-related
MDGs concentrate solely on the status factor while offering a detailed and global view of the situation,
this research tackles the void found by presenting extensive details as follows: recurrent gaps up-to-date;
variability from 1990 to 2015, including the setbacks arising from the 1994 Tutsi genocide and health
benefit. The aim of this report is to chart Rwanda's own progress in meeting the health-related goals of the
MDGs 2015 from 1990 to 2014/2015. The study describes the actual status of the 2015 health-related
MDGs concluded in Rwanda and hence represents the benchmark for the developing SDGs (1). It
also discusses changes from 1990 to 2014/2015 including the setbacks arising from the 1994 genocide
against Tutsi and illustrates on the ongoing differences to date. Additionally it also points out
the contrasts amongst the current status with international levels.
Discussion:
The result analysis is focused largely on the distinction between Rwanda's current role and the
WHO African region as being one of the poorest rates of underdeveloped countries on average; and the
WHO Regional as the top performing level on average. Since Rwanda's health-related (3) indicators were
rated among the worst in 1990, the situation exacerbated by the atrocities of the 1990s, the
⊘ This is a preview!⊘
Do you want full access?
Subscribe today to unlock all pages.
Trusted by 1+ million students worldwide
3KEY HEALTH INDICATORS FOR RWANDA
accomplishment of the corresponding basic or revised goals is considered to be strong progress.
Moreover, the implementation of the global level or the steady achievement of the 2020 objectives is
regarded to be exceptional performance, while the residual gap, if any, is stable.
Indicators:
I. Improved life expectancy and reduced child mortality:
Child mortality has more than halved in fewer than three decades-from 12.6 million in 1990 to 5.4
million in 2017. The death of a child is a major loss, of course, and in many nations often too many kids
suffer regardless of reasons experts know when to avoid and how to handle. Children's pain and deaths
are enormous, and these everyday events proceed without having the recognition that this tragedy
requires. In 1994, average life expectancy dropped to 25 years but in 2008 it recovered 50 years.
Increasing immunization availability is a crucial factor in this: the percentage of one-year-old immunized
children increased quickly after 1994 to reach pre-genocide rates (8). Coverage gaps are therefore
remarkably small.
II. Maternal Mortality Ratio (MMR) per 100,000 live births:
Between 2000 and 2005, the MMR (2) dropped by 30 per cent. Although no further recent statistics
are available, changes in the usage of antenatal care ANC and professional employee birth attendance
indicate that the MMR might have declined much lower. Improvements in birth participation were higher
in the poorer quintile, rising from 17.6% in 2005 to 42.7% in 2007; in the richer quintile, the change was
from 61.3% to 70.6%, which implies the poor-rich difference was decreased by 36%. The rural-urban
difference also declined by 34% and exposure to ANC rose more in rural areas than in urban areas (84%
and 47% respectively) (8).
Paraphrase This Document
Need a fresh take? Get an instant paraphrase of this document with our AI Paraphraser
4KEY HEALTH INDICATORS FOR RWANDA
III. Decreased malaria mortality and morbidity and low HIV prevalence
Malaria morbidity (5) has declined in health centers and expanded drug utilization has tended to
minimize incidence. Malaria mortality rate further dropped, from 10.1% in 2001 to 2% in 2007 (10).
Moreover, HIV incidence decreased from 13% in 2000 to 3% in 2007.
IV. Achievements regarding child nutrition:
While malnutrition is still strong, the prevalence of underweight and extreme underweight among
children has dropped (2). However, there is an uptick in severe poverty (stunting), rising from 48 percent
in 2000 to 52 percent in 2009. Malnutrition has been described as a obstacle to future health
improvements: a presidential plan prioritized the problem in 2009 by adopting a revised strategy for
handling it.
5KEY HEALTH INDICATORS FOR RWANDA
V. Other contributing Health indicators:
Improving the network has improved healthcare coverage, especially in rural areas. 60 per cent of the
population currently lives within 5 km of a health center. The industry continues to be suffering from a
severe lack of skilled workers, though statistics indicate that the health workforce increased from 36% to
62% between 2005 and 2008 (15). The significant public investment in the sector and the status of water
and sanitation facilities are major factors contributing to excellent water and sanitation performance for
Rwanda. Districts managed and provided a great deal of water to the community alongside sanitation
facilities. All districts, both rural and urban, have been planning and monitoring their own progress in
terms of water supply and distribution and the development of sanitation facilities through the imihigo
project, since 2006 (11). Such programs also extended the penetration of safe drinking water and
sanitation services into largely rural areas amid a strong national commitment to successful water source
management, hygiene and sanitation campaigns.
Changes and Challenges Faced while achieving the MDGS:
Group (mutual) health care was essential to reducing financial obstacles to public coverage.
Mutuelles aimed at sharing the financial burden of accessing help through their customer base, have
allowed patients to receive healthcare at an reasonable rate even until their illness worsens, while
therefore lowering medical costs. That has contributed to greater competition for more public facilities
being given up. Many that can't afford are sponsored by government or international agencies, based on
the societies themselves. The effectiveness of the mutual is partially a function of the willingness of
government to enact local enforcement. A unique obstacle but also an incentive is to collaborate closely
with the business sector and with civil society. Rwanda has made considerable strides by focusing on
home-grown projects; however, as the country moves ahead in an increasingly dynamic regional and
global setting, the position of business enterprises and individual businessmen will become increasingly
relevant, not least in providing employment for the vast number of unemployed young people or for the
⊘ This is a preview!⊘
Do you want full access?
Subscribe today to unlock all pages.
Trusted by 1+ million students worldwide
6KEY HEALTH INDICATORS FOR RWANDA
many who work in the informal industry. Most of this can be tackled by local operators but it would
eventually focus on forming alliances with other firms, be they based in the area of East Africa or beyond.
Comparison of the challenges faced with respect to Rwanda and other African
countries:
Rwanda is making significant strides in improving health (3) and is moving in meeting the
Millennium Development Goals, which is a difficult challenge as the nation experienced genocide in
1994, has little natural resources, is landlocked and has a fast population increase. As other neglected sub-
Saharan nations, Rwanda's health care sector has had an uncoordinated abundance of donors, a lack of
government workers, service inequity, and inadequate standard of health care facilities. With a revived
effort to monitor the AIDS outbreak in Rwanda, the Regional HIV / AIDS Surveillance System (PNLS)
was restored (9). The PNLS 'initial goal was to inform Rwandans about how to prevent HIV infection.
The movement first gathered attention when President Kagame unexpectedly attended a PNLS meeting,
voiced his support for the HIV / AIDS war and made it a top priority for his administration. Unlike other
sub-Saharan African countries at the moment, however, insufficient policy funding and minimal
international assistance rendered the high HIV care rate prohibitively out of control. Various study and
report have been conducted which, discusses three improvements in the health sector implemented by the
Rwandan government that are strengthening these obstacles to treatment, linking donors and international
assistance with policy initiatives, and tracking help effectiveness; an integrated voluntary health insurance
program around the country; and the implementation of a performance- pay programme. If such
developments work, they may be of interest to other sub-Saharan countries including Somalia, South
Africa, Ethiopia, and Sudan. Rwanda, though, also does not have adequate financial support for health
and would need substantial international assistance for some time to meet the Millennium Development
Goals.
Paraphrase This Document
Need a fresh take? Get an instant paraphrase of this document with our AI Paraphraser
7KEY HEALTH INDICATORS FOR RWANDA
Conclusion:
Rwanda's success on the 2015 benchmarks for health-related Millennium Development Goals
(MDGs) is remarkable given the adverse impact of the 1990-1994 Civil War and the 1994 Tutsi genocide
at baseline 1990 rates. Throughout the 20 years after the end of the genocide against the Tutsis, Rwanda
has made considerable strides throughout growth. For all Rwandans, a firm contribution to an organized
and evidence-based approach to the HIV outbreak has facilitated major changes in health results. Most
Sub-Saharan African nations are now searching for creative approaches to tackle their own HIV
epidemics. The history of the scale-up of HIV services in Rwanda will tell us that good leadership and
financial contributions in initiatives that improve the health sector as a whole are two of the laudable
architectural aspects of health growth in Rwanda. In addition, out of 17 health-related MDGs indicators
and sub-indicators measured including the three not mentioned, eleven attained global standards or
fastened achievement of the 2020 goals, two attained specific or revised country goals and only four
indicators indicate persistent difference. Good health policy, successful execution of the Health Vision
2020, reliable internal and external mobilized support, and introduction of the Rwanda Universal Health
Coverage have significantly led to and encouraged development of the above amazing results of the
MDGs relevant to health. The inequalities already found should be prioritized as the new Sustainable
Development Targets are being enforced, and the existing achievements should be maintained and
strengthened.
8KEY HEALTH INDICATORS FOR RWANDA
Appendix:
S.No. Key Health Indicator Rationale
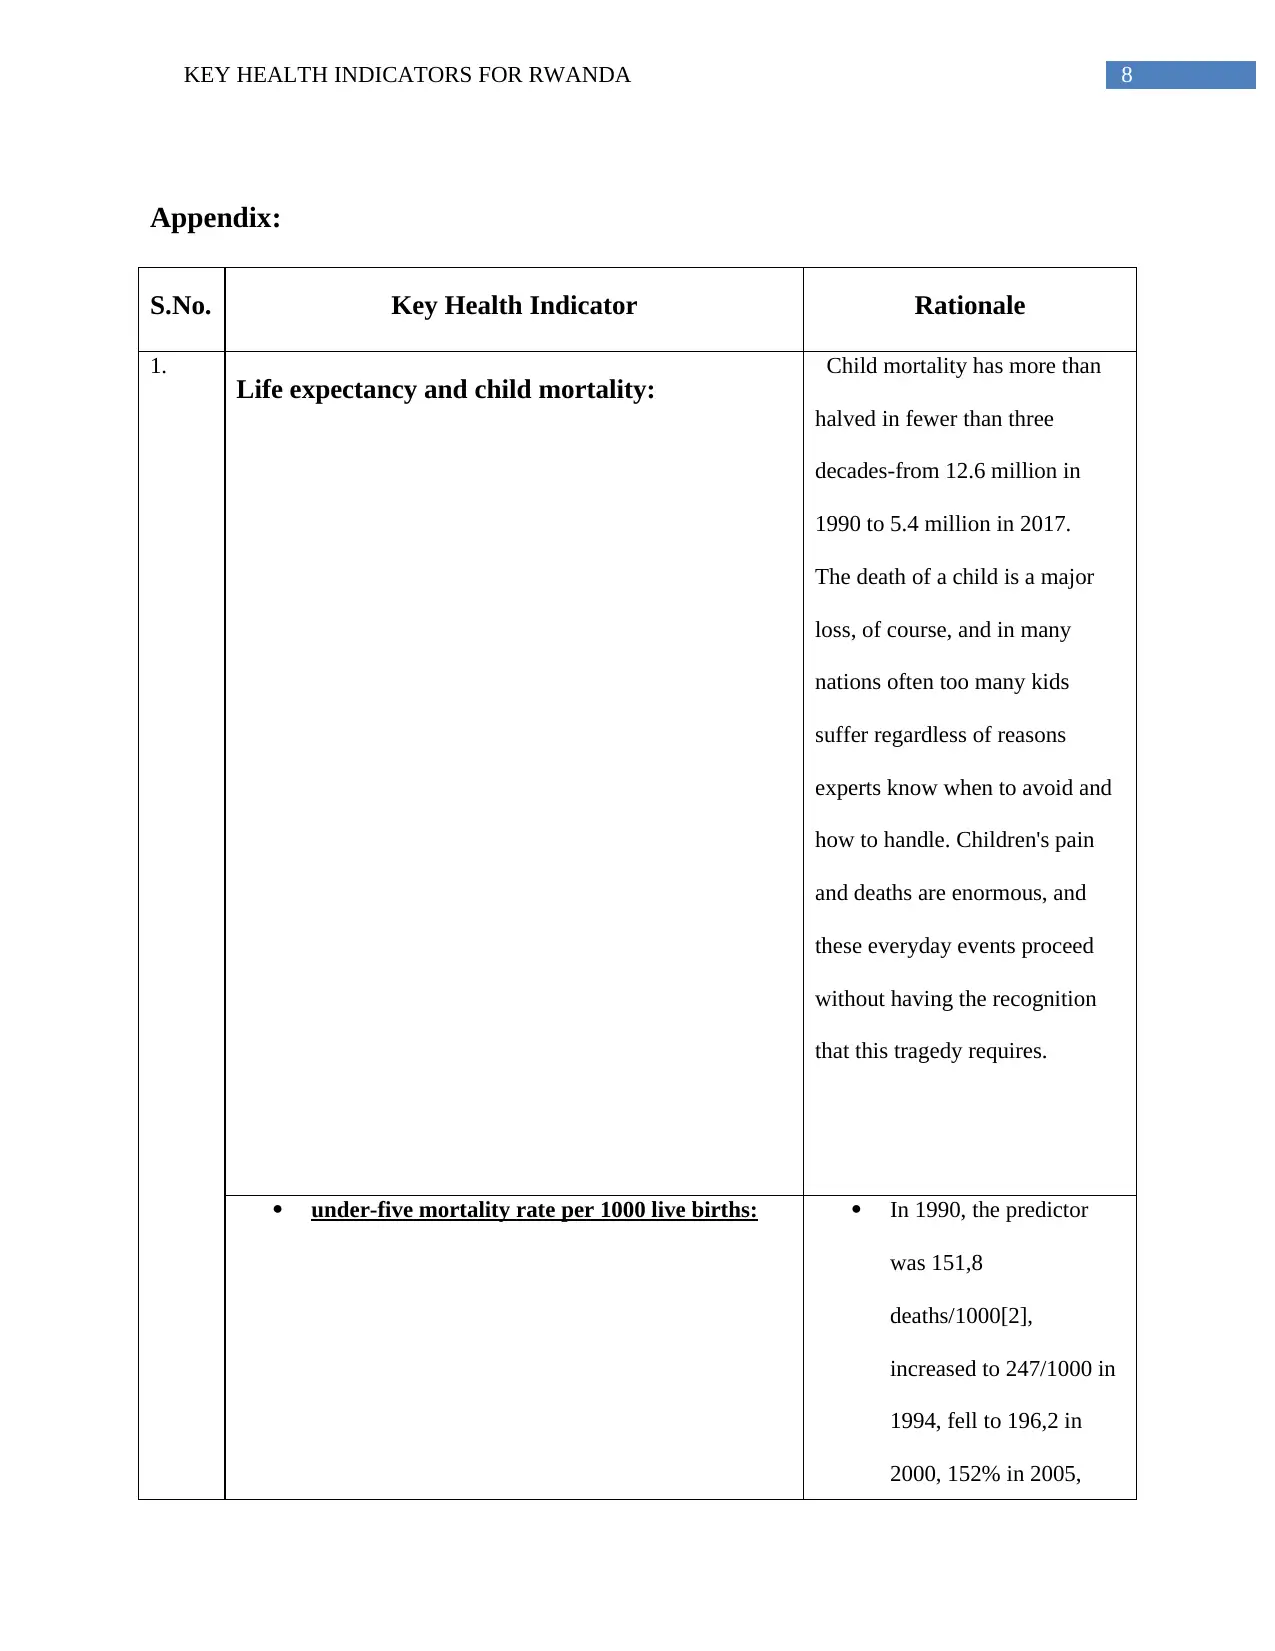
1.
Life expectancy and child mortality: Child mortality has more than
halved in fewer than three
decades-from 12.6 million in
1990 to 5.4 million in 2017.
The death of a child is a major
loss, of course, and in many
nations often too many kids
suffer regardless of reasons
experts know when to avoid and
how to handle. Children's pain
and deaths are enormous, and
these everyday events proceed
without having the recognition
that this tragedy requires.
under-five mortality rate per 1000 live births: In 1990, the predictor
was 151,8
deaths/1000[2],
increased to 247/1000 in
1994, fell to 196,2 in
2000, 152% in 2005,
Appendix:
S.No. Key Health Indicator Rationale
1.
Life expectancy and child mortality: Child mortality has more than
halved in fewer than three
decades-from 12.6 million in
1990 to 5.4 million in 2017.
The death of a child is a major
loss, of course, and in many
nations often too many kids
suffer regardless of reasons
experts know when to avoid and
how to handle. Children's pain
and deaths are enormous, and
these everyday events proceed
without having the recognition
that this tragedy requires.
under-five mortality rate per 1000 live births: In 1990, the predictor
was 151,8
deaths/1000[2],
increased to 247/1000 in
1994, fell to 196,2 in
2000, 152% in 2005,
⊘ This is a preview!⊘
Do you want full access?
Subscribe today to unlock all pages.
Trusted by 1+ million students worldwide
9KEY HEALTH INDICATORS FOR RWANDA
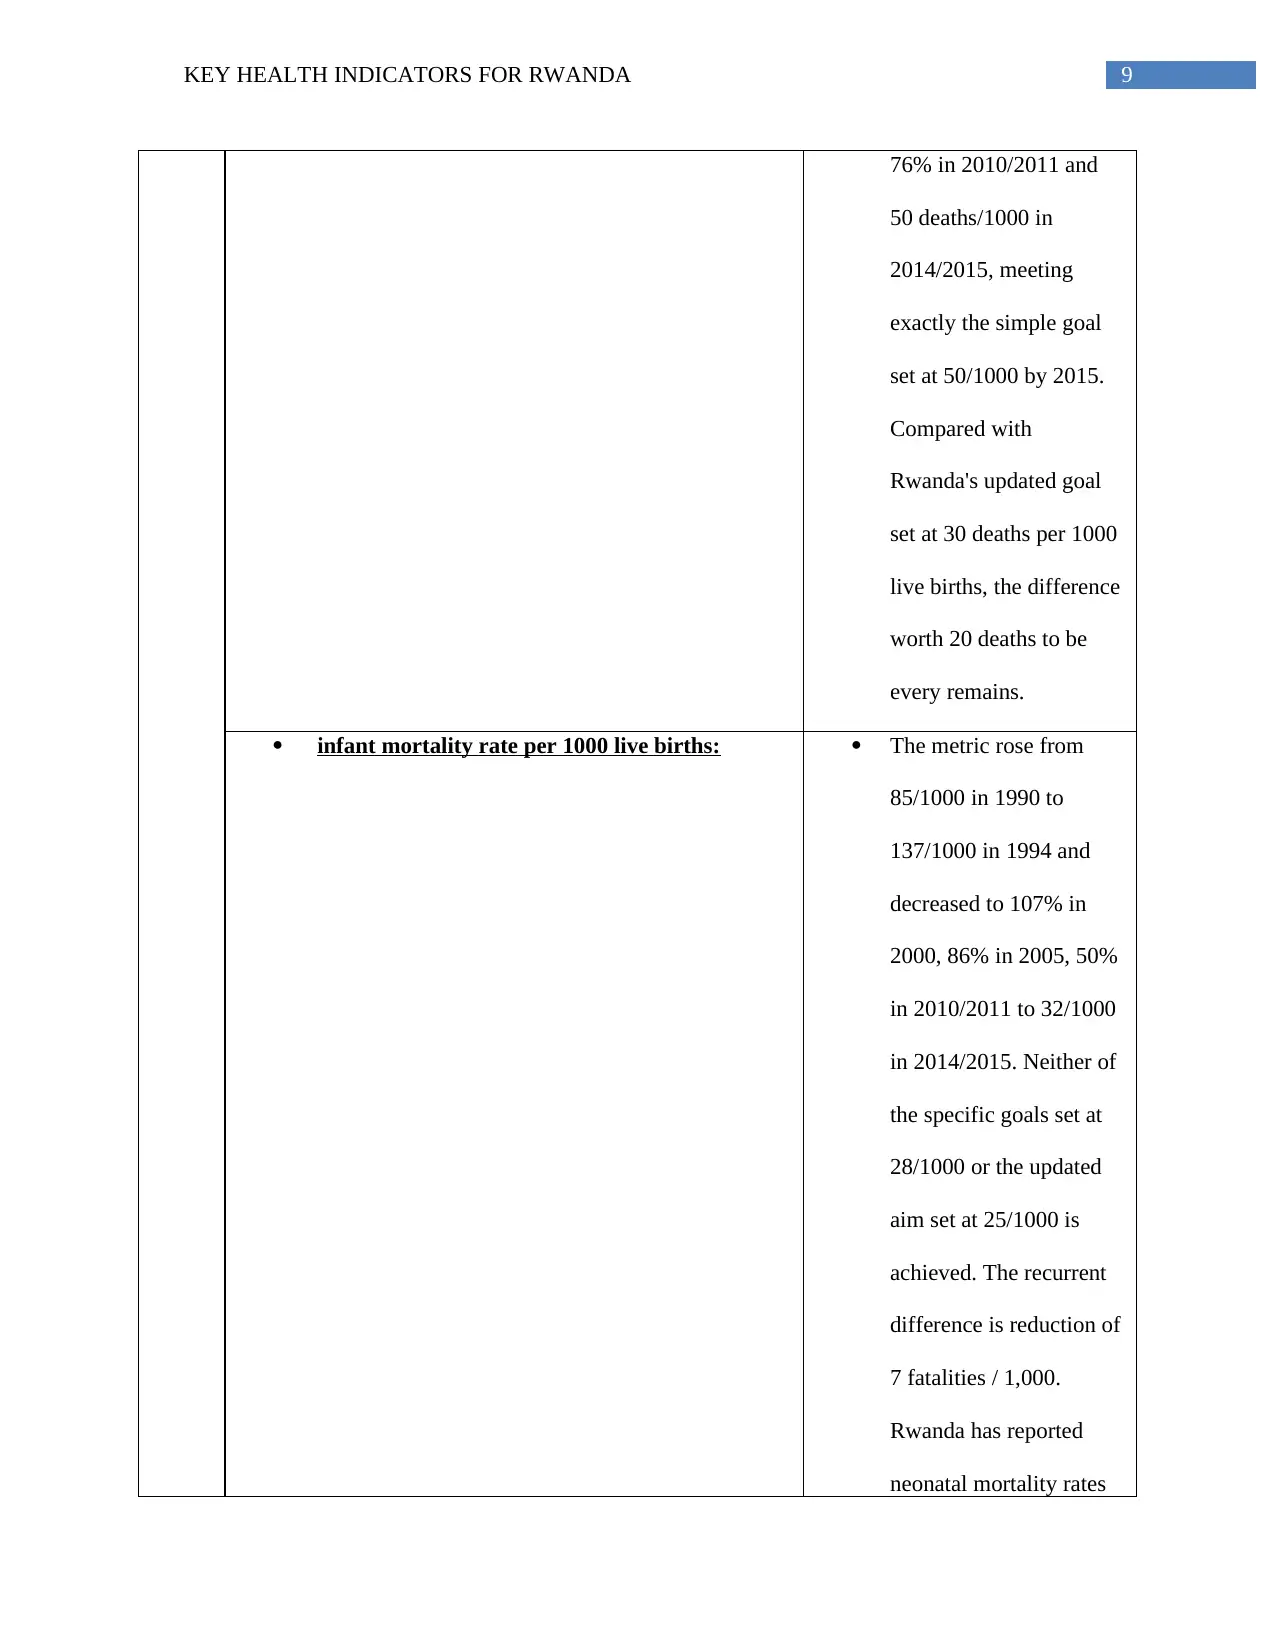
76% in 2010/2011 and
50 deaths/1000 in
2014/2015, meeting
exactly the simple goal
set at 50/1000 by 2015.
Compared with
Rwanda's updated goal
set at 30 deaths per 1000
live births, the difference
worth 20 deaths to be
every remains.
infant mortality rate per 1000 live births: The metric rose from
85/1000 in 1990 to
137/1000 in 1994 and
decreased to 107% in
2000, 86% in 2005, 50%
in 2010/2011 to 32/1000
in 2014/2015. Neither of
the specific goals set at
28/1000 or the updated
aim set at 25/1000 is
achieved. The recurrent
difference is reduction of
7 fatalities / 1,000.
Rwanda has reported
neonatal mortality rates
Paraphrase This Document
Need a fresh take? Get an instant paraphrase of this document with our AI Paraphraser
10KEY HEALTH INDICATORS FOR RWANDA
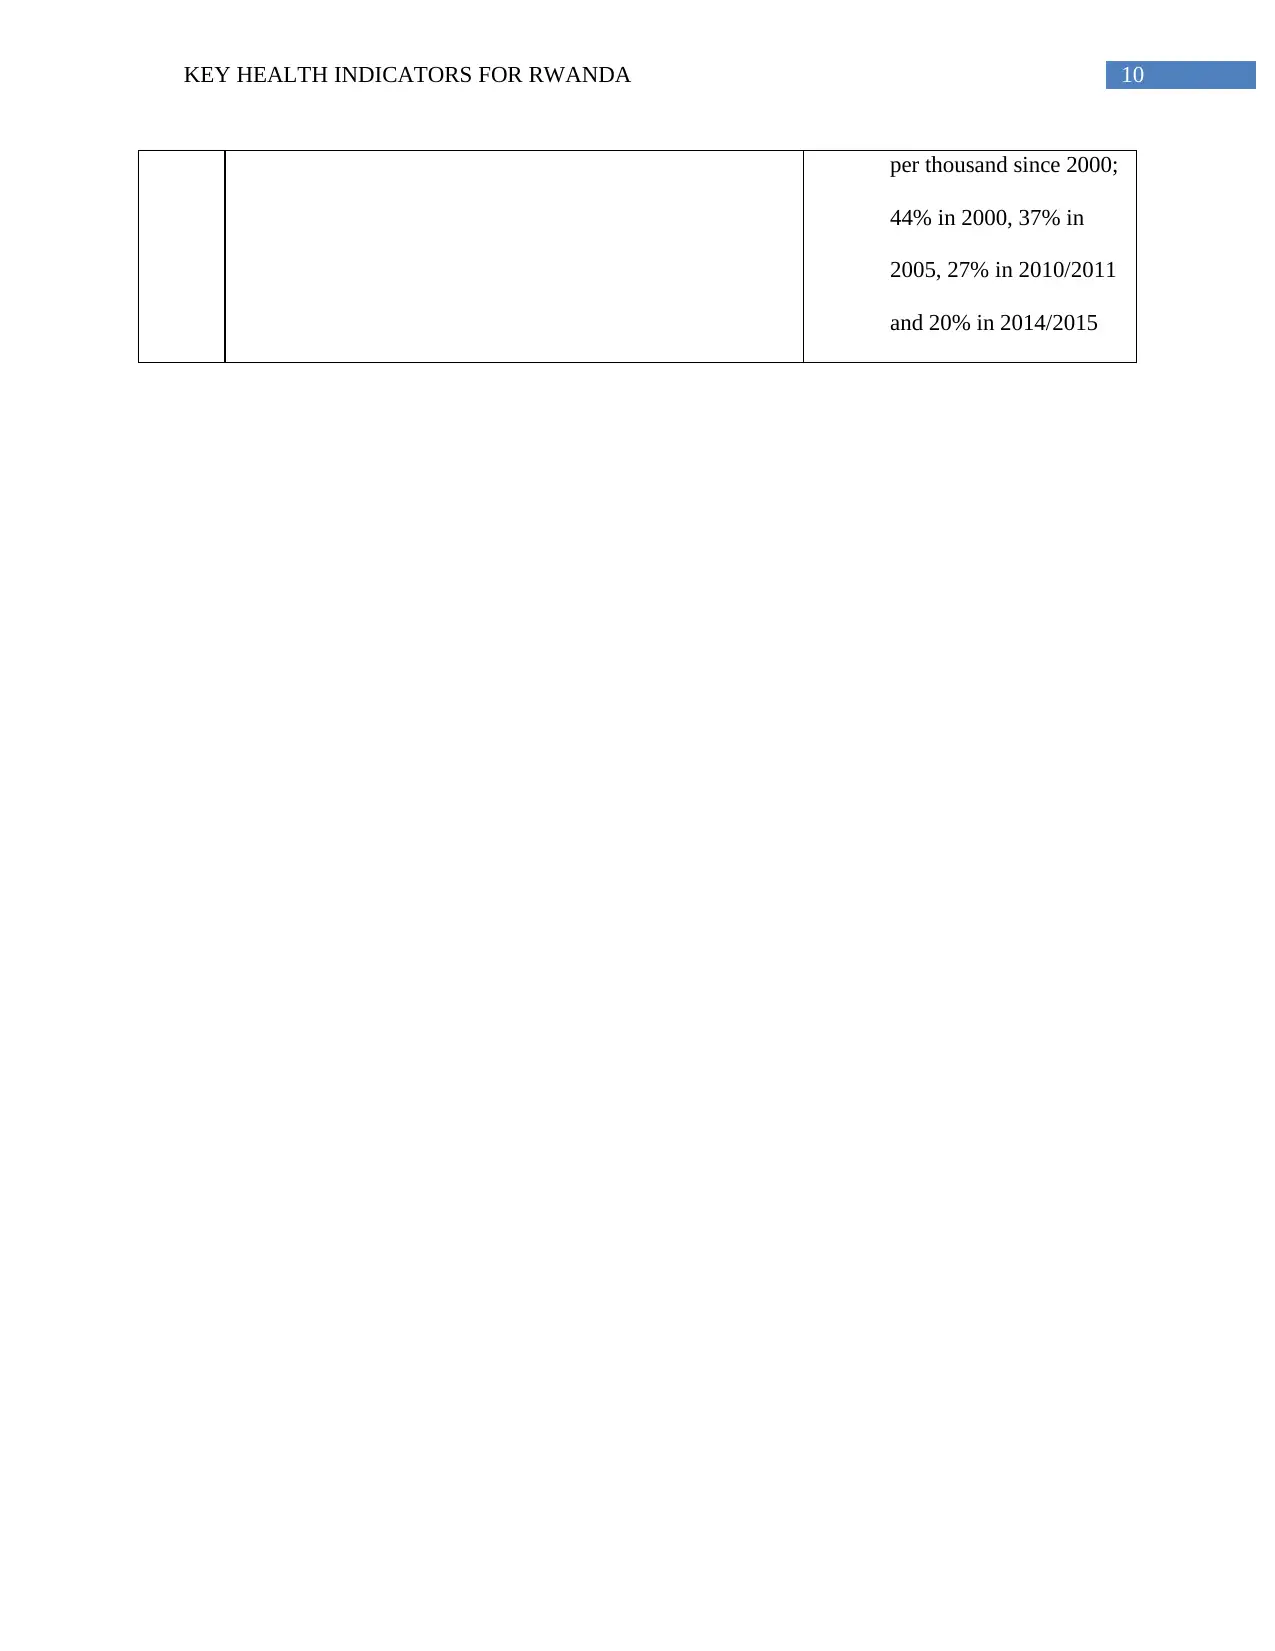
per thousand since 2000;
44% in 2000, 37% in
2005, 27% in 2010/2011
and 20% in 2014/2015
per thousand since 2000;
44% in 2000, 37% in
2005, 27% in 2010/2011
and 20% in 2014/2015
11KEY HEALTH INDICATORS FOR RWANDA
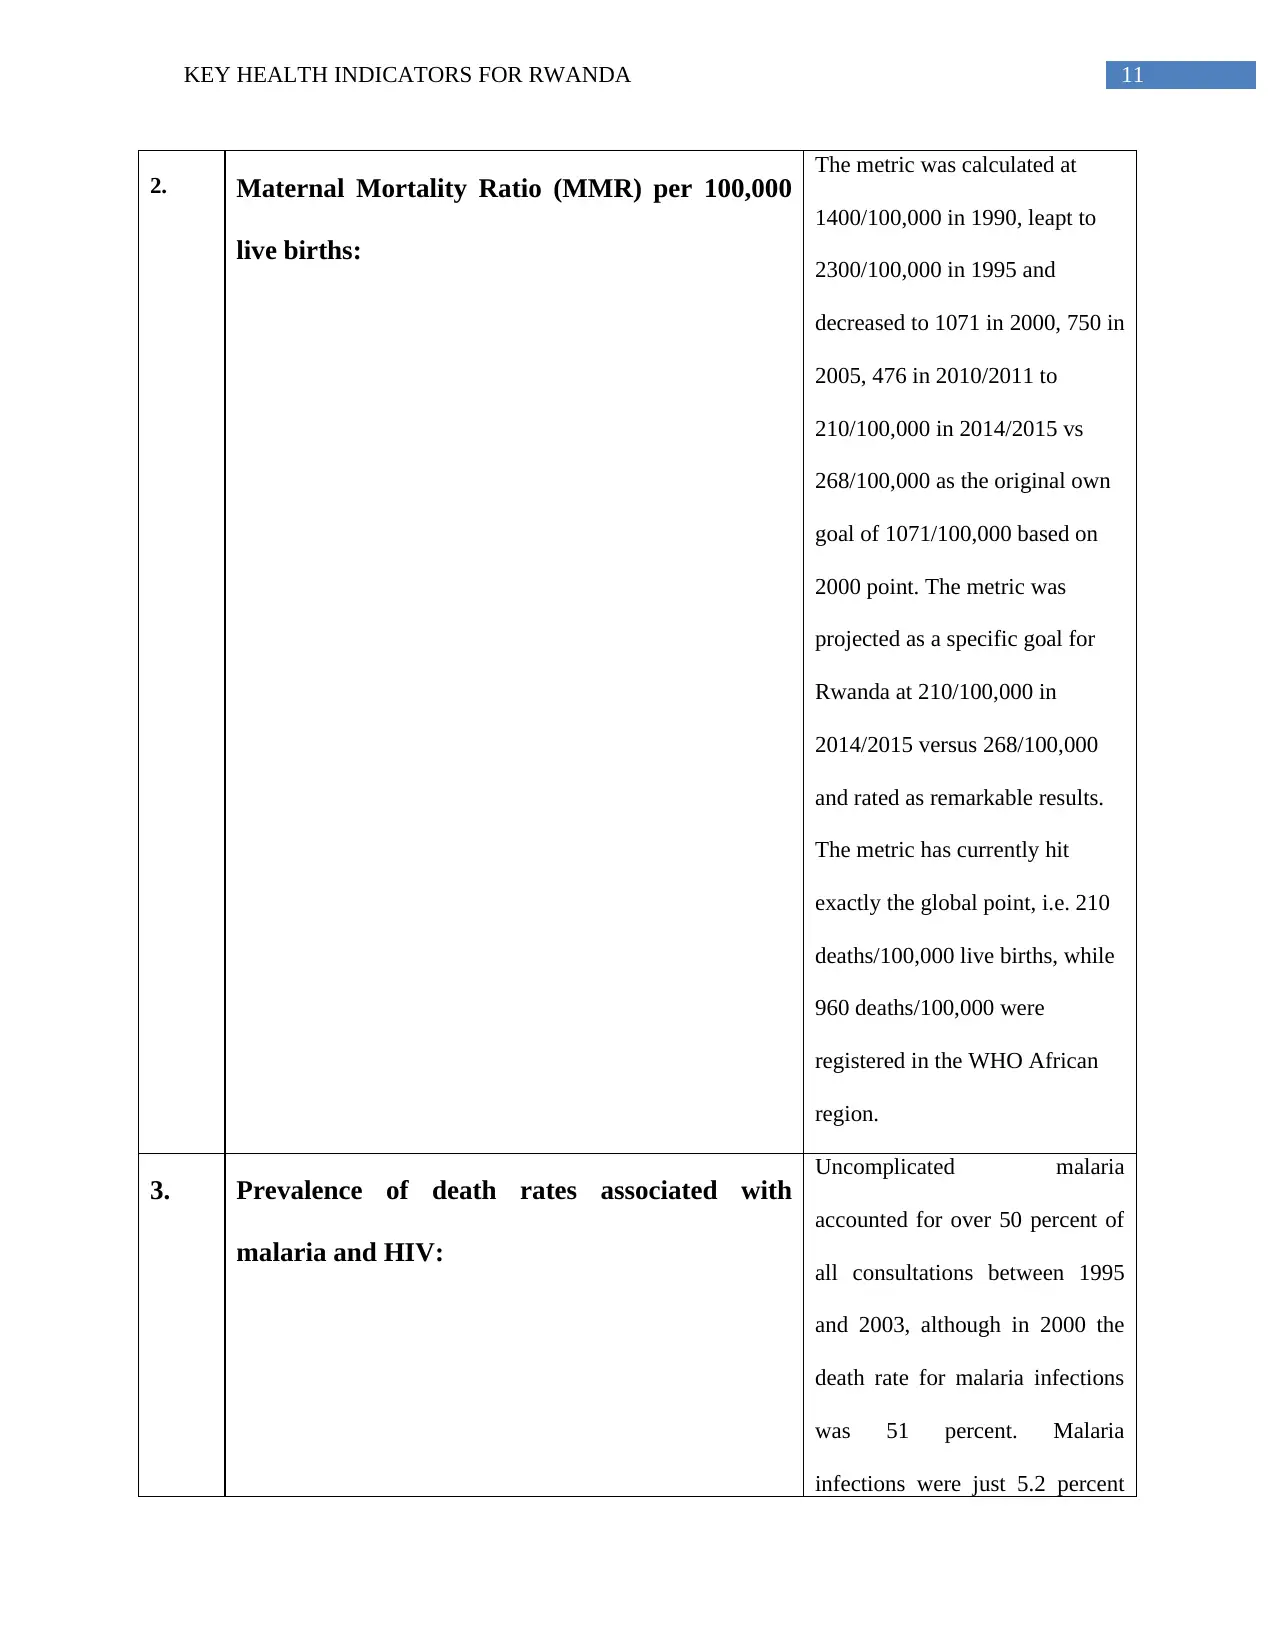
2. Maternal Mortality Ratio (MMR) per 100,000
live births:
The metric was calculated at
1400/100,000 in 1990, leapt to
2300/100,000 in 1995 and
decreased to 1071 in 2000, 750 in
2005, 476 in 2010/2011 to
210/100,000 in 2014/2015 vs
268/100,000 as the original own
goal of 1071/100,000 based on
2000 point. The metric was
projected as a specific goal for
Rwanda at 210/100,000 in
2014/2015 versus 268/100,000
and rated as remarkable results.
The metric has currently hit
exactly the global point, i.e. 210
deaths/100,000 live births, while
960 deaths/100,000 were
registered in the WHO African
region.
3. Prevalence of death rates associated with
malaria and HIV:
Uncomplicated malaria
accounted for over 50 percent of
all consultations between 1995
and 2003, although in 2000 the
death rate for malaria infections
was 51 percent. Malaria
infections were just 5.2 percent
⊘ This is a preview!⊘
Do you want full access?
Subscribe today to unlock all pages.
Trusted by 1+ million students worldwide
1 out of 20


Your All-in-One AI-Powered Toolkit for Academic Success.
+13062052269
info@desklib.com
Available 24*7 on WhatsApp / Email
![[object Object]](/_next/static/media/star-bottom.7253800d.svg)
Unlock your academic potential
Copyright © 2020–2026 A2Z Services. All Rights Reserved. Developed and managed by ZUCOL.