Ryanair Airlines: Comprehensive Financial Ratio Analysis Report

Verified

Added on  2023/01/16

|6
|358
|75
Report
AI Summary
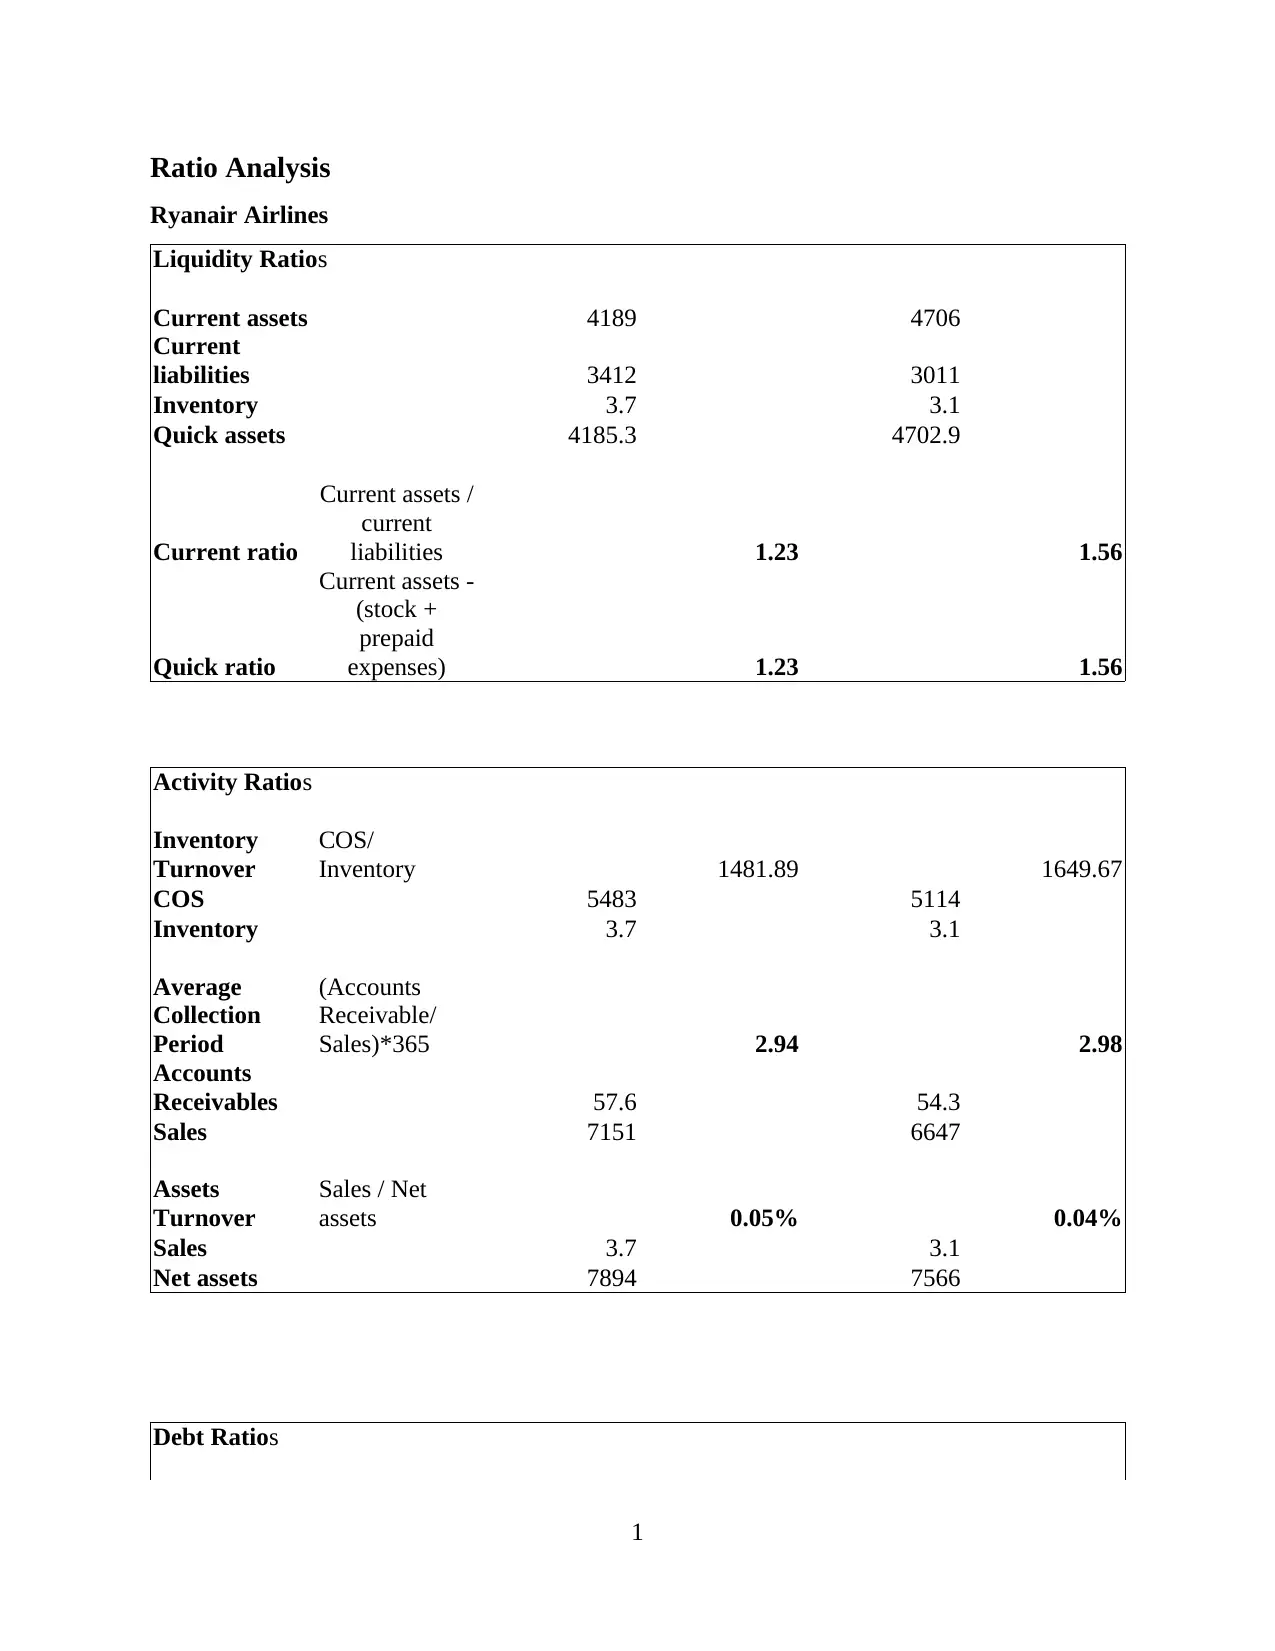
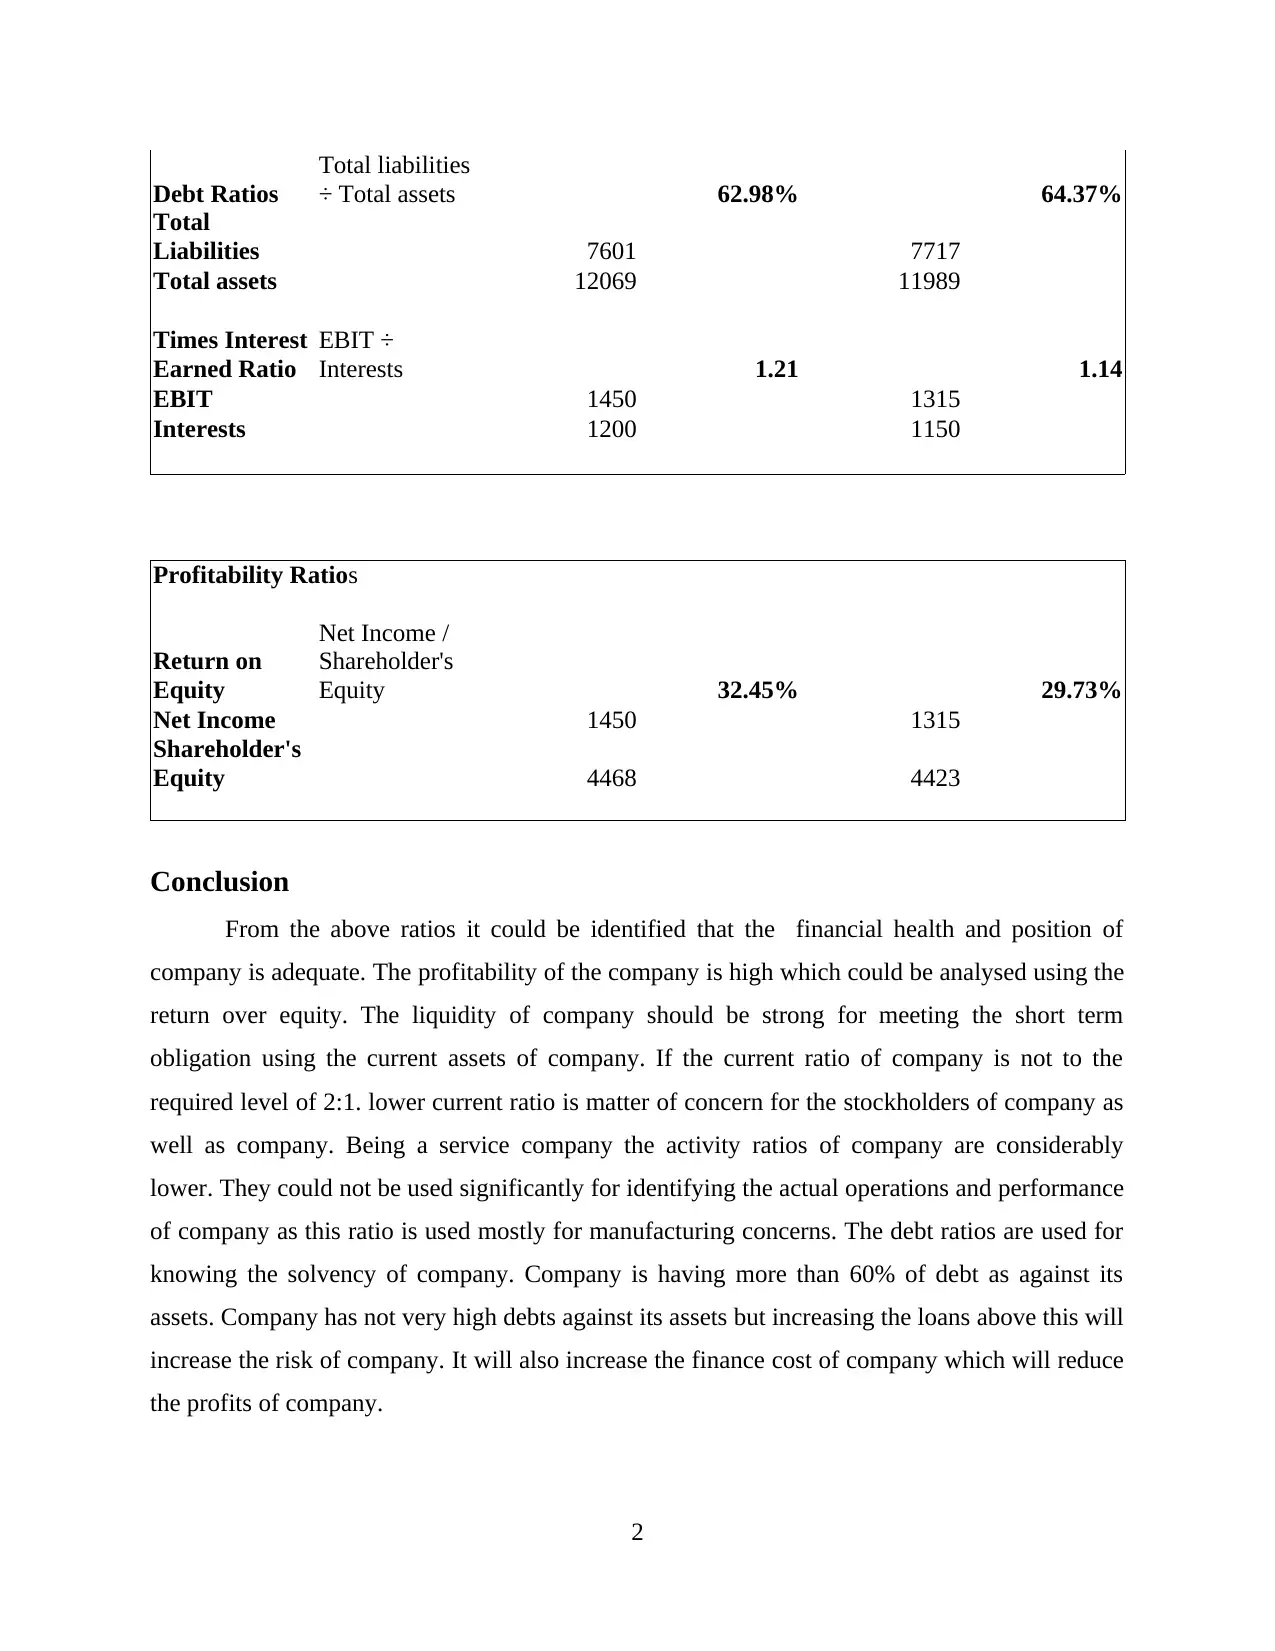
This report presents a financial ratio analysis of Ryanair Airlines, evaluating the company's financial health and position. It assesses liquidity, activity, debt, and profitability through various ratios such as current ratio, quick ratio, inventory turnover, average collection period, asset turnover, debt-to-asset ratio, times interest earned ratio, and return on equity. The analysis indicates that Ryanair's profitability is high, as reflected in the return on equity. While the company's liquidity appears adequate, a lower-than-ideal current ratio raises concerns. Being a service company, the activity ratios are lower and less significant. The debt ratios show that Ryanair has more than 60% debt against its assets, which is manageable but requires caution against increasing it further to avoid higher finance costs. Overall, the report provides a snapshot of Ryanair's financial standing based on the analyzed ratios.
Document Page
Principles for Finance
tabler-icon-diamond-filled.svg

Paraphrase This Document

Need a fresh take? Get an instant paraphrase of this document with our AI Paraphraser
Document Page
TABLE OF CONTENTS
Ratio Analysis .................................................................................................................................1
Conclusion ......................................................................................................................................2
Document Page
Ratio Analysis
Ryanair Airlines
Liquidity Ratios
Current assets 4189 4706
Current
liabilities 3412 3011
Inventory 3.7 3.1
Quick assets 4185.3 4702.9
Current ratio
Current assets /
current
liabilities 1.23 1.56
Quick ratio
Current assets -
(stock +
prepaid
expenses) 1.23 1.56
Activity Ratios
Inventory
Turnover
COS/
Inventory 1481.89 1649.67
COS 5483 5114
Inventory 3.7 3.1
Average
Collection
Period
(Accounts
Receivable/
Sales)*365 2.94 2.98
Accounts
Receivables 57.6 54.3
Sales 7151 6647
Assets
Turnover
Sales / Net
assets 0.05% 0.04%
Sales 3.7 3.1
Net assets 7894 7566
Debt Ratios
1
Document Page
Debt Ratios
Total liabilities
÷ Total assets 62.98% 64.37%
Total
Liabilities 7601 7717
Total assets 12069 11989
Times Interest
Earned Ratio
EBIT ÷
Interests 1.21 1.14
EBIT 1450 1315
Interests 1200 1150
Profitability Ratios
Return on
Equity
Net Income /
Shareholder's
Equity 32.45% 29.73%
Net Income 1450 1315
Shareholder's
Equity 4468 4423
Conclusion
From the above ratios it could be identified that the financial health and position of
company is adequate. The profitability of the company is high which could be analysed using the
return over equity. The liquidity of company should be strong for meeting the short term
obligation using the current assets of company. If the current ratio of company is not to the
required level of 2:1. lower current ratio is matter of concern for the stockholders of company as
well as company. Being a service company the activity ratios of company are considerably
lower. They could not be used significantly for identifying the actual operations and performance
of company as this ratio is used mostly for manufacturing concerns. The debt ratios are used for
knowing the solvency of company. Company is having more than 60% of debt as against its
assets. Company has not very high debts against its assets but increasing the loans above this will
increase the risk of company. It will also increase the finance cost of company which will reduce
the profits of company.
2
tabler-icon-diamond-filled.svg

Paraphrase This Document

Need a fresh take? Get an instant paraphrase of this document with our AI Paraphraser
Document Page
3
Document Page
4
chevron_up_icon
1 out of 6
circle_padding
hide_on_mobile
zoom_out_icon