Financial Analysis and Strategic Evaluation: Ryanair & EasyJet
VerifiedAdded on  2022/12/23
|32
|6008
|1
Report
AI Summary
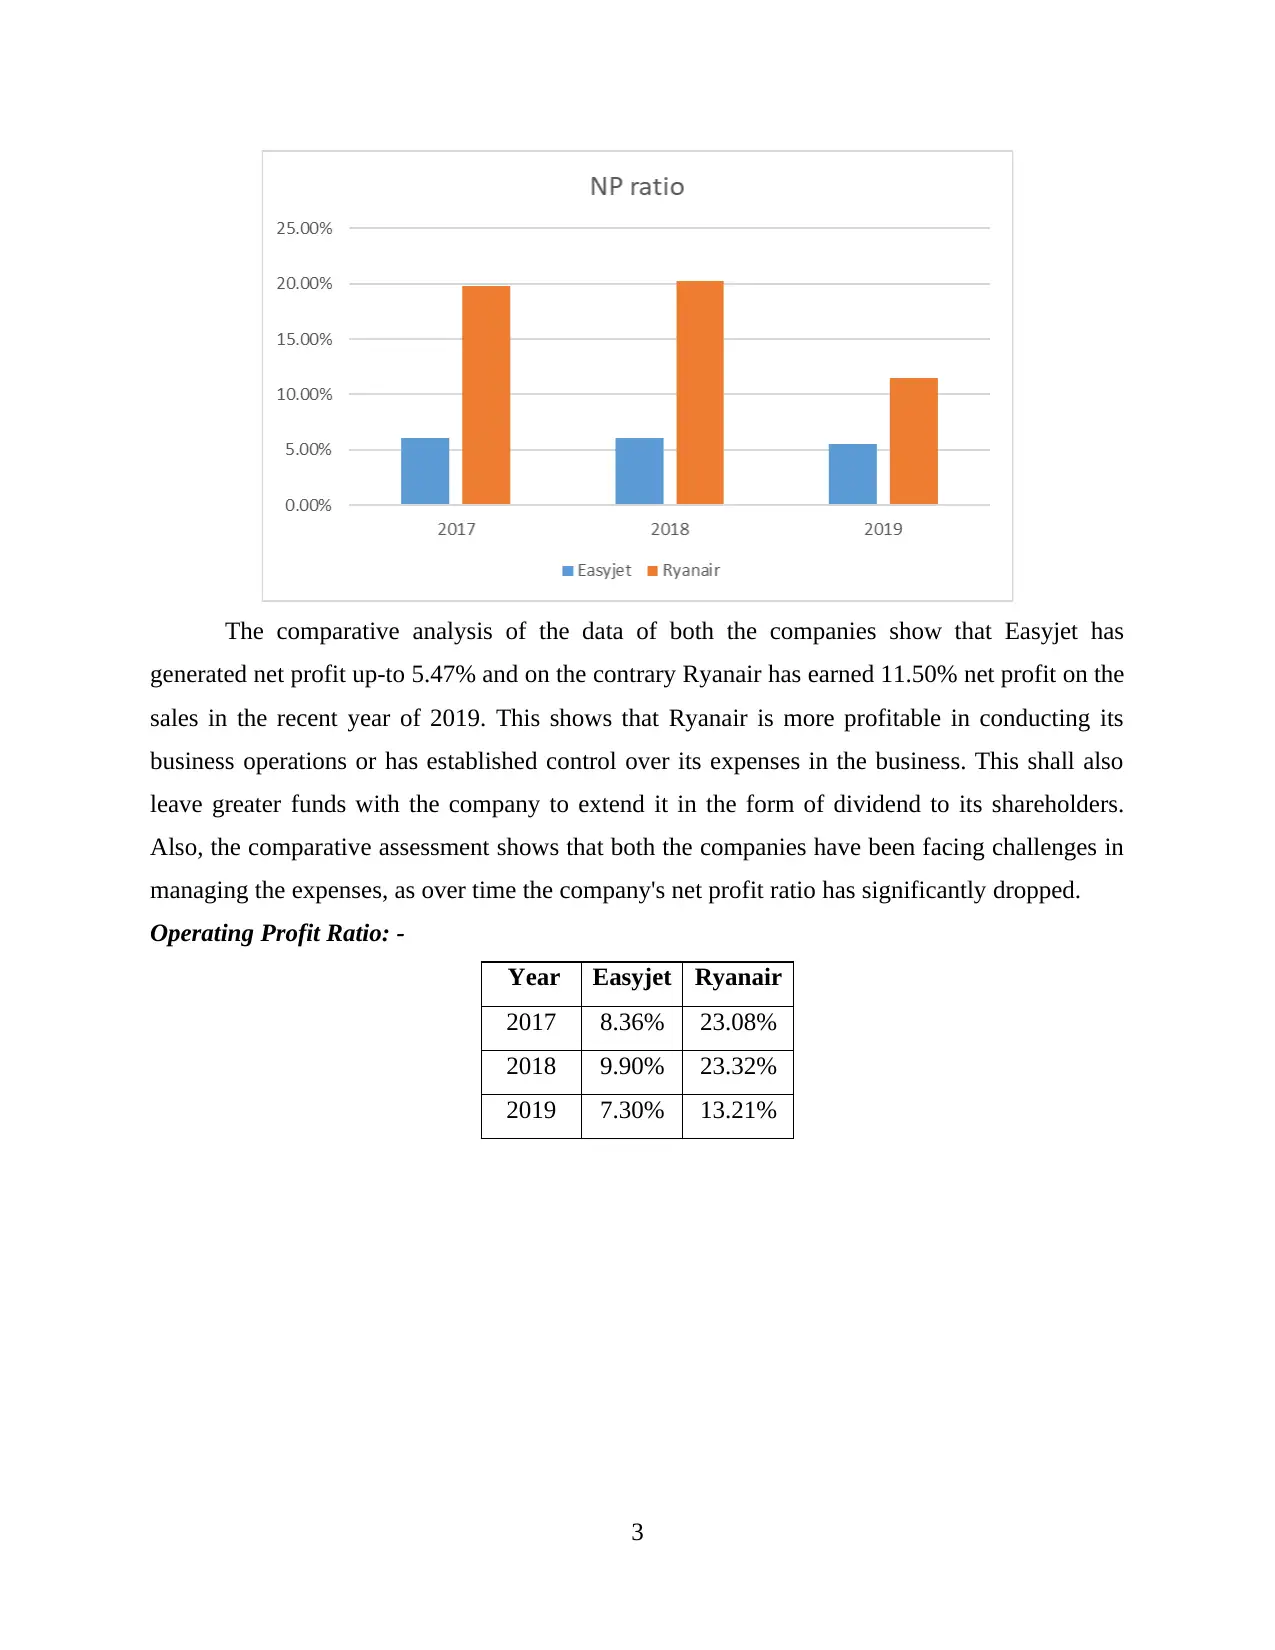
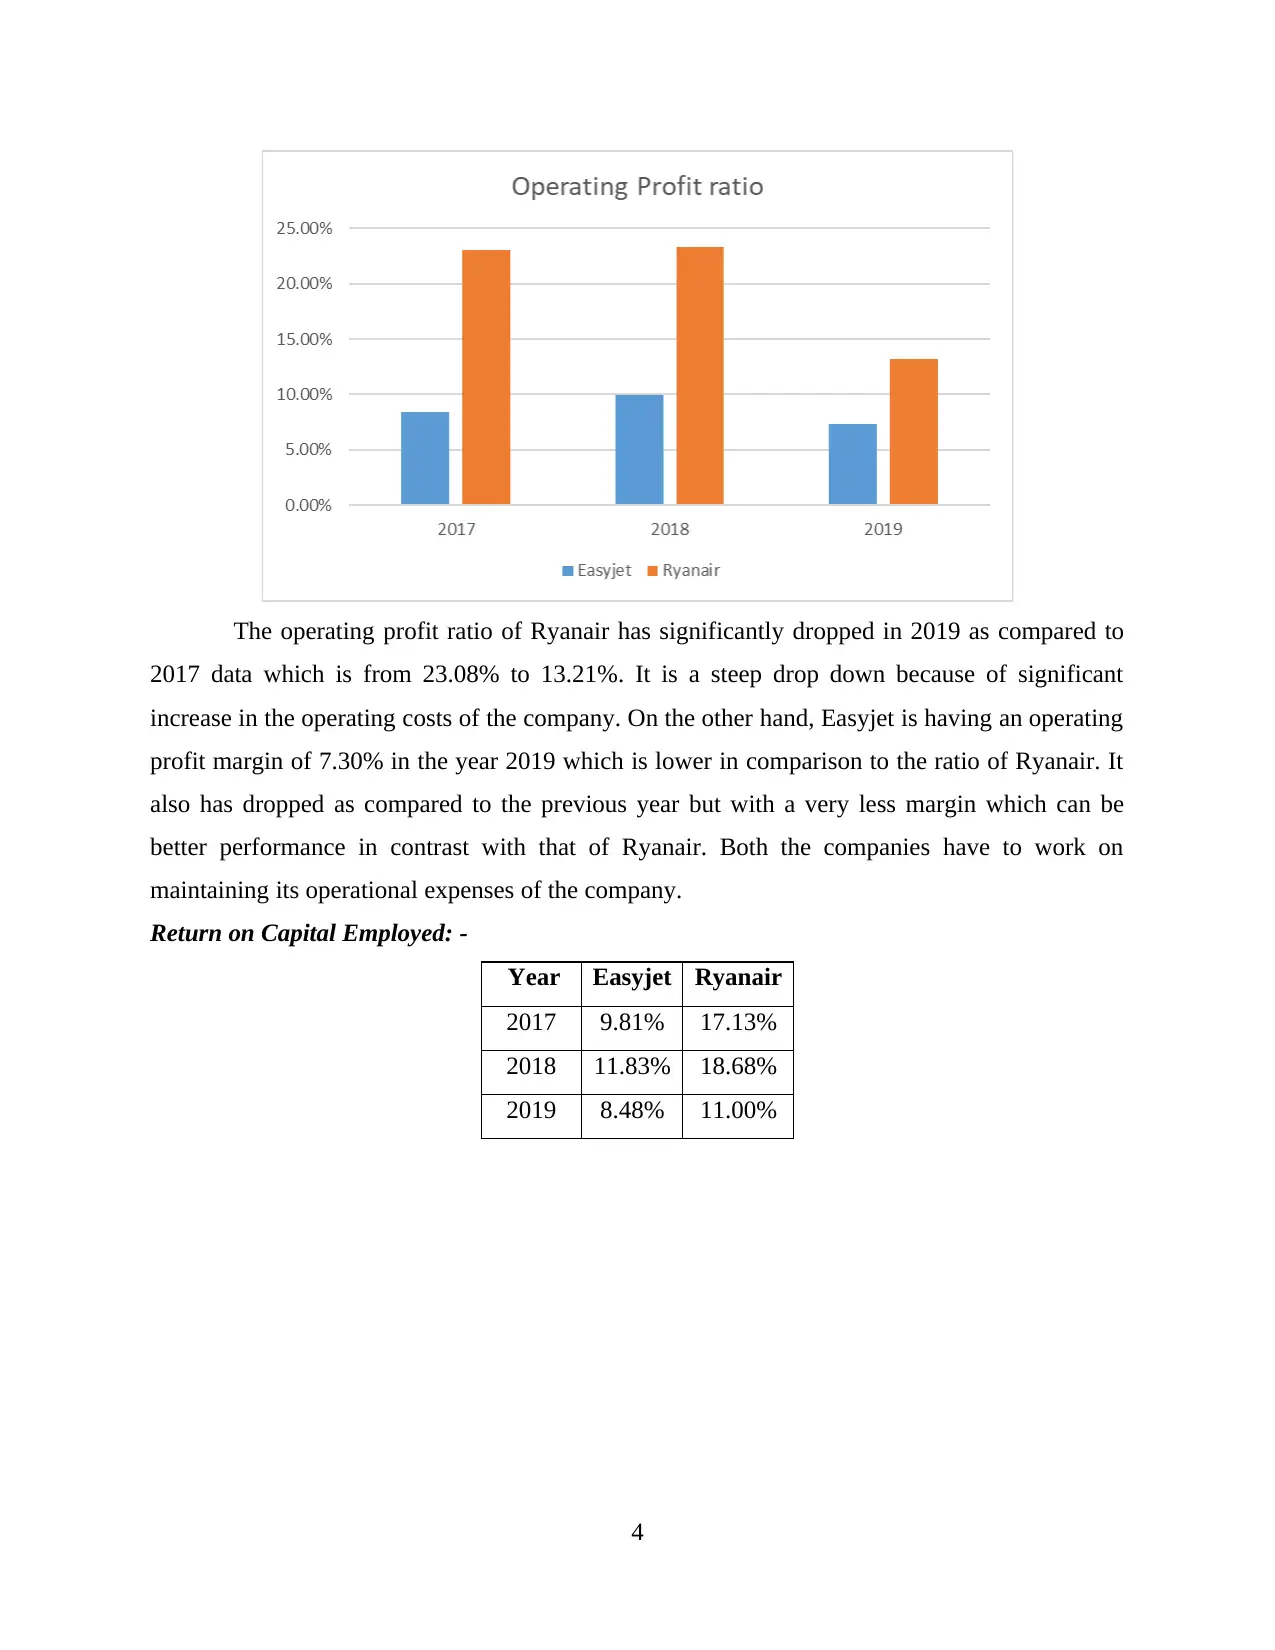
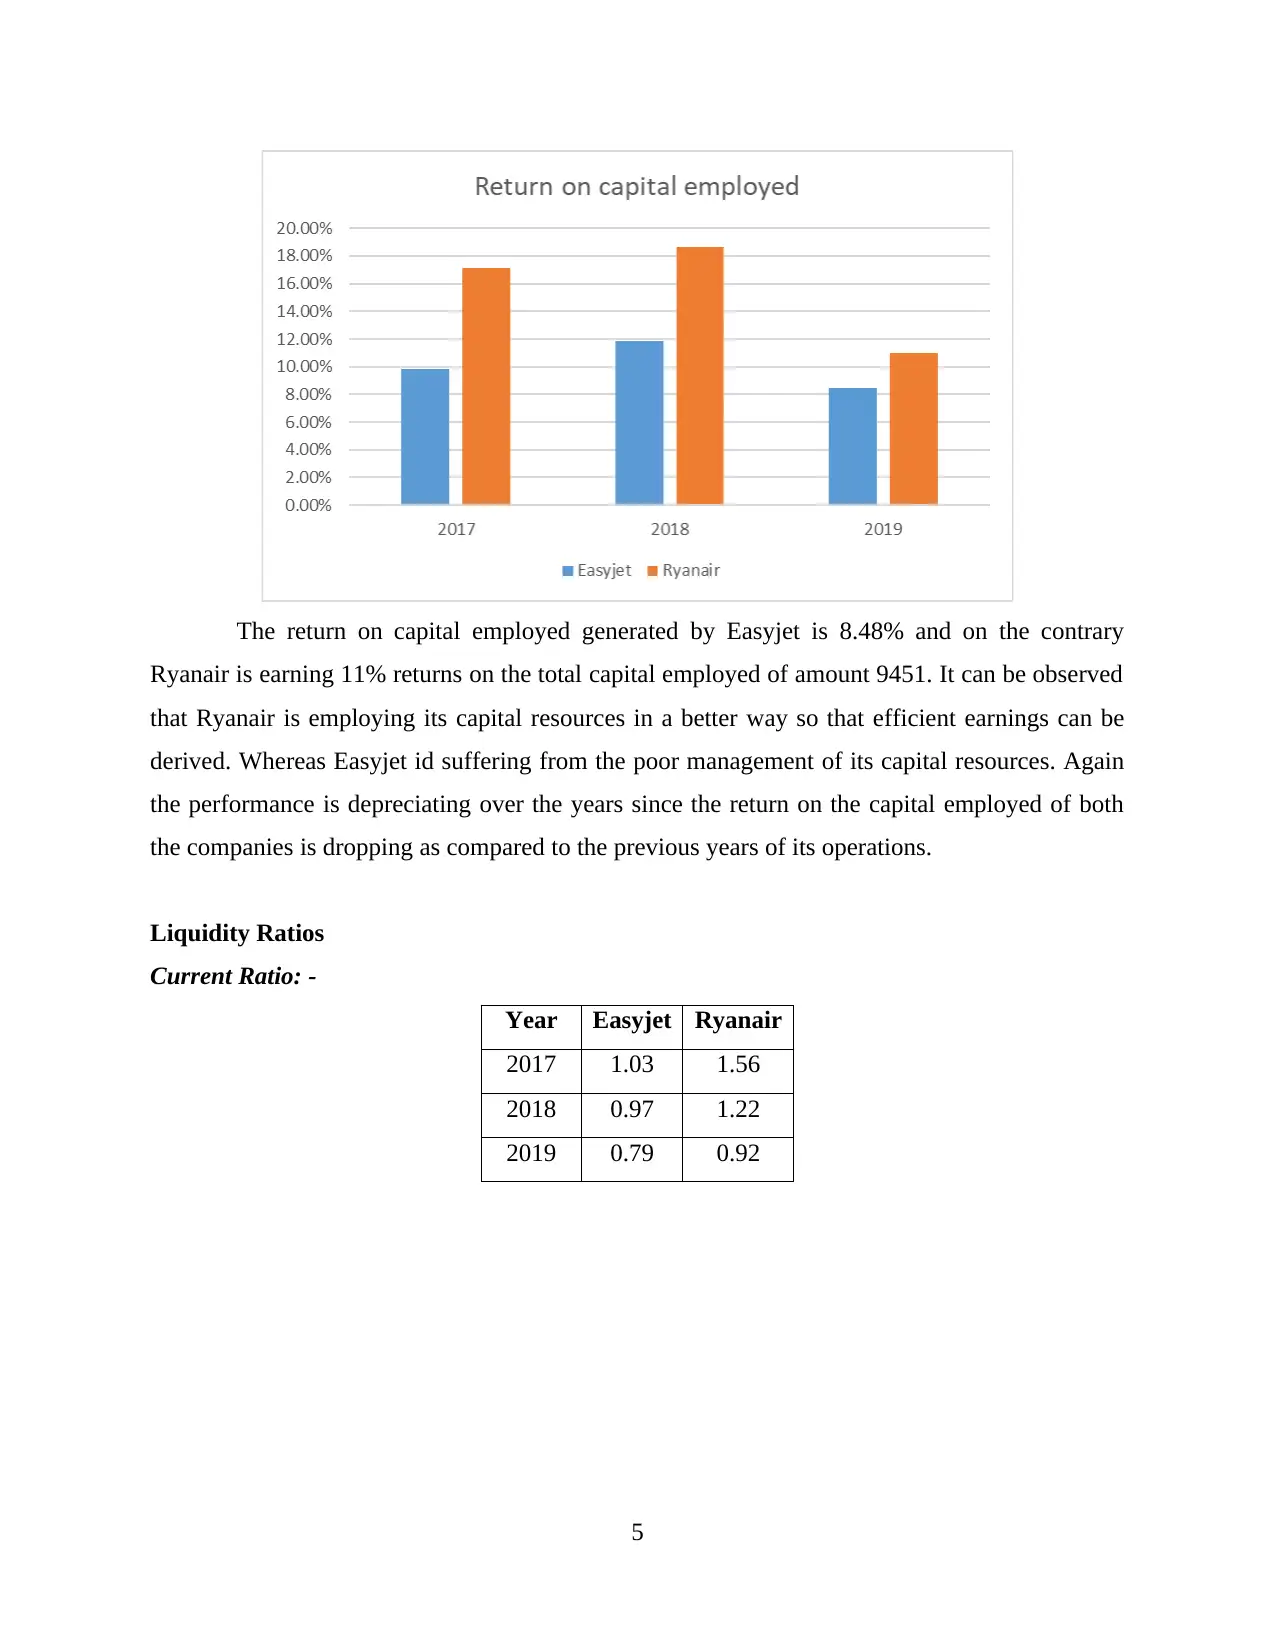
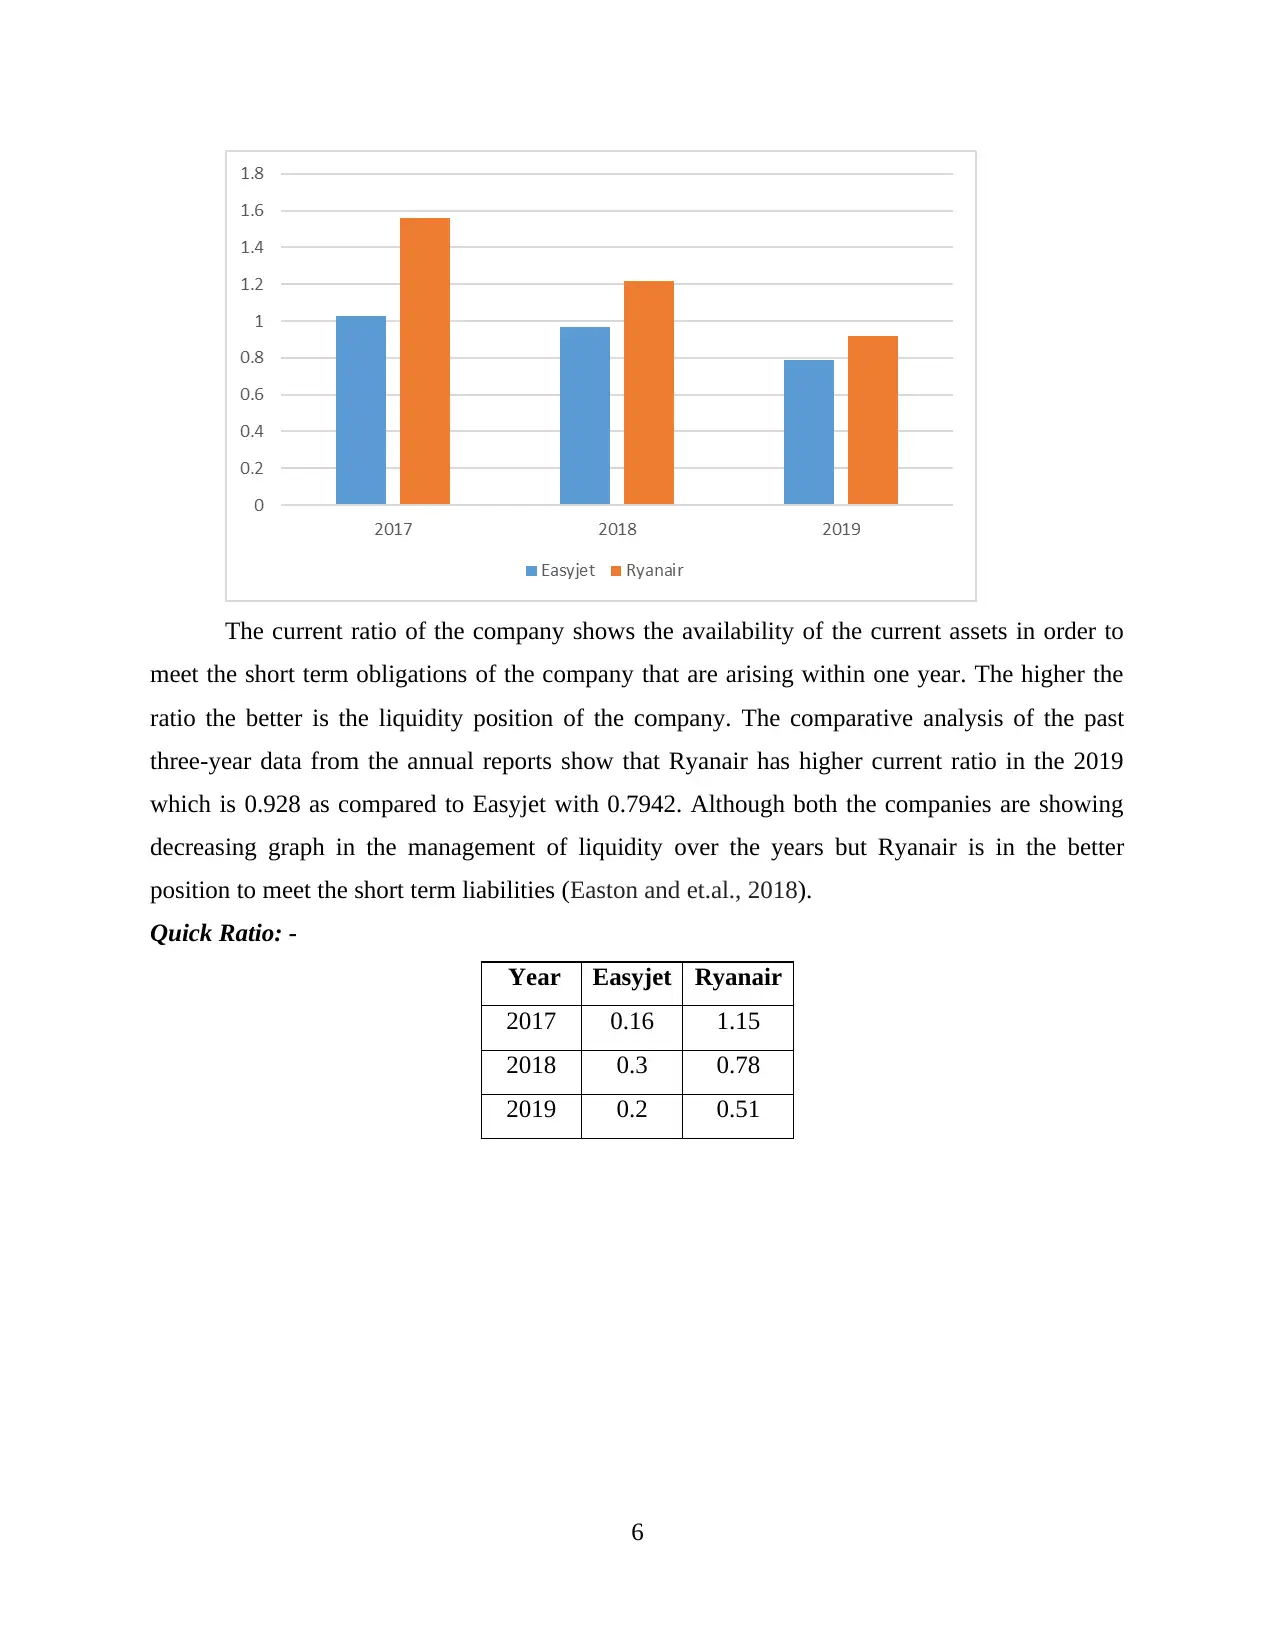
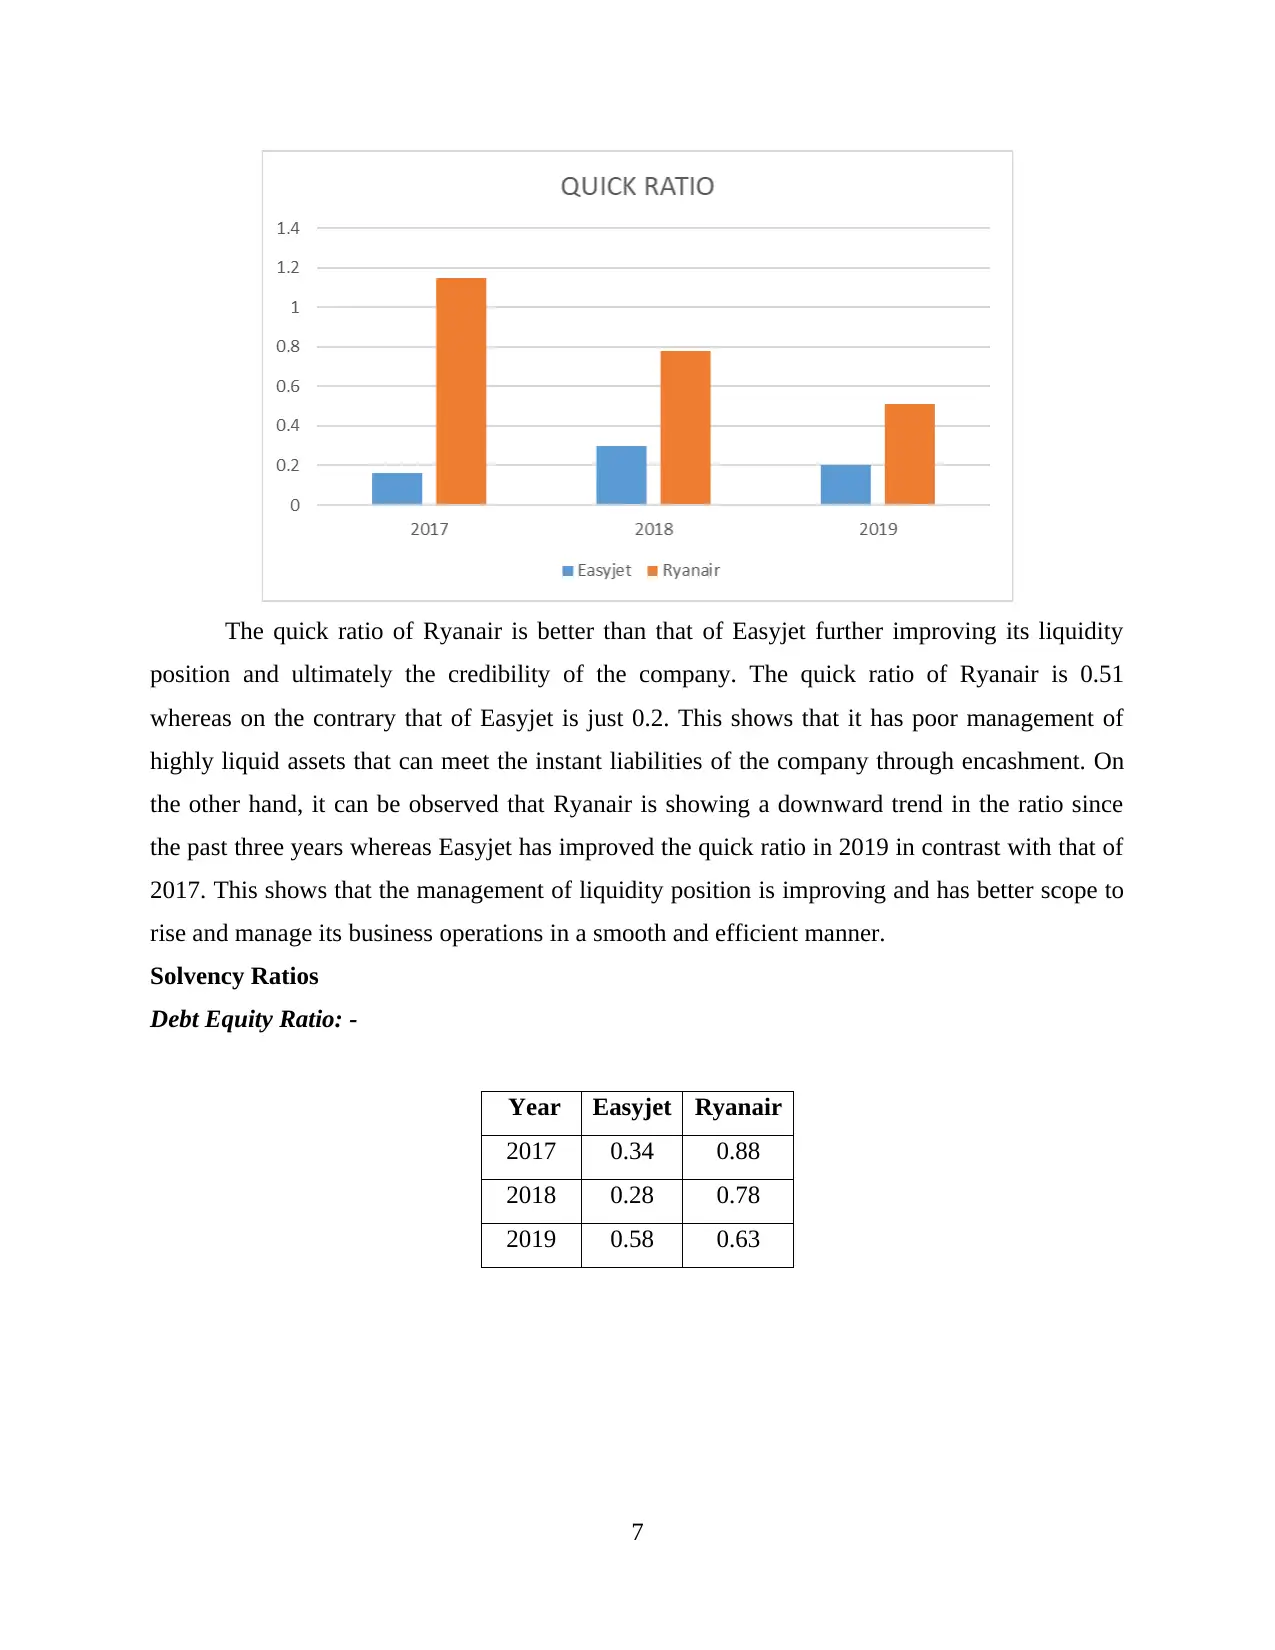
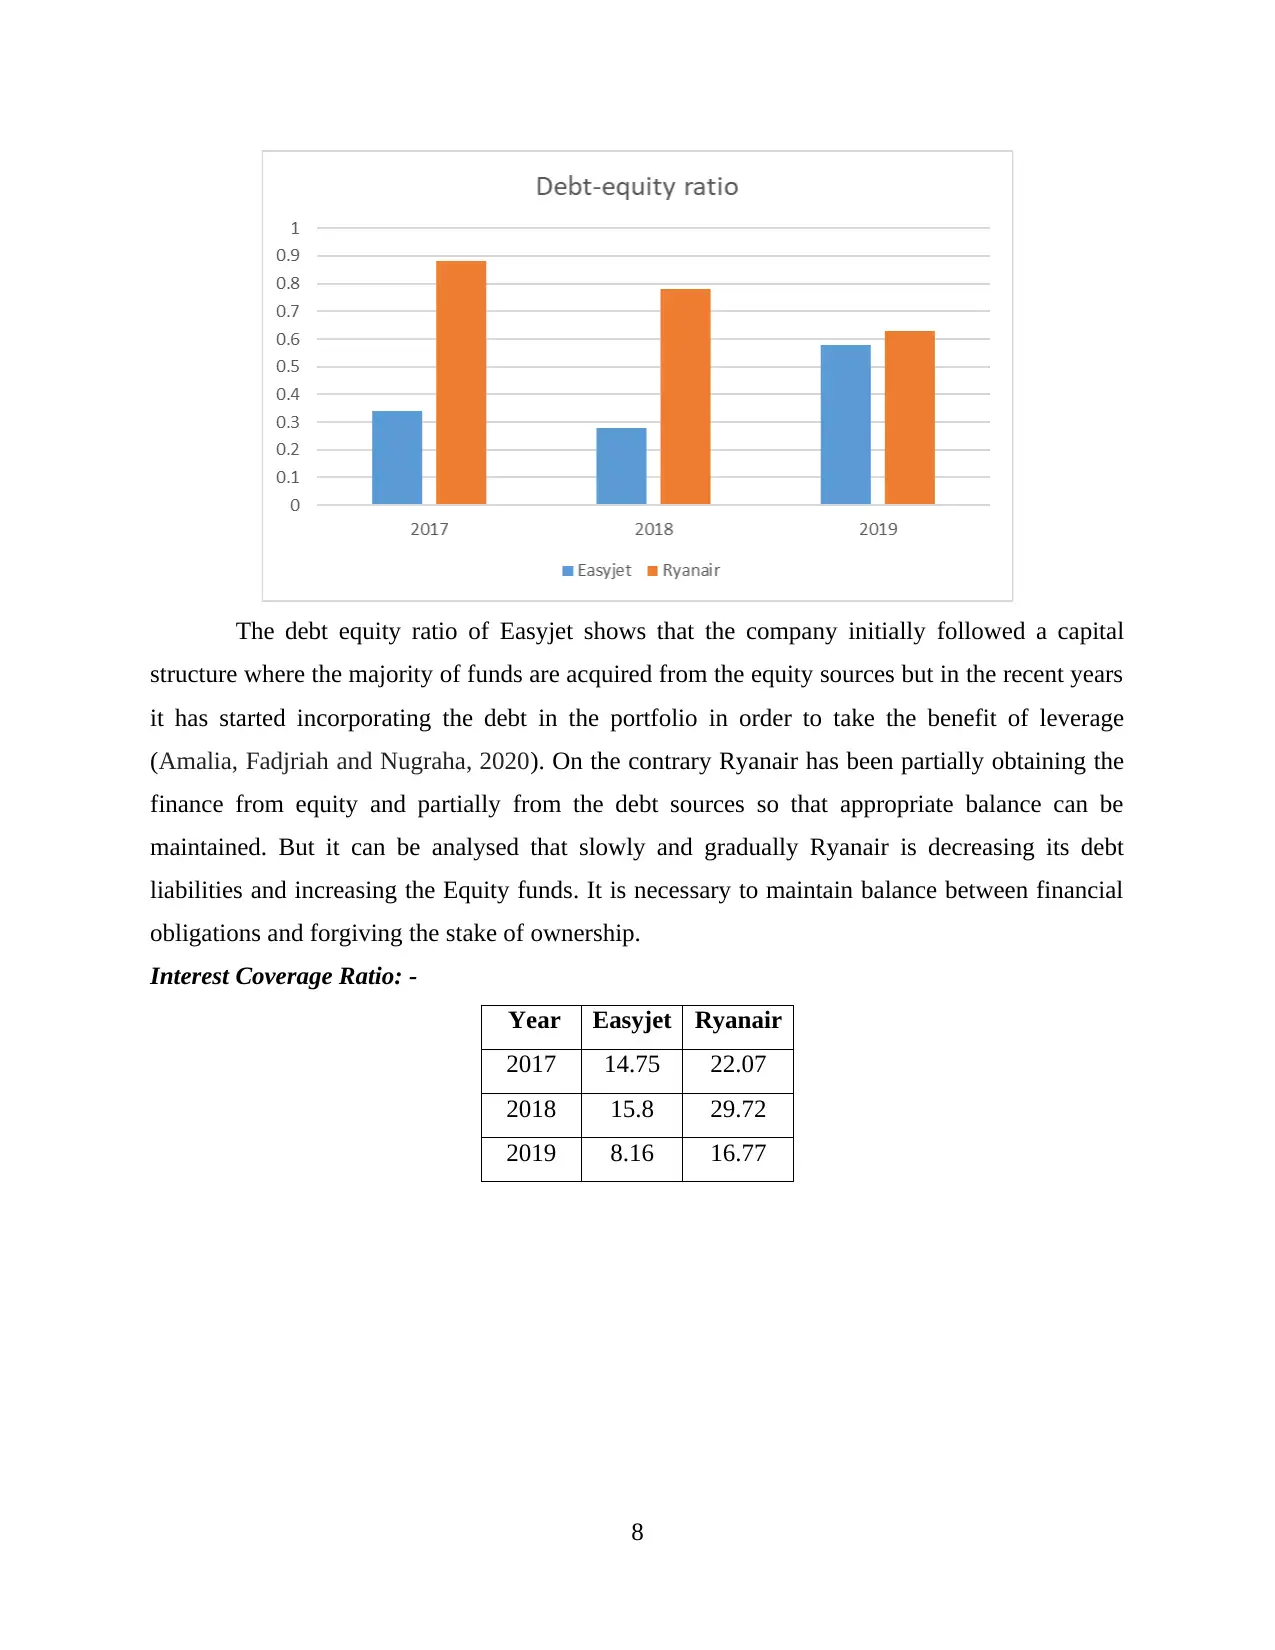
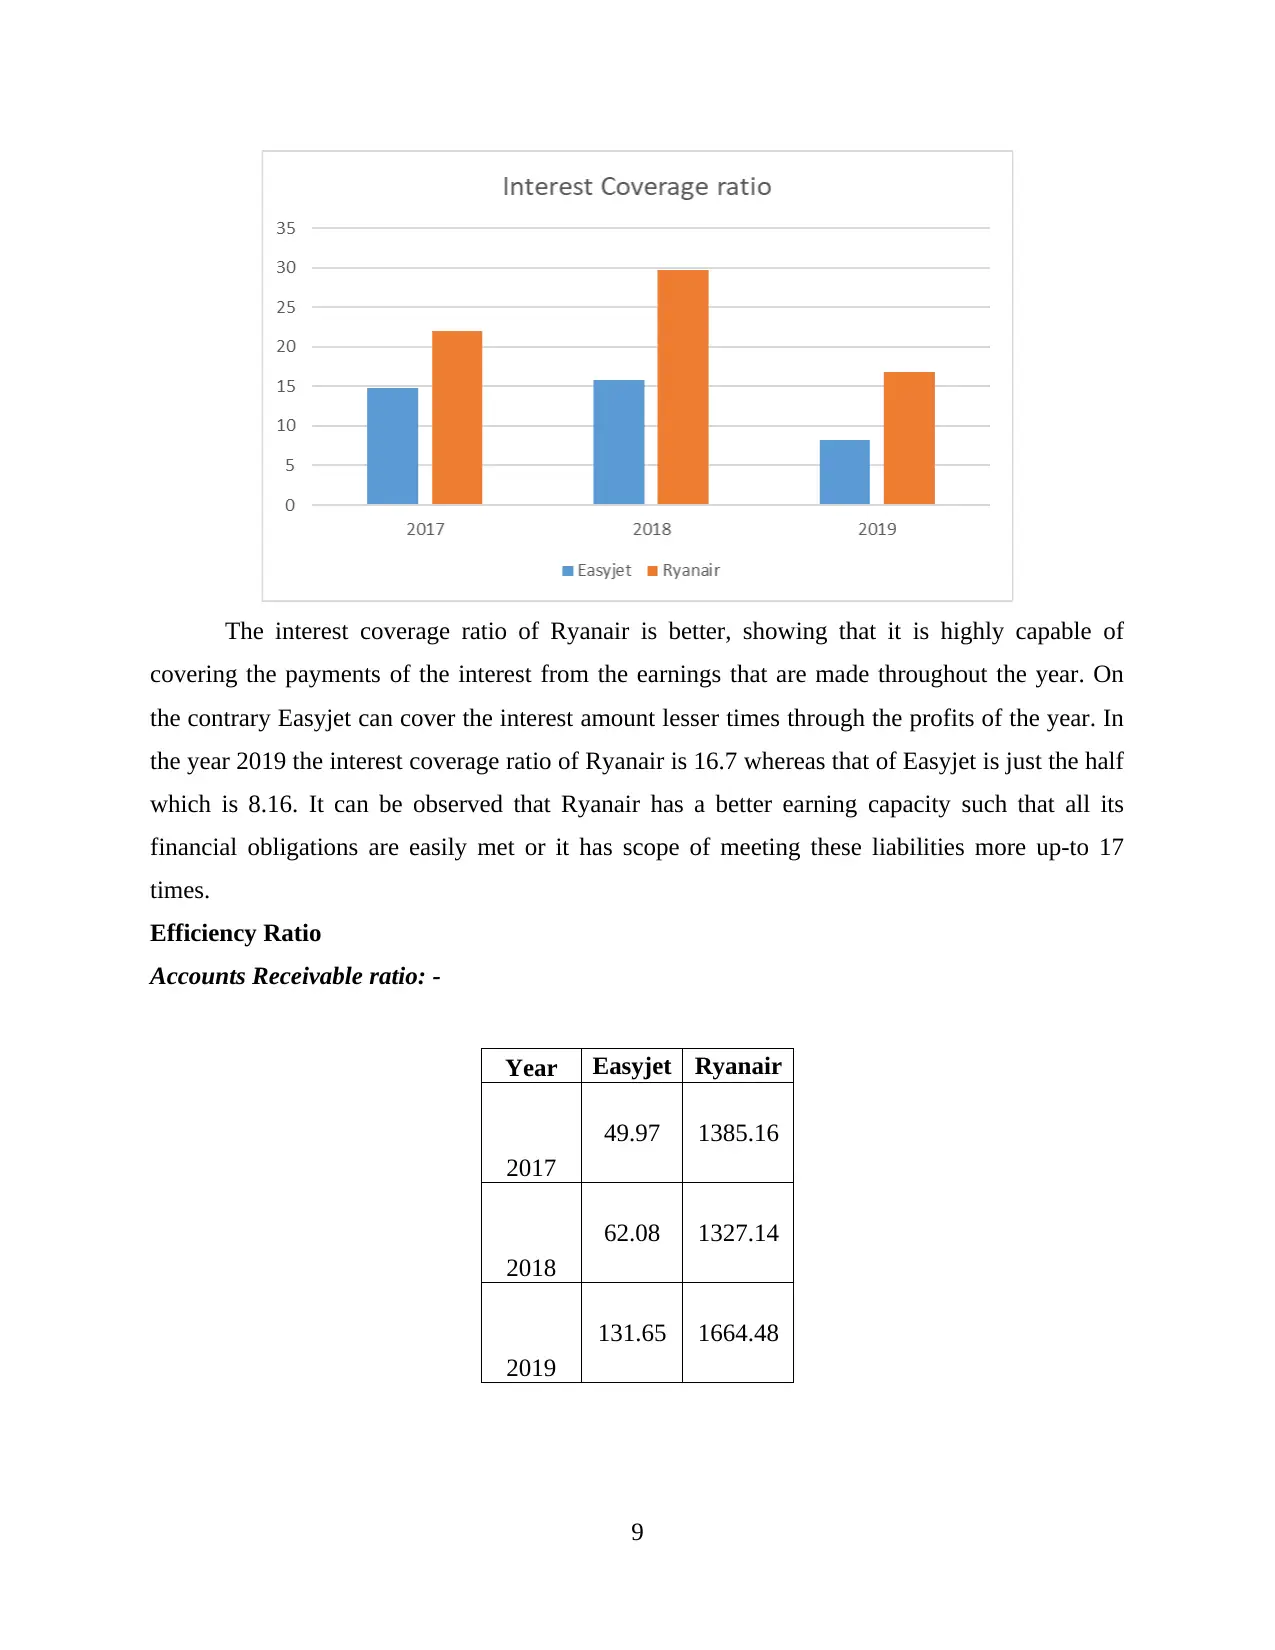
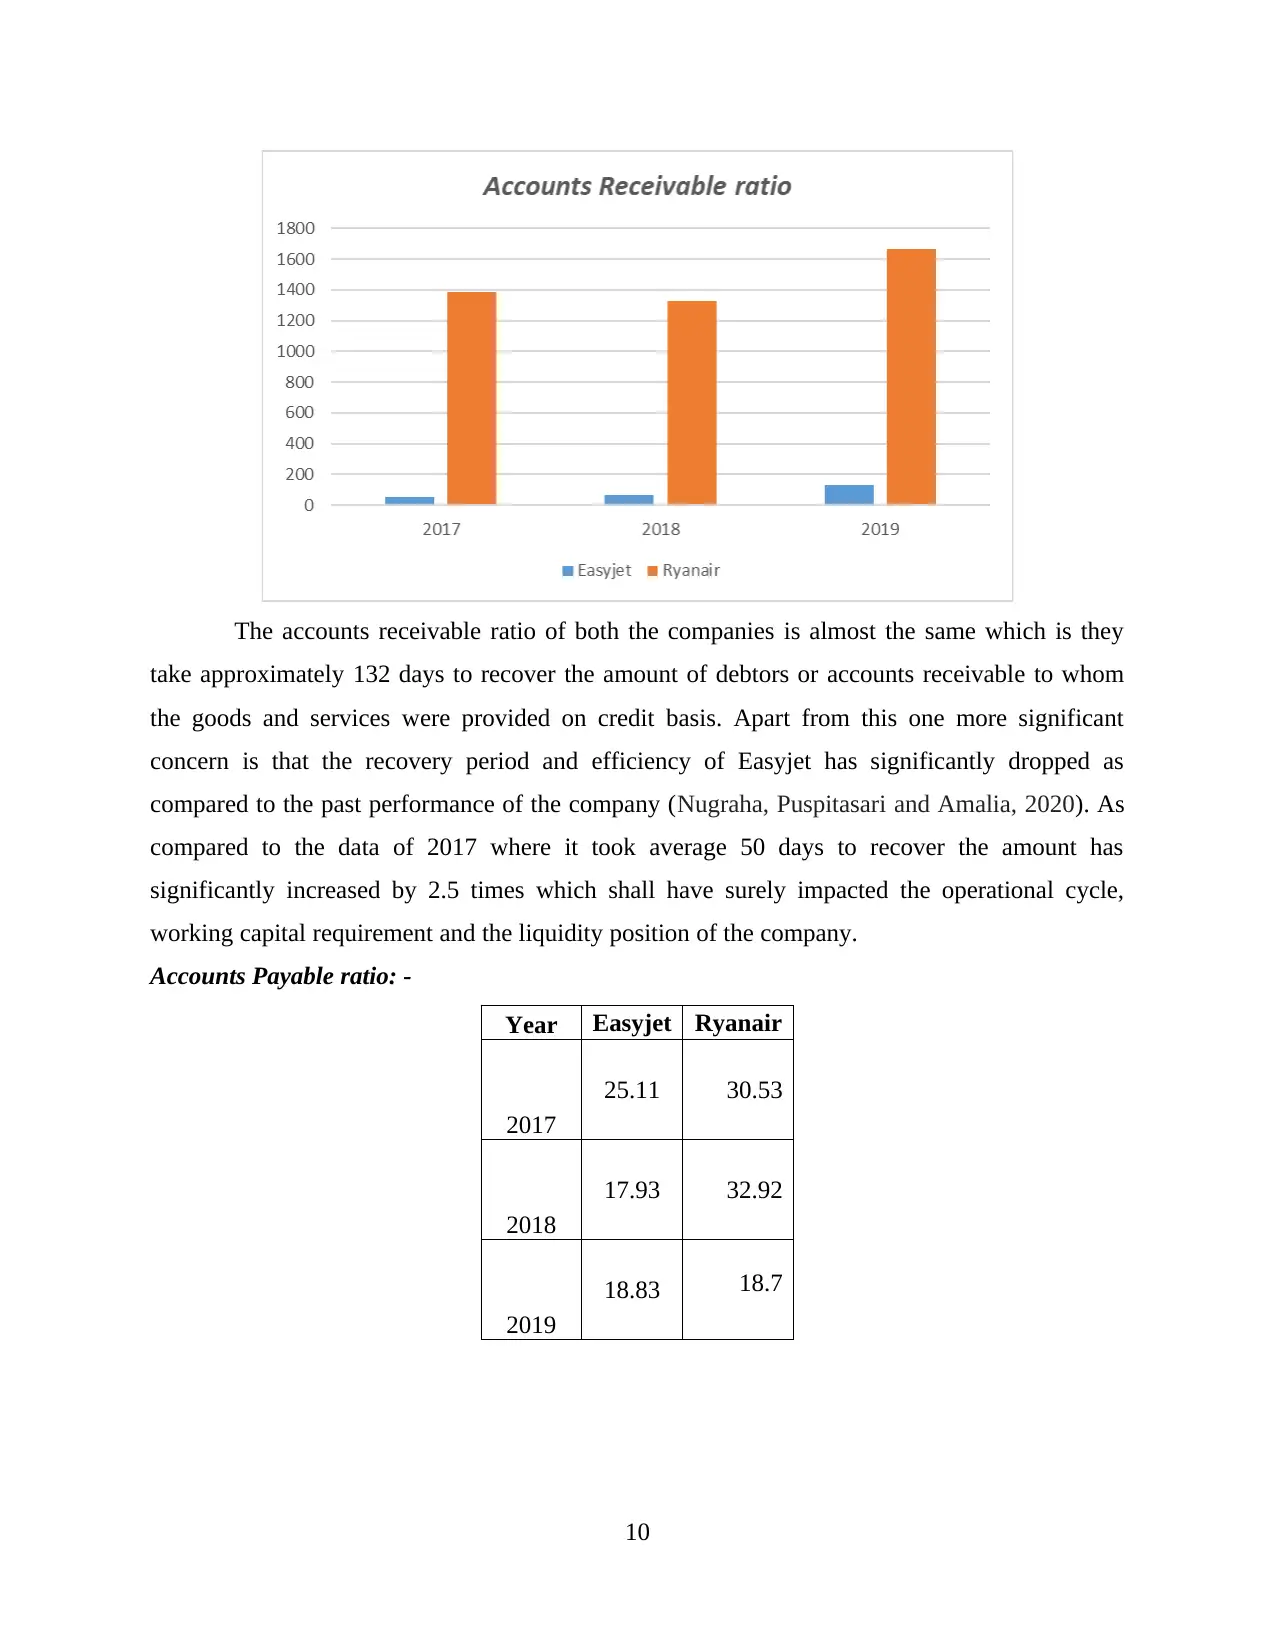
This report conducts a comprehensive financial analysis comparing the performance of Ryanair and EasyJet over a three-year period. It delves into profitability, liquidity, solvency, and efficiency ratios, utilizing data extracted from their respective annual reports. The analysis includes a comparative assessment of key financial metrics, highlighting strengths and weaknesses of each airline. The report also evaluates the corporate strategies of both companies and their future growth prospects, providing recommendations for a prospective long-term investor to identify the most attractive investment opportunity. Furthermore, the report includes calculations and interpretations of various financial ratios to evaluate the operational efficiency, financial health, and strategic direction of both airlines, offering insights into their market positions and potential for future success.

FINANCIAL ANALYSIS
MANAGEMENT AND ENTERPRISE
Paraphrase This Document
Need a fresh take? Get an instant paraphrase of this document with our AI Paraphraser

TABLE OF CONTENTS
INTRODUCTION...........................................................................................................................1
1. Conducting a financial analysis using the financial statements of Ryanair and EasyJet Plc ..1
2. Critically evaluating the corporate strategy undertaken by the concerned companies and
their future prospects ...............................................................................................................16
CONCLUSION..............................................................................................................................20
RECOMMENDATIONS...............................................................................................................20
REFERENCES..............................................................................................................................22
APPENDICES...............................................................................................................................24

INTRODUCTION
Financial analysis is reviewing the financial statements of the company wherein the
performance and well-being of the company is identified. Also, the comparative analysis is
conducted with competitors through ratio analysis which helps in knowing the inefficiencies and
taking the corrective actions by the respective company. The project shall be considering the past
three years’ data of two companies one is Easyjet and the other is the Ryanair. The annual
reports of the companies shall be extracted which shall be used in the ratio analysis of both the
airline companies. Further it shall reflect the comparative analysis based on the calculated ratios
of the financial statements. This shall highlight the inefficiencies that are pertaining to the
operations of the company and respectively the corrective actions shall be taken to improvise the
deviations that are caused to the business. Apart from this certain recommendation shall be
provided to the company based on their financial performance. Also, the prospective of the long
term investor shall be observed in respect of the company and shall be suggested with the most
attractive organization. Lastly the report shall be identifying the corporate strategy that is
followed by the business and the future growth prospects that the companies are planning to
undertake.
1. Conducting a financial analysis using the financial statements of Ryanair and EasyJet Plc
Profitability Ratios
Gross Profit Ratio: -
Year Easyjet Ryanair
2017 21.99% 35.40%
2018 24.38% 36.89%
2019 24.26% 28.64%
1
⊘ This is a preview!⊘
Do you want full access?
Subscribe today to unlock all pages.

Trusted by 1+ million students worldwide

The gross profit ratio earned by Easyjet on the sales that are undertaken over the year is
24.26% as per the data of 2019. On the other hand, Ryanair has been able to capitalize 28.64% of
the revenue from operations as the amount of gross profit. The comparative analysis shows that
Ryanair has higher gross profit after reducing its cost of operations and this can be due to
maximized level of the operational efficiency (Nufus and et.al., 2020). Another important fact is
that the gross profit ratio is showing an increasing statistic as compared to the past year whereas
the Ryanair is decreasing over the years.
Net Profit Ratio: -
Year Easyjet Ryanair
2017 6.04% 19.79%
2018 6.07% 20.28%
2019 5.47% 11.50%
2
Paraphrase This Document
Need a fresh take? Get an instant paraphrase of this document with our AI Paraphraser

The comparative analysis of the data of both the companies show that Easyjet has
generated net profit up-to 5.47% and on the contrary Ryanair has earned 11.50% net profit on the
sales in the recent year of 2019. This shows that Ryanair is more profitable in conducting its
business operations or has established control over its expenses in the business. This shall also
leave greater funds with the company to extend it in the form of dividend to its shareholders.
Also, the comparative assessment shows that both the companies have been facing challenges in
managing the expenses, as over time the company's net profit ratio has significantly dropped.
Operating Profit Ratio: -
Year Easyjet Ryanair
2017 8.36% 23.08%
2018 9.90% 23.32%
2019 7.30% 13.21%
3

The operating profit ratio of Ryanair has significantly dropped in 2019 as compared to
2017 data which is from 23.08% to 13.21%. It is a steep drop down because of significant
increase in the operating costs of the company. On the other hand, Easyjet is having an operating
profit margin of 7.30% in the year 2019 which is lower in comparison to the ratio of Ryanair. It
also has dropped as compared to the previous year but with a very less margin which can be
better performance in contrast with that of Ryanair. Both the companies have to work on
maintaining its operational expenses of the company.
Return on Capital Employed: -
Year Easyjet Ryanair
2017 9.81% 17.13%
2018 11.83% 18.68%
2019 8.48% 11.00%
4
⊘ This is a preview!⊘
Do you want full access?
Subscribe today to unlock all pages.

Trusted by 1+ million students worldwide

The return on capital employed generated by Easyjet is 8.48% and on the contrary
Ryanair is earning 11% returns on the total capital employed of amount 9451. It can be observed
that Ryanair is employing its capital resources in a better way so that efficient earnings can be
derived. Whereas Easyjet id suffering from the poor management of its capital resources. Again
the performance is depreciating over the years since the return on the capital employed of both
the companies is dropping as compared to the previous years of its operations.
Liquidity Ratios
Current Ratio: -
Year Easyjet Ryanair
2017 1.03 1.56
2018 0.97 1.22
2019 0.79 0.92
5
Paraphrase This Document
Need a fresh take? Get an instant paraphrase of this document with our AI Paraphraser

The current ratio of the company shows the availability of the current assets in order to
meet the short term obligations of the company that are arising within one year. The higher the
ratio the better is the liquidity position of the company. The comparative analysis of the past
three-year data from the annual reports show that Ryanair has higher current ratio in the 2019
which is 0.928 as compared to Easyjet with 0.7942. Although both the companies are showing
decreasing graph in the management of liquidity over the years but Ryanair is in the better
position to meet the short term liabilities (Easton and et.al., 2018).
Quick Ratio: -
Year Easyjet Ryanair
2017 0.16 1.15
2018 0.3 0.78
2019 0.2 0.51
6

The quick ratio of Ryanair is better than that of Easyjet further improving its liquidity
position and ultimately the credibility of the company. The quick ratio of Ryanair is 0.51
whereas on the contrary that of Easyjet is just 0.2. This shows that it has poor management of
highly liquid assets that can meet the instant liabilities of the company through encashment. On
the other hand, it can be observed that Ryanair is showing a downward trend in the ratio since
the past three years whereas Easyjet has improved the quick ratio in 2019 in contrast with that of
2017. This shows that the management of liquidity position is improving and has better scope to
rise and manage its business operations in a smooth and efficient manner.
Solvency Ratios
Debt Equity Ratio: -
Year Easyjet Ryanair
2017 0.34 0.88
2018 0.28 0.78
2019 0.58 0.63
7
⊘ This is a preview!⊘
Do you want full access?
Subscribe today to unlock all pages.

Trusted by 1+ million students worldwide

The debt equity ratio of Easyjet shows that the company initially followed a capital
structure where the majority of funds are acquired from the equity sources but in the recent years
it has started incorporating the debt in the portfolio in order to take the benefit of leverage
(Amalia, Fadjriah and Nugraha, 2020). On the contrary Ryanair has been partially obtaining the
finance from equity and partially from the debt sources so that appropriate balance can be
maintained. But it can be analysed that slowly and gradually Ryanair is decreasing its debt
liabilities and increasing the Equity funds. It is necessary to maintain balance between financial
obligations and forgiving the stake of ownership.
Interest Coverage Ratio: -
Year Easyjet Ryanair
2017 14.75 22.07
2018 15.8 29.72
2019 8.16 16.77
8
Paraphrase This Document
Need a fresh take? Get an instant paraphrase of this document with our AI Paraphraser

The interest coverage ratio of Ryanair is better, showing that it is highly capable of
covering the payments of the interest from the earnings that are made throughout the year. On
the contrary Easyjet can cover the interest amount lesser times through the profits of the year. In
the year 2019 the interest coverage ratio of Ryanair is 16.7 whereas that of Easyjet is just the half
which is 8.16. It can be observed that Ryanair has a better earning capacity such that all its
financial obligations are easily met or it has scope of meeting these liabilities more up-to 17
times.
Efficiency Ratio
Accounts Receivable ratio: -
Year Easyjet Ryanair
2017
49.97 1385.16
2018
62.08 1327.14
2019
131.65 1664.48
9

The accounts receivable ratio of both the companies is almost the same which is they
take approximately 132 days to recover the amount of debtors or accounts receivable to whom
the goods and services were provided on credit basis. Apart from this one more significant
concern is that the recovery period and efficiency of Easyjet has significantly dropped as
compared to the past performance of the company (Nugraha, Puspitasari and Amalia, 2020). As
compared to the data of 2017 where it took average 50 days to recover the amount has
significantly increased by 2.5 times which shall have surely impacted the operational cycle,
working capital requirement and the liquidity position of the company.
Accounts Payable ratio: -
Year Easyjet Ryanair
2017
25.11 30.53
2018
17.93 32.92
2019
18.83 18.7
10
⊘ This is a preview!⊘
Do you want full access?
Subscribe today to unlock all pages.

Trusted by 1+ million students worldwide
1 out of 32
Related Documents

Your All-in-One AI-Powered Toolkit for Academic Success.
 +13062052269
info@desklib.com
Available 24*7 on WhatsApp / Email
Unlock your academic potential
Copyright © 2020–2025 A2Z Services. All Rights Reserved. Developed and managed by ZUCOL.