Financial and Operational Analysis of Ryanair: A Comprehensive Report
VerifiedAdded on 2021/04/21
|20
|2340
|39
Report
AI Summary
This report offers a comprehensive analysis of Ryanair's financial and operational performance. It delves into the airline's financial health using various ratios like current and debt-equity ratios, as well as operational metrics such as RASM, CASM, and revenue trends. The report also includes a SWOT analysis to identify strengths, weaknesses, opportunities, and threats. Benchmarking against Norwegian Air Shuttle provides comparative insights. Finally, the report concludes with recommendations for improvement, focusing on financial stability, customer satisfaction, and market expansion. The analysis covers the period from 2015 to 2016 and highlights key performance indicators and strategic considerations for Ryanair's future.
Running head: AVIATION MANAGEMENT
Aviation Management
Name of the Student:
Name of the University:
Authors Note:
Aviation Management
Name of the Student:
Name of the University:
Authors Note:
Paraphrase This Document
Need a fresh take? Get an instant paraphrase of this document with our AI Paraphraser
AVIATION MANAGEMENT 2
Table of Contents
Introduction:...............................................................................................................................3
Financial Analysis:.....................................................................................................................3
Operational performance analysis of the entity:........................................................................5
SWOT Analysis:........................................................................................................................8
Benchmarking..........................................................................................................................10
Recommendations and suggestions:........................................................................................13
Reference..................................................................................................................................15
Appendix 1. Profit and loss statement of the company:..........................................................17
Appendix 2: Consolidated financial position...........................................................................18
Appendix 3: Financial statement of Ryan Air..........................................................................19
AVIATION MANAGEMENT 3
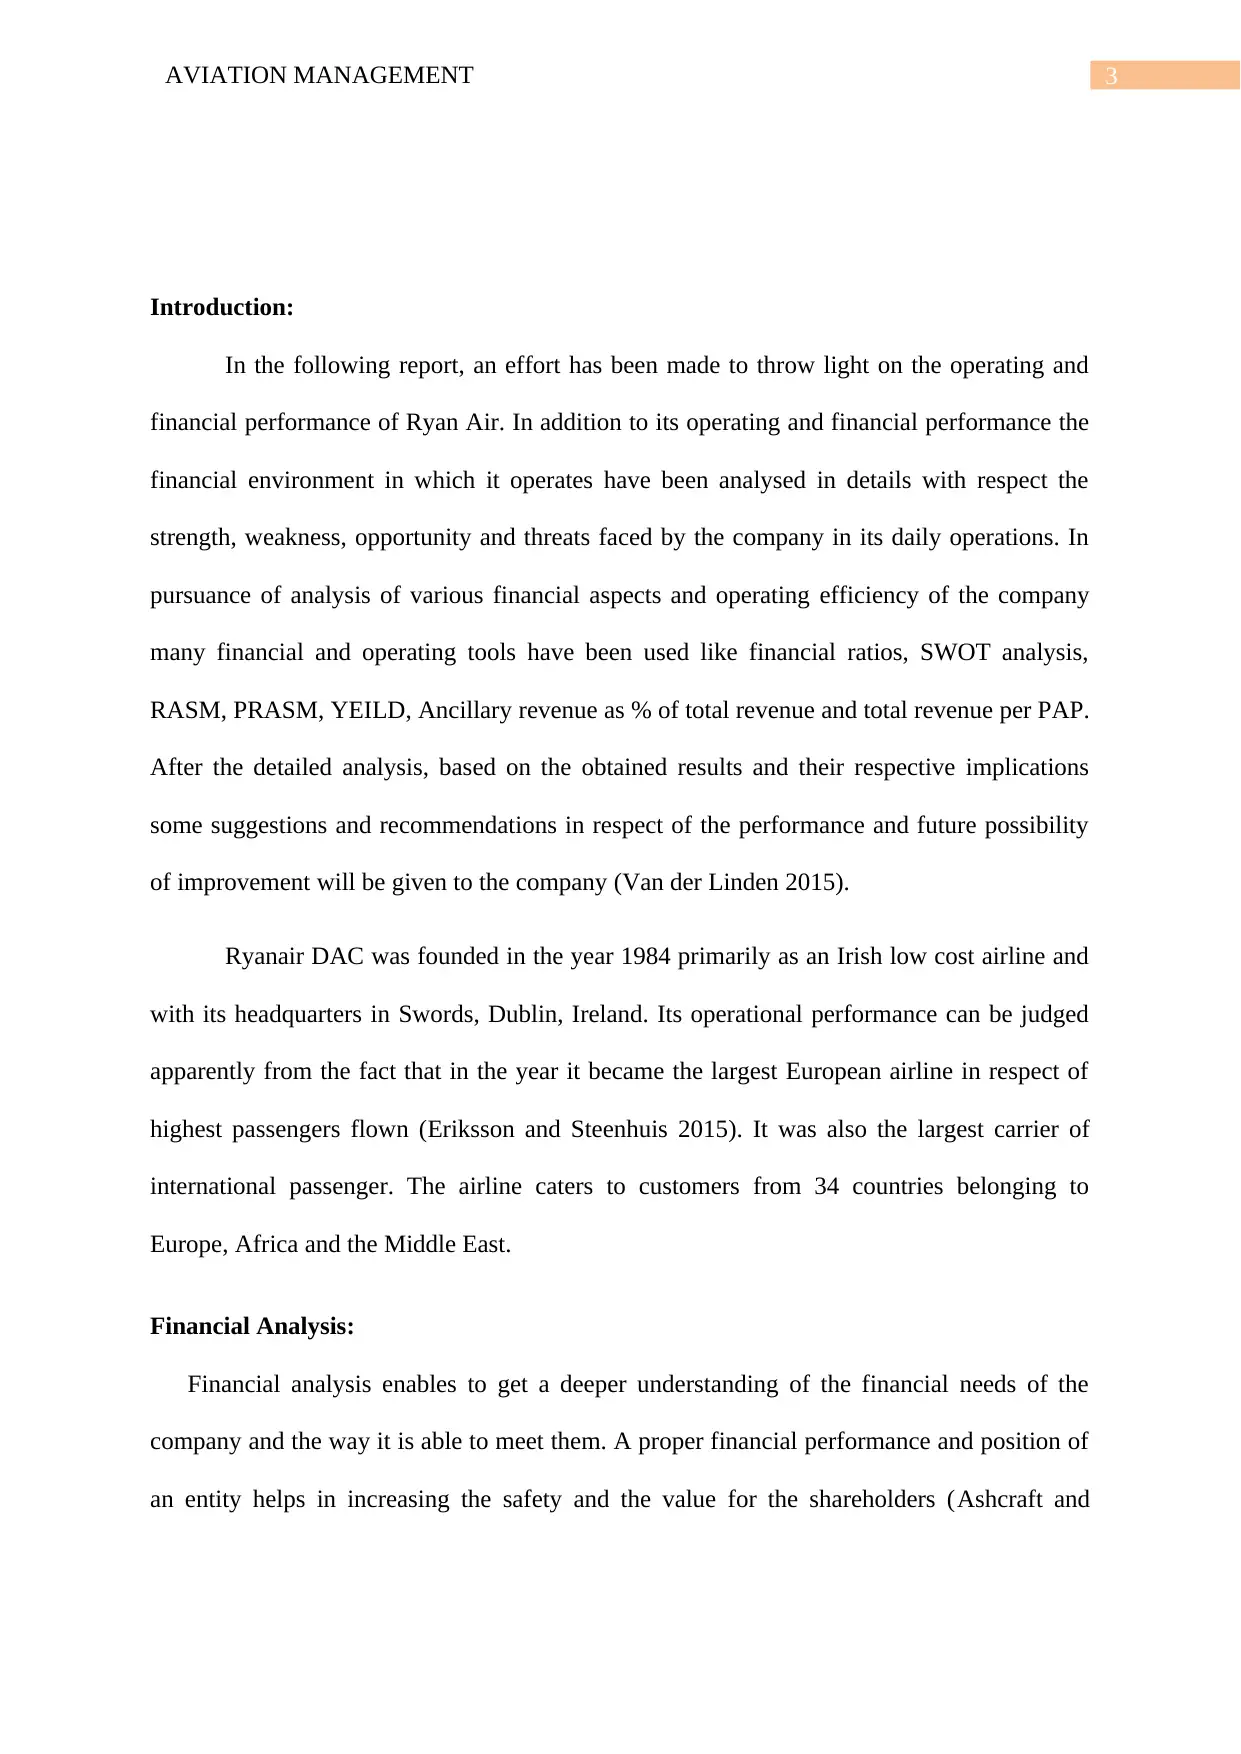
Introduction:
In the following report, an effort has been made to throw light on the operating and
financial performance of Ryan Air. In addition to its operating and financial performance the
financial environment in which it operates have been analysed in details with respect the
strength, weakness, opportunity and threats faced by the company in its daily operations. In
pursuance of analysis of various financial aspects and operating efficiency of the company
many financial and operating tools have been used like financial ratios, SWOT analysis,
RASM, PRASM, YEILD, Ancillary revenue as % of total revenue and total revenue per PAP.
After the detailed analysis, based on the obtained results and their respective implications
some suggestions and recommendations in respect of the performance and future possibility
of improvement will be given to the company (Van der Linden 2015).
Ryanair DAC was founded in the year 1984 primarily as an Irish low cost airline and
with its headquarters in Swords, Dublin, Ireland. Its operational performance can be judged
apparently from the fact that in the year it became the largest European airline in respect of
highest passengers flown (Eriksson and Steenhuis 2015). It was also the largest carrier of
international passenger. The airline caters to customers from 34 countries belonging to
Europe, Africa and the Middle East.
Financial Analysis:
Financial analysis enables to get a deeper understanding of the financial needs of the
company and the way it is able to meet them. A proper financial performance and position of
an entity helps in increasing the safety and the value for the shareholders (Ashcraft and
⊘ This is a preview!⊘
Do you want full access?
Subscribe today to unlock all pages.
Trusted by 1+ million students worldwide
AVIATION MANAGEMENT 4
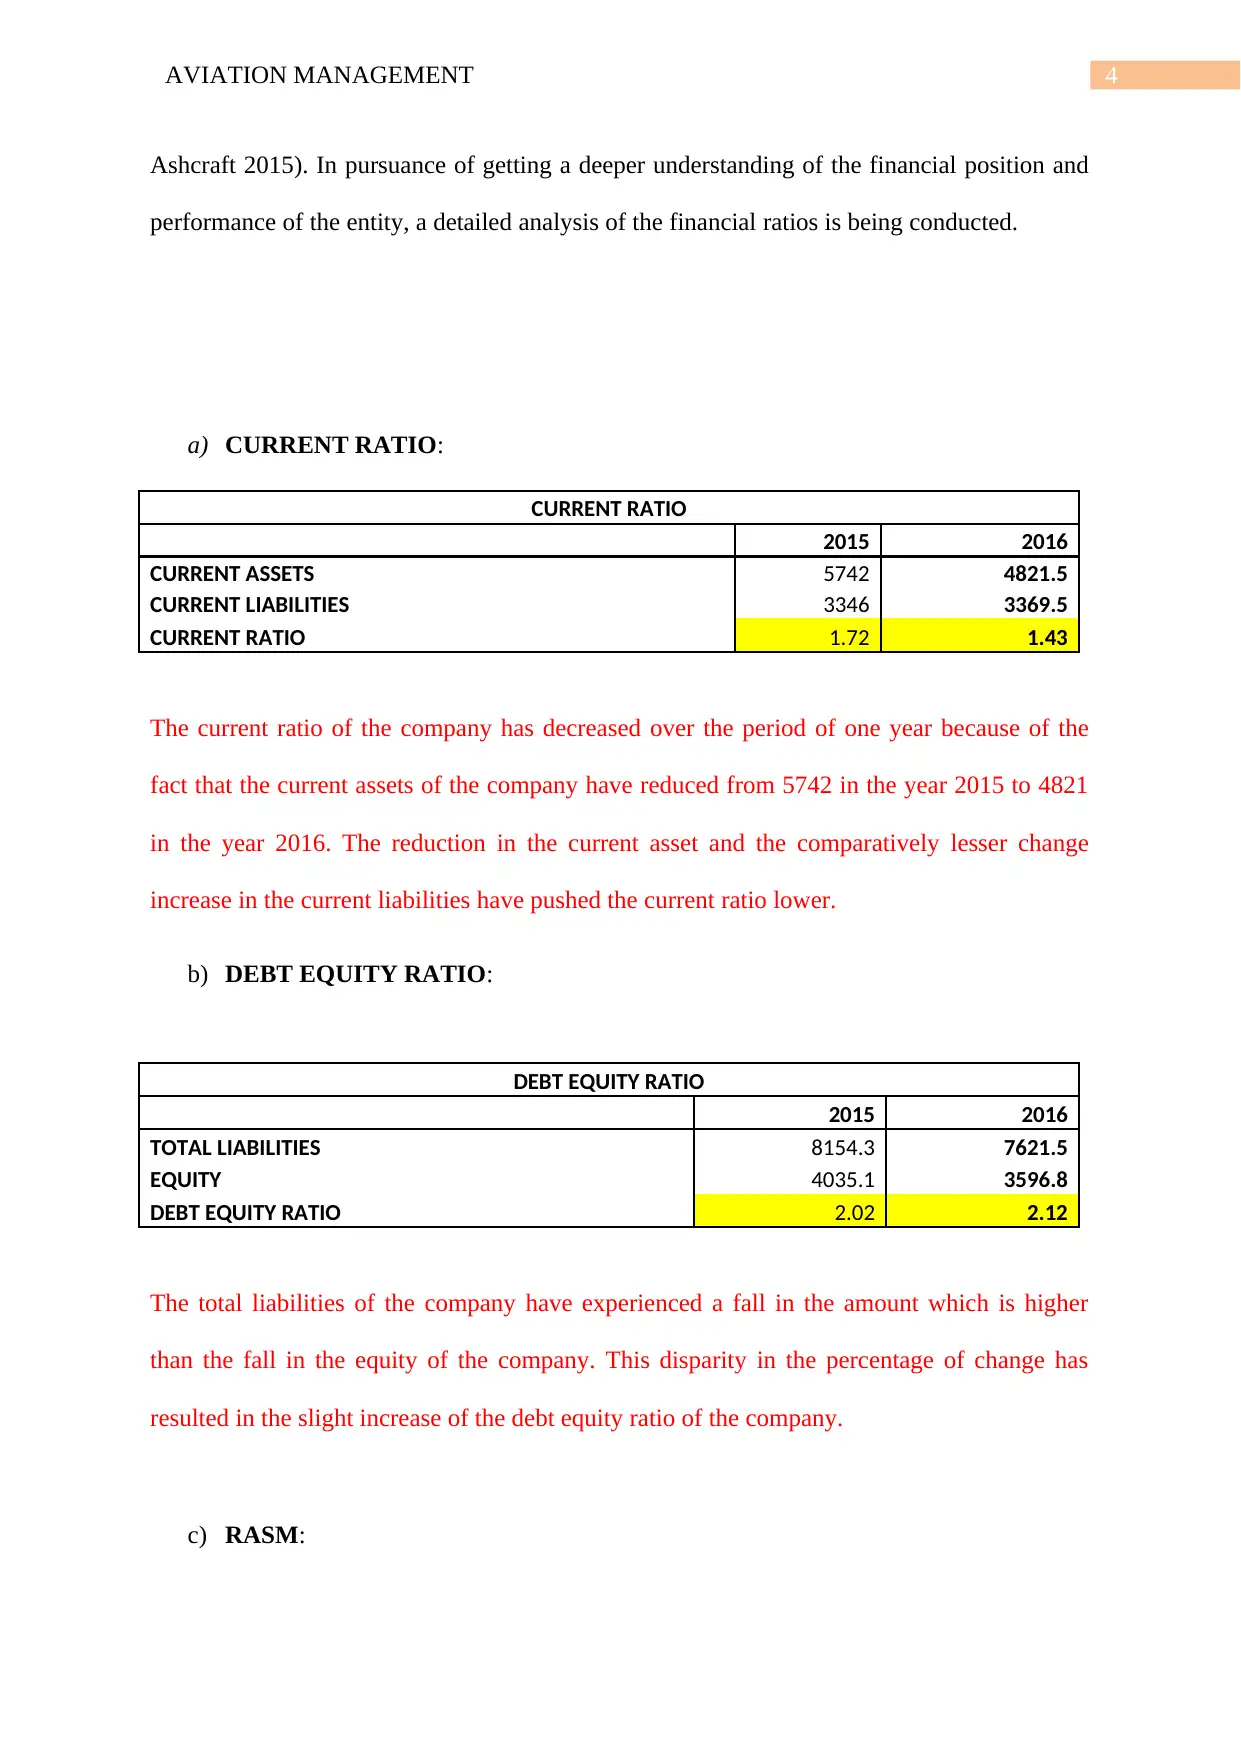
Ashcraft 2015). In pursuance of getting a deeper understanding of the financial position and
performance of the entity, a detailed analysis of the financial ratios is being conducted.
a) CURRENT RATIO:
CURRENT RATIO
2015 2016
CURRENT ASSETS 5742 4821.5
CURRENT LIABILITIES 3346 3369.5
CURRENT RATIO 1.72 1.43
The current ratio of the company has decreased over the period of one year because of the
fact that the current assets of the company have reduced from 5742 in the year 2015 to 4821
in the year 2016. The reduction in the current asset and the comparatively lesser change
increase in the current liabilities have pushed the current ratio lower.
b) DEBT EQUITY RATIO:
DEBT EQUITY RATIO
2015 2016
TOTAL LIABILITIES 8154.3 7621.5
EQUITY 4035.1 3596.8
DEBT EQUITY RATIO 2.02 2.12
The total liabilities of the company have experienced a fall in the amount which is higher
than the fall in the equity of the company. This disparity in the percentage of change has
resulted in the slight increase of the debt equity ratio of the company.
c) RASM:
Ashcraft 2015). In pursuance of getting a deeper understanding of the financial position and
performance of the entity, a detailed analysis of the financial ratios is being conducted.
a) CURRENT RATIO:
CURRENT RATIO
2015 2016
CURRENT ASSETS 5742 4821.5
CURRENT LIABILITIES 3346 3369.5
CURRENT RATIO 1.72 1.43
The current ratio of the company has decreased over the period of one year because of the
fact that the current assets of the company have reduced from 5742 in the year 2015 to 4821
in the year 2016. The reduction in the current asset and the comparatively lesser change
increase in the current liabilities have pushed the current ratio lower.
b) DEBT EQUITY RATIO:
DEBT EQUITY RATIO
2015 2016
TOTAL LIABILITIES 8154.3 7621.5
EQUITY 4035.1 3596.8
DEBT EQUITY RATIO 2.02 2.12
The total liabilities of the company have experienced a fall in the amount which is higher
than the fall in the equity of the company. This disparity in the percentage of change has
resulted in the slight increase of the debt equity ratio of the company.
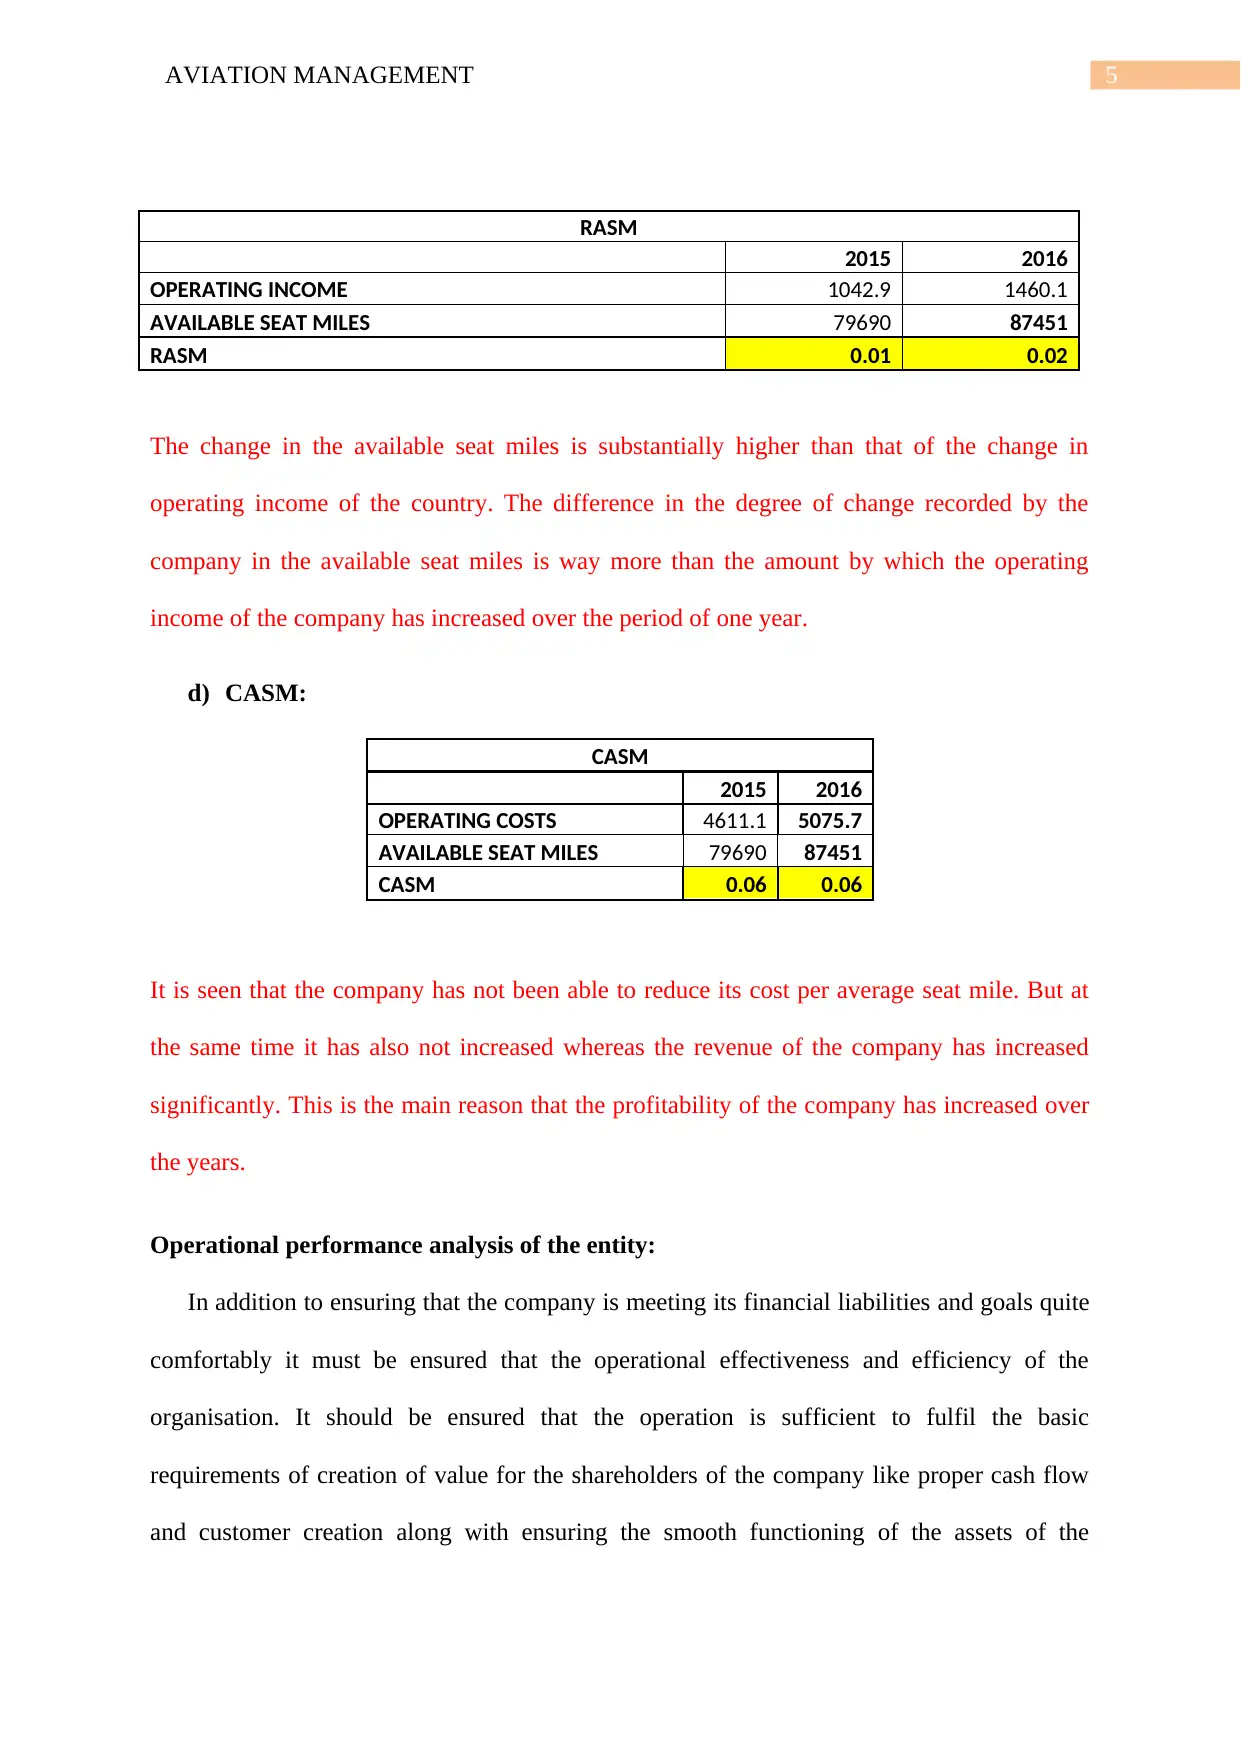
c) RASM:
Paraphrase This Document
Need a fresh take? Get an instant paraphrase of this document with our AI Paraphraser
AVIATION MANAGEMENT 5
RASM
2015 2016
OPERATING INCOME 1042.9 1460.1
AVAILABLE SEAT MILES 79690 87451
RASM 0.01 0.02
The change in the available seat miles is substantially higher than that of the change in
operating income of the country. The difference in the degree of change recorded by the
company in the available seat miles is way more than the amount by which the operating
income of the company has increased over the period of one year.
d) CASM:
CASM
2015 2016
OPERATING COSTS 4611.1 5075.7
AVAILABLE SEAT MILES 79690 87451
CASM 0.06 0.06
It is seen that the company has not been able to reduce its cost per average seat mile. But at
the same time it has also not increased whereas the revenue of the company has increased
significantly. This is the main reason that the profitability of the company has increased over
the years.
Operational performance analysis of the entity:
In addition to ensuring that the company is meeting its financial liabilities and goals quite
comfortably it must be ensured that the operational effectiveness and efficiency of the
organisation. It should be ensured that the operation is sufficient to fulfil the basic
requirements of creation of value for the shareholders of the company like proper cash flow
and customer creation along with ensuring the smooth functioning of the assets of the
AVIATION MANAGEMENT 6
company. Some of the indicators of the operational performance of the organisation are as
follows:
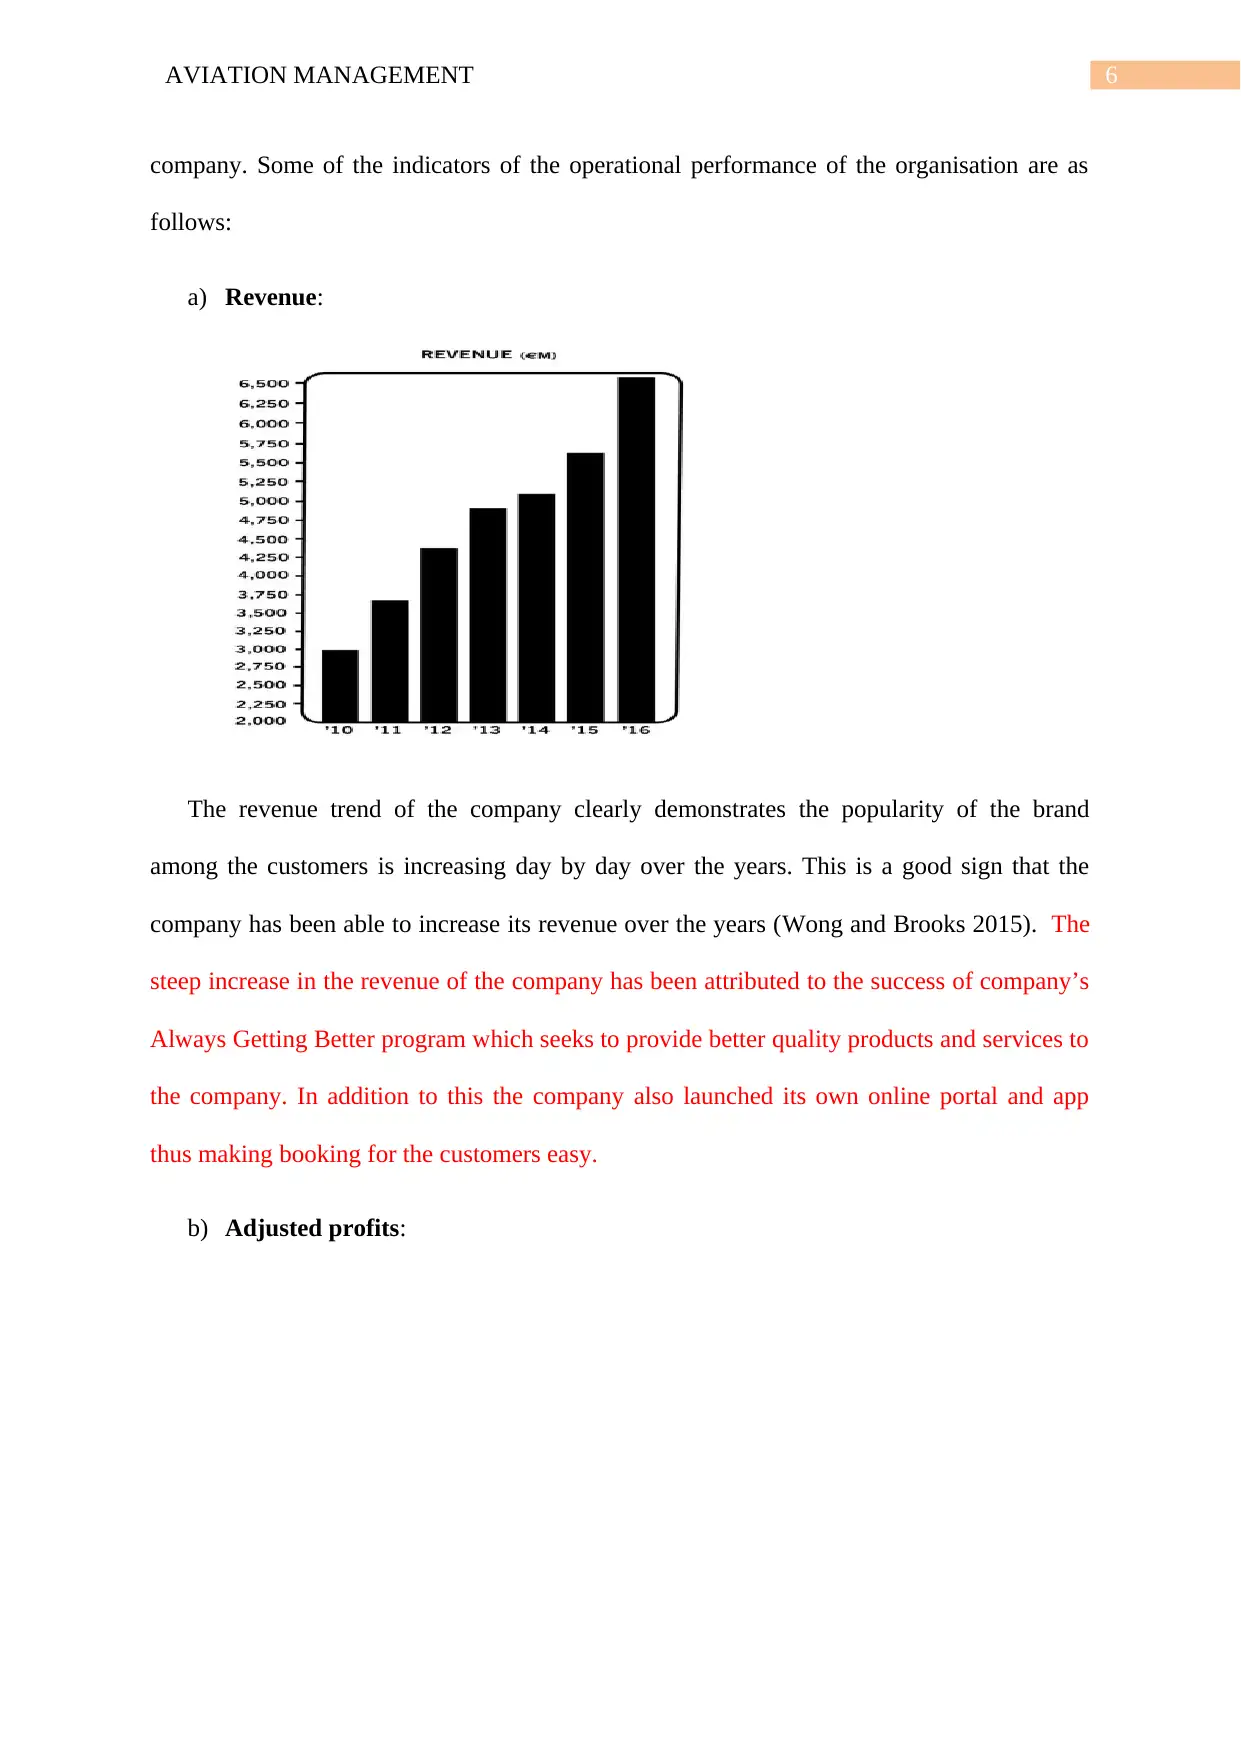
a) Revenue:
The revenue trend of the company clearly demonstrates the popularity of the brand
among the customers is increasing day by day over the years. This is a good sign that the
company has been able to increase its revenue over the years (Wong and Brooks 2015). The
steep increase in the revenue of the company has been attributed to the success of company’s
Always Getting Better program which seeks to provide better quality products and services to
the company. In addition to this the company also launched its own online portal and app
thus making booking for the customers easy.
b) Adjusted profits:
company. Some of the indicators of the operational performance of the organisation are as
follows:
a) Revenue:
The revenue trend of the company clearly demonstrates the popularity of the brand
among the customers is increasing day by day over the years. This is a good sign that the
company has been able to increase its revenue over the years (Wong and Brooks 2015). The
steep increase in the revenue of the company has been attributed to the success of company’s
Always Getting Better program which seeks to provide better quality products and services to
the company. In addition to this the company also launched its own online portal and app
thus making booking for the customers easy.
b) Adjusted profits:
⊘ This is a preview!⊘
Do you want full access?
Subscribe today to unlock all pages.
Trusted by 1+ million students worldwide
AVIATION MANAGEMENT 7
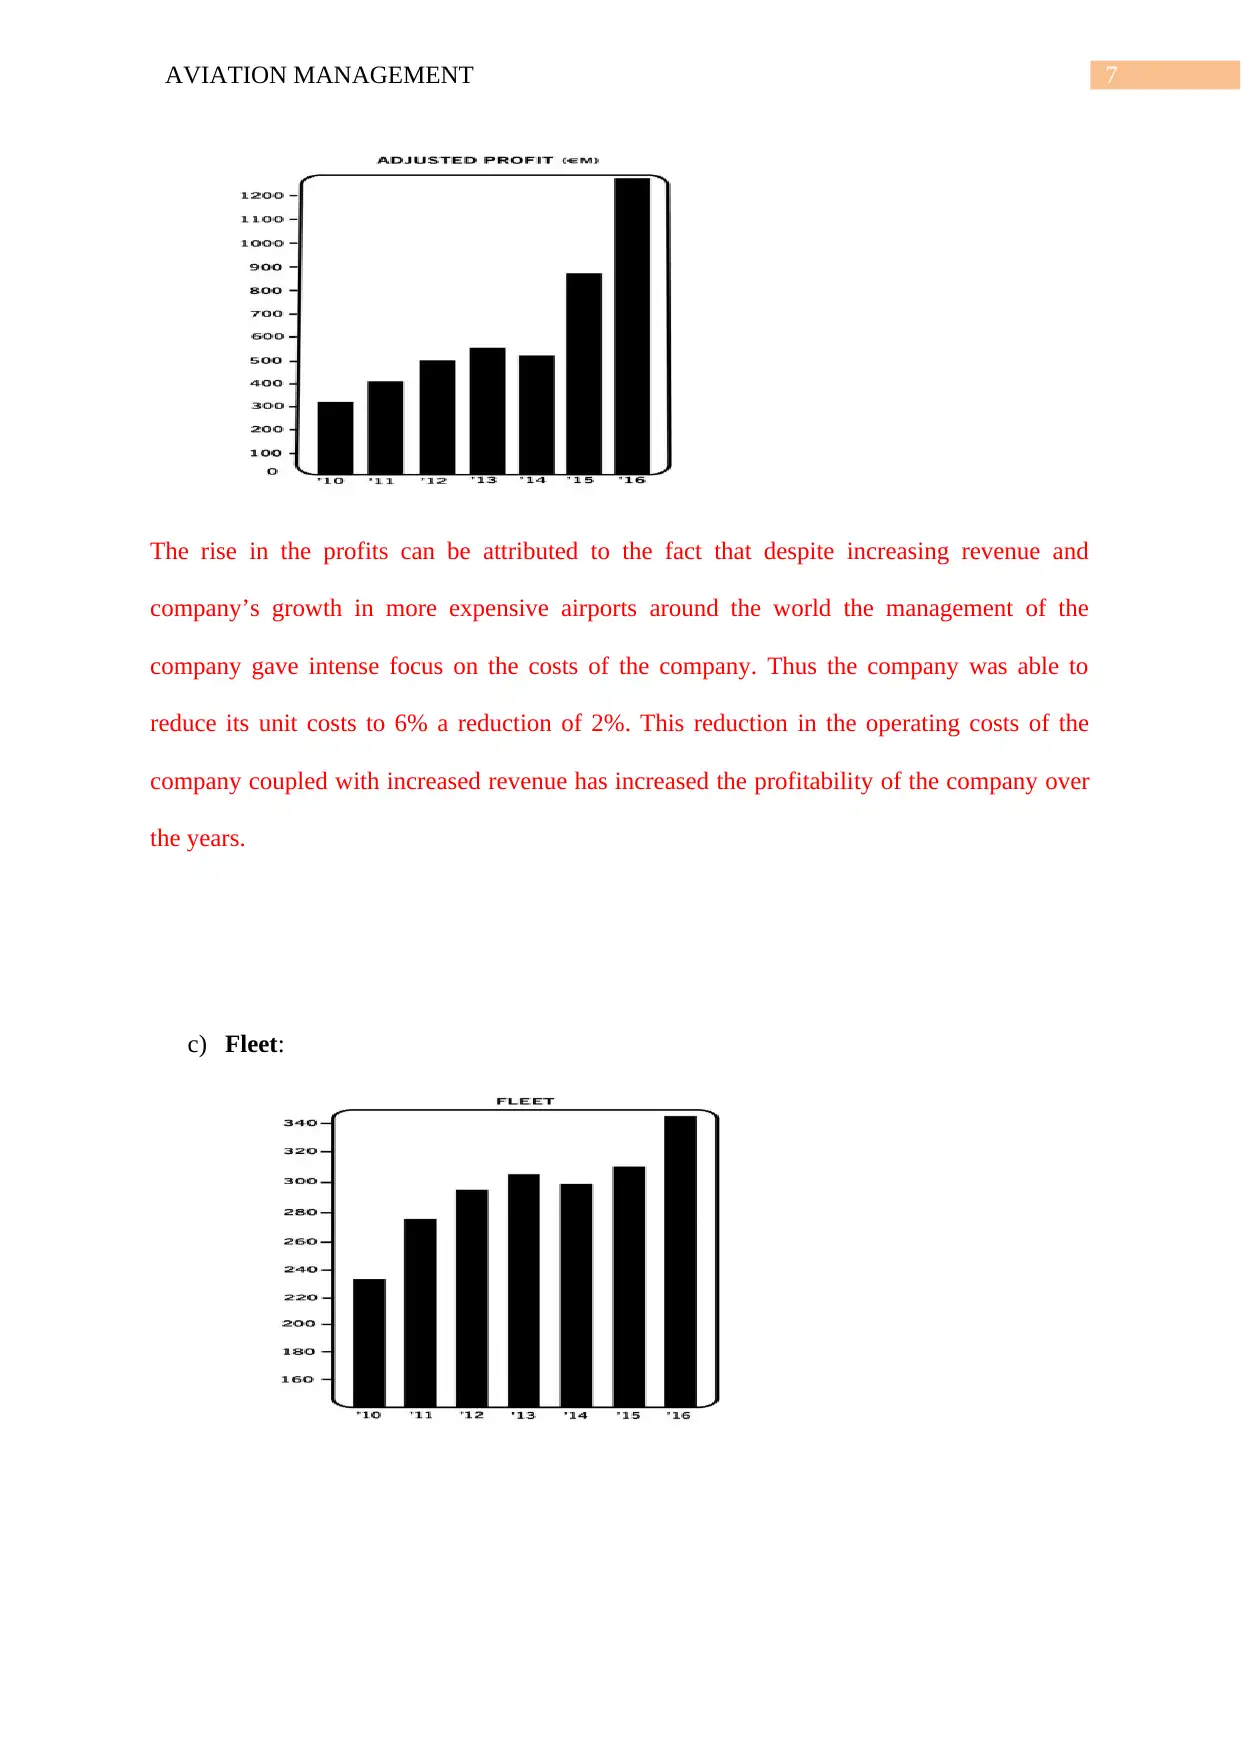
The rise in the profits can be attributed to the fact that despite increasing revenue and
company’s growth in more expensive airports around the world the management of the
company gave intense focus on the costs of the company. Thus the company was able to
reduce its unit costs to 6% a reduction of 2%. This reduction in the operating costs of the
company coupled with increased revenue has increased the profitability of the company over
the years.
c) Fleet:
Paraphrase This Document
Need a fresh take? Get an instant paraphrase of this document with our AI Paraphraser
AVIATION MANAGEMENT 8
The company was able to get delivery of 41 new Boeing 737-800 aircrafts which enabled the
company to grow its fleet along with the routes it operated on. Due to induction of these
Boeing aircrafts the fleet of the company has increased significantly this year.
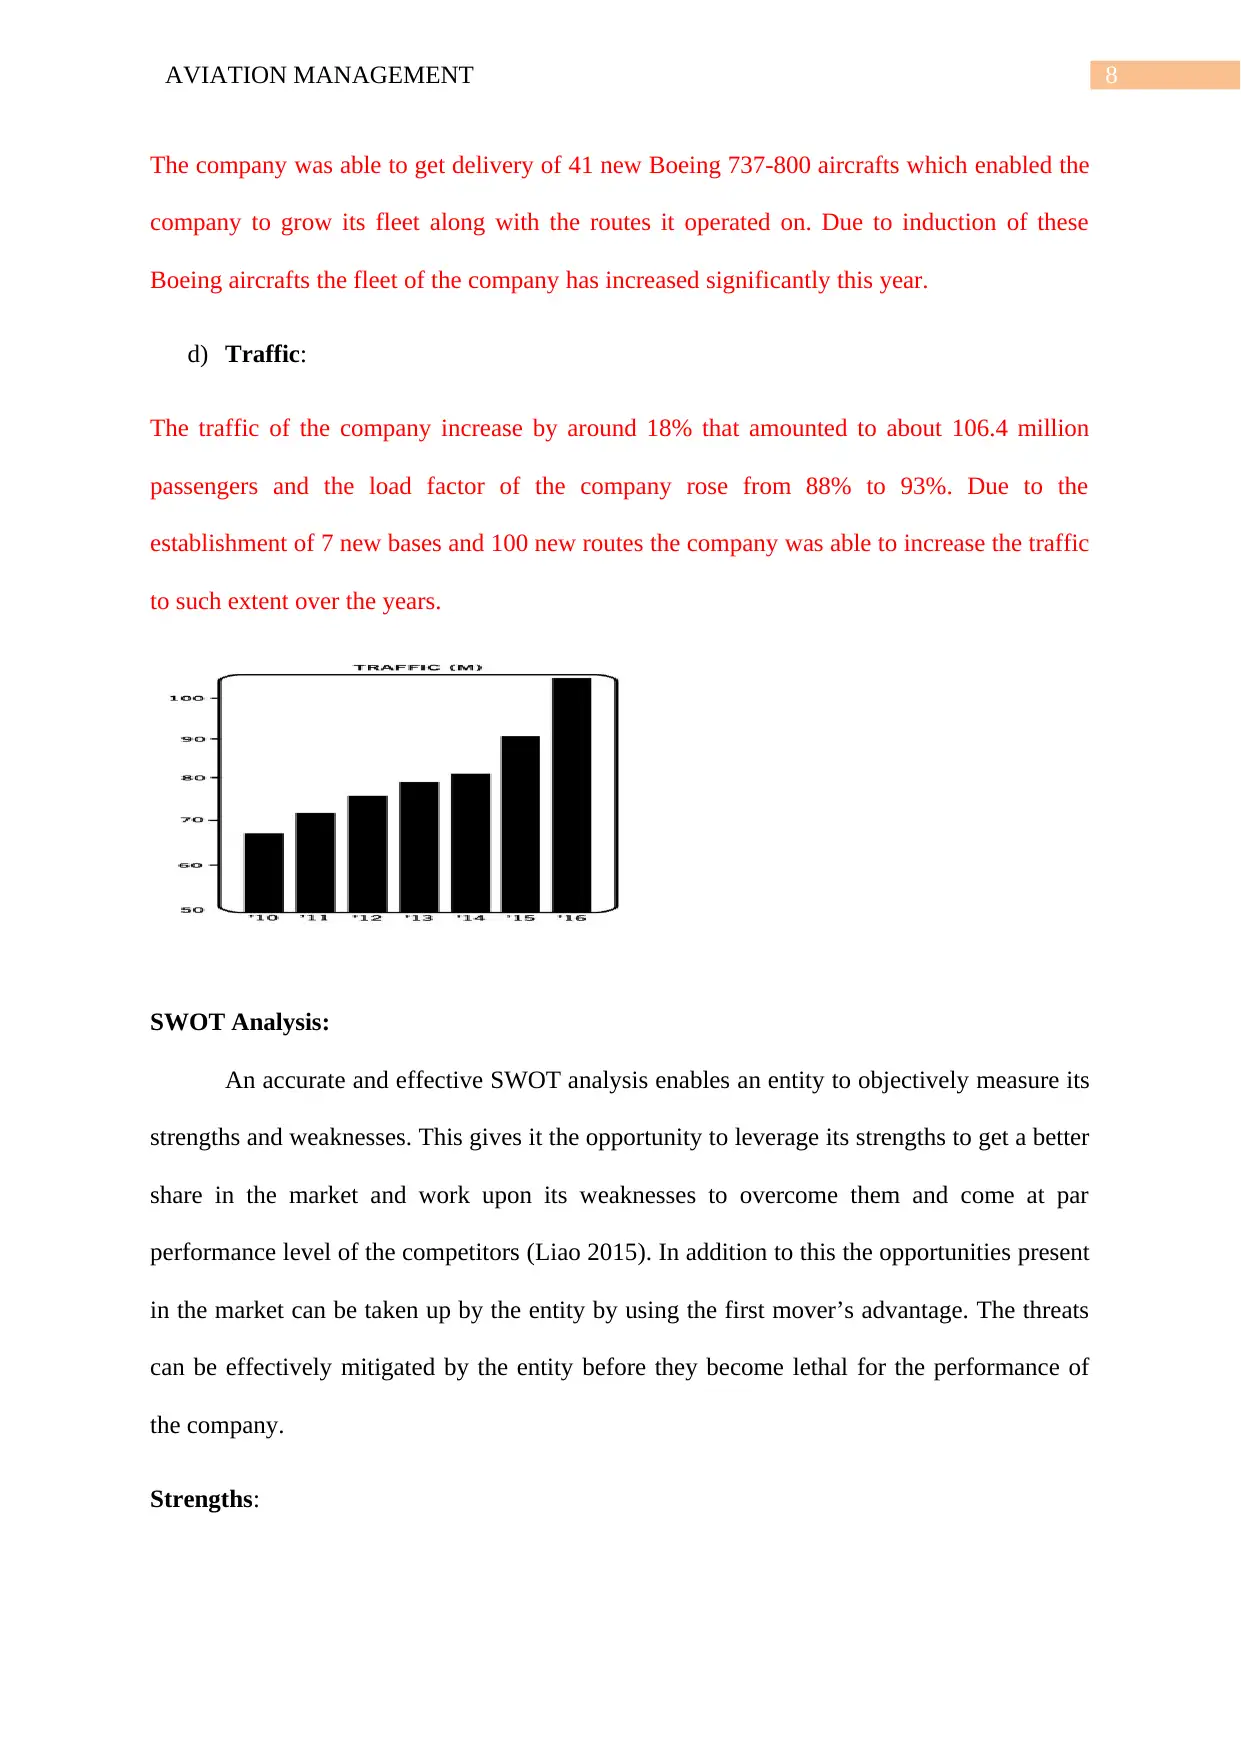
d) Traffic:
The traffic of the company increase by around 18% that amounted to about 106.4 million
passengers and the load factor of the company rose from 88% to 93%. Due to the
establishment of 7 new bases and 100 new routes the company was able to increase the traffic
to such extent over the years.
SWOT Analysis:
An accurate and effective SWOT analysis enables an entity to objectively measure its
strengths and weaknesses. This gives it the opportunity to leverage its strengths to get a better
share in the market and work upon its weaknesses to overcome them and come at par
performance level of the competitors (Liao 2015). In addition to this the opportunities present
in the market can be taken up by the entity by using the first mover’s advantage. The threats
can be effectively mitigated by the entity before they become lethal for the performance of
the company.
Strengths:
The company was able to get delivery of 41 new Boeing 737-800 aircrafts which enabled the
company to grow its fleet along with the routes it operated on. Due to induction of these
Boeing aircrafts the fleet of the company has increased significantly this year.
d) Traffic:
The traffic of the company increase by around 18% that amounted to about 106.4 million
passengers and the load factor of the company rose from 88% to 93%. Due to the
establishment of 7 new bases and 100 new routes the company was able to increase the traffic
to such extent over the years.
SWOT Analysis:
An accurate and effective SWOT analysis enables an entity to objectively measure its
strengths and weaknesses. This gives it the opportunity to leverage its strengths to get a better
share in the market and work upon its weaknesses to overcome them and come at par
performance level of the competitors (Liao 2015). In addition to this the opportunities present
in the market can be taken up by the entity by using the first mover’s advantage. The threats
can be effectively mitigated by the entity before they become lethal for the performance of
the company.
Strengths:
AVIATION MANAGEMENT 9
o The airline was the first one to be based upon the low cost model and thus enjoys a
significant amount of expertise over its competitors in this segment.
o The airline is the largest passenger carrier in all of Europe. Thus, it is implied that it
enjoys significant share of the European market.
o Due to its large fleet size and large magnitude of operations in the European market it
is able to utilise the economies of scale very efficiently and effectively thus enabling
it to keep the cost low.
o The superior and consistent performance on the part of the airline ensures it to capture
new markets faster using predatory pricing strategy.
o The company has established multiple new bases and have expanded its operations to
100 new routes
Weakness:
o The low cost tag used by the airline often comes along with poor service to the
customers and ambiguous pricing policies like misleading baggage policies etc.
o Being a low cost airline the company is susceptible to seasonal and performance
fluctuations. This is because of the fact that low cost airline is preferred mostly by
leisure travellers and sudden change in the customer composition and occupancy can
impact the performance of the airline across all markets.
Opportunities:
o The company is well poised to increase its revenue through its various ancillary
services.
o It has a proper programme in place called always getting better which focuses on
improving the experience of the consumer. Thus, it has immense opportunity to
improve its quality of service.
⊘ This is a preview!⊘
Do you want full access?
Subscribe today to unlock all pages.
Trusted by 1+ million students worldwide
AVIATION MANAGEMENT 10
Threats:
o The recent Brexit will result in pressure on the prices of the airline.
o The fuel prices of the company are constantly fluctuating affecting its prices.
o Some other low cost airlines are developing
Benchmarking
In order to conduct the benchmarking Norwegian Air Shuttle has been chosen as
competitor of the company. Some of the parameters on which the comparison will be done
will comprise some of the operational and financial indicators of both the company (Jackson
and Area 2018).
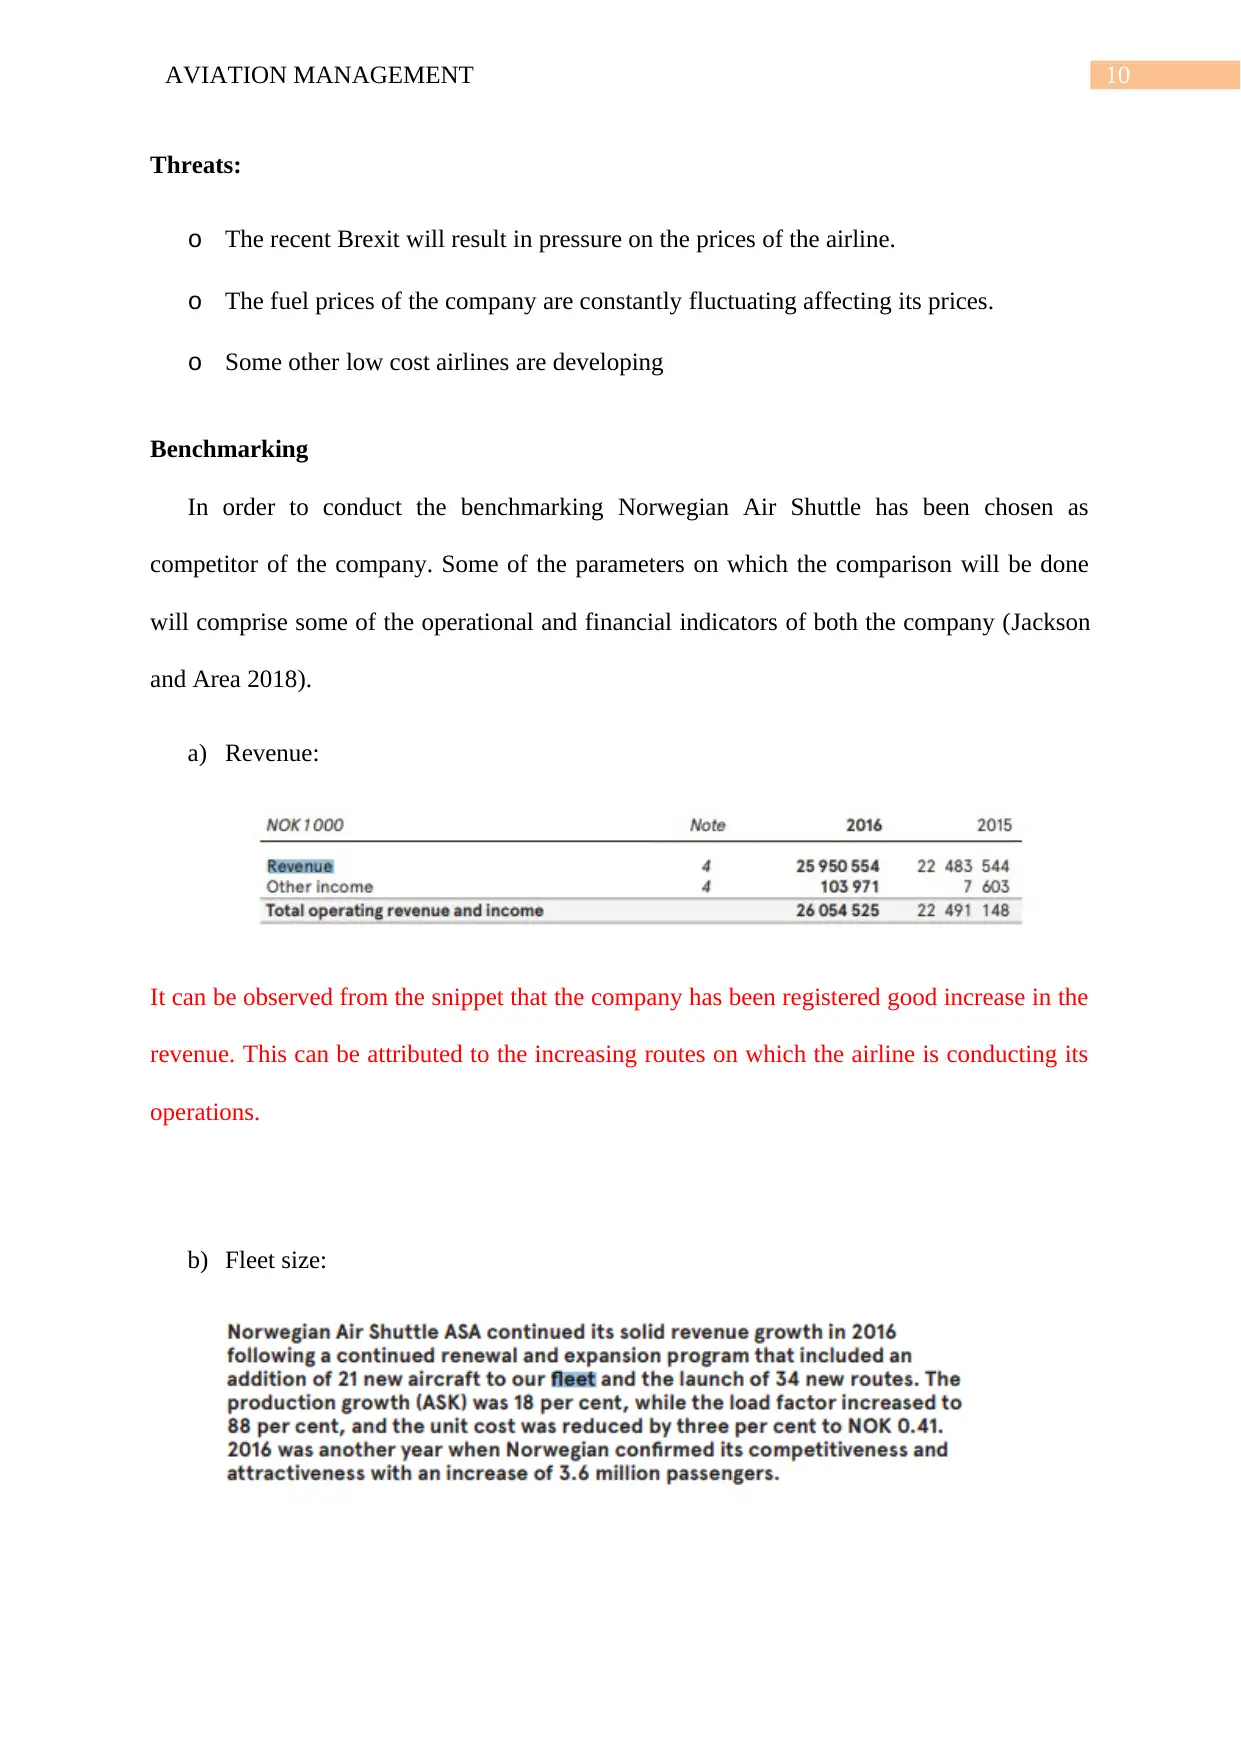
a) Revenue:
It can be observed from the snippet that the company has been registered good increase in the
revenue. This can be attributed to the increasing routes on which the airline is conducting its
operations.
b) Fleet size:
Threats:
o The recent Brexit will result in pressure on the prices of the airline.
o The fuel prices of the company are constantly fluctuating affecting its prices.
o Some other low cost airlines are developing
Benchmarking
In order to conduct the benchmarking Norwegian Air Shuttle has been chosen as
competitor of the company. Some of the parameters on which the comparison will be done
will comprise some of the operational and financial indicators of both the company (Jackson
and Area 2018).
a) Revenue:
It can be observed from the snippet that the company has been registered good increase in the
revenue. This can be attributed to the increasing routes on which the airline is conducting its
operations.
b) Fleet size:
Paraphrase This Document
Need a fresh take? Get an instant paraphrase of this document with our AI Paraphraser
AVIATION MANAGEMENT 11
As per the information given out in the annual reports of the company, the size of the fleet
has increased by 21. This is lower than the number of fleets inducted by Ryan air. However
the company is going to become the first airline in all of Europe to induct and operate the
Boeing 737 Max 8 which the upgraded model of the one inducted by Ryan air.
AVIATION MANAGEMENT 12
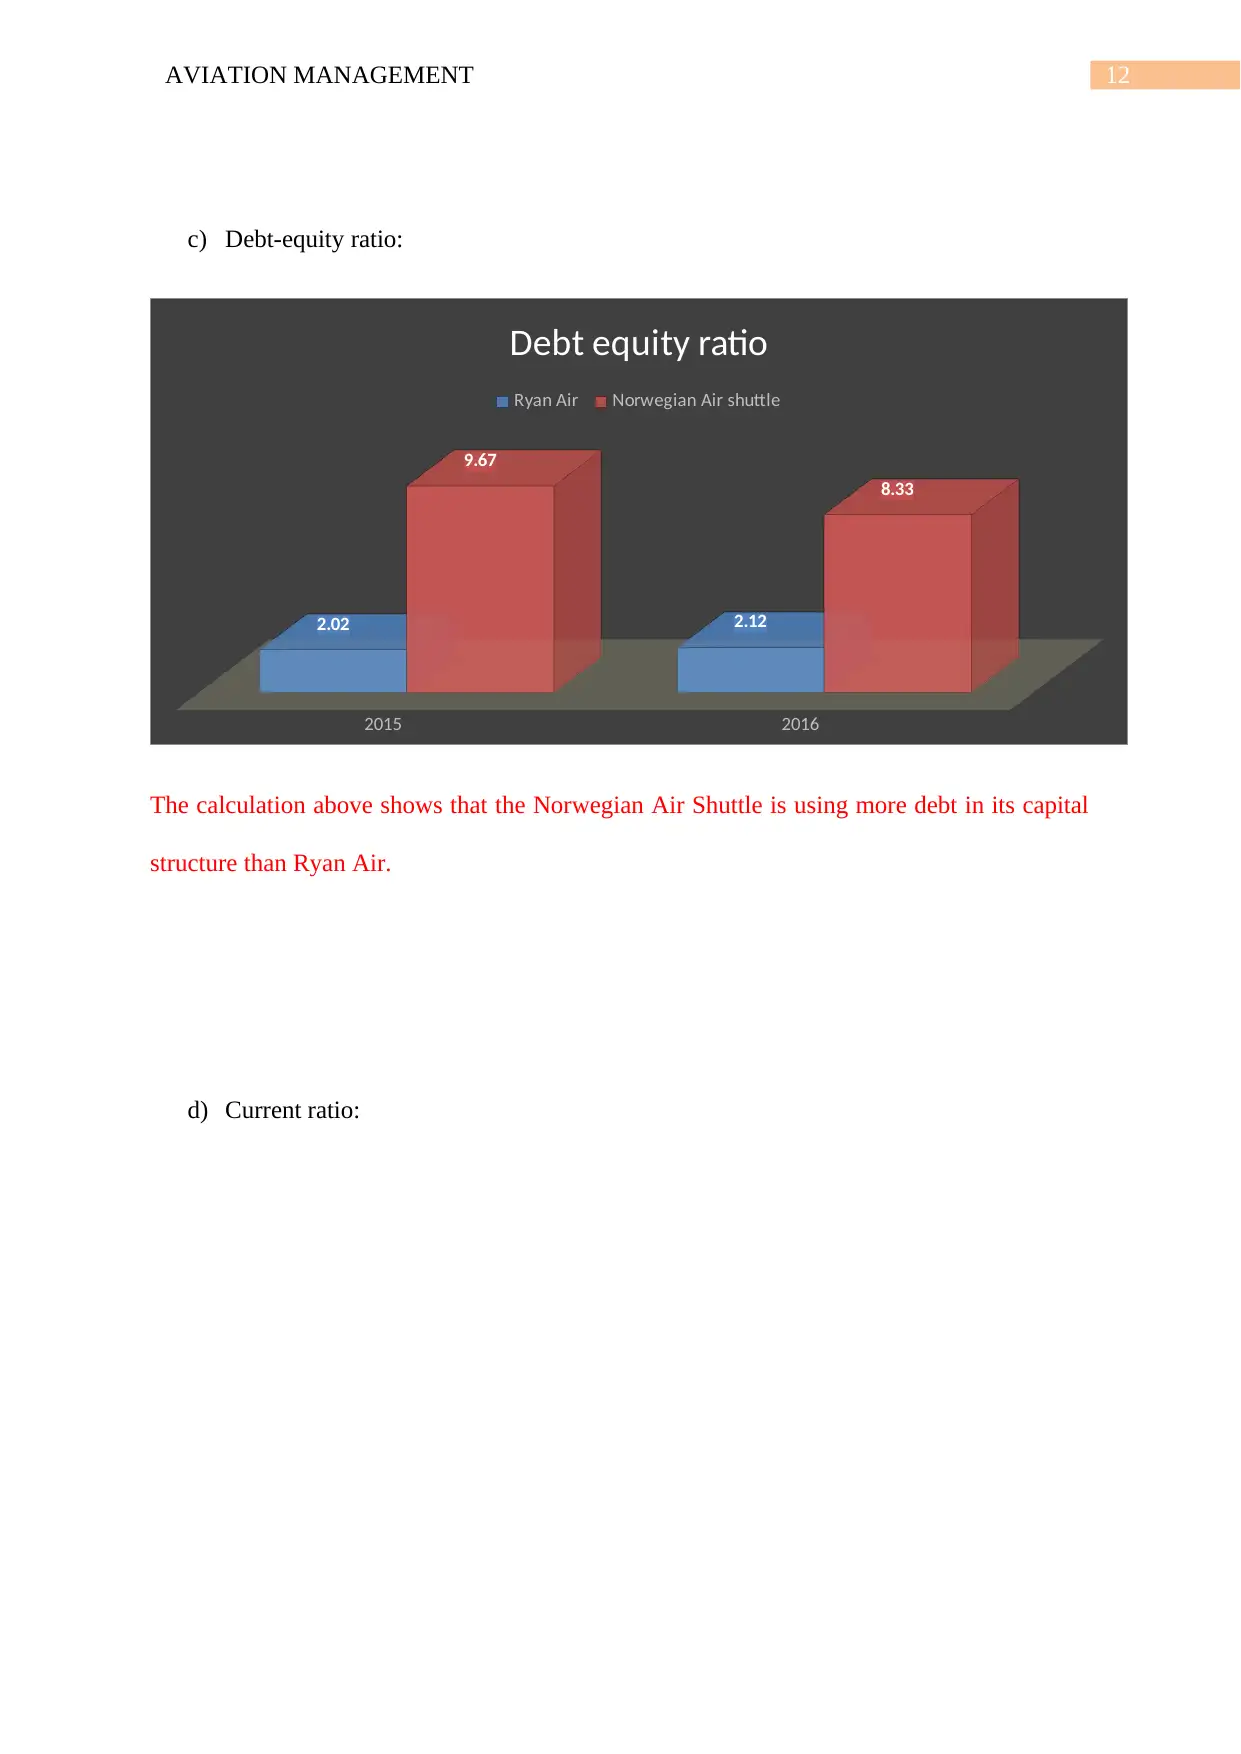
c) Debt-equity ratio:
2015 2016
2.02 2.12
9.67
8.33
Debt equity ratio
Ryan Air Norwegian Air shuttle
The calculation above shows that the Norwegian Air Shuttle is using more debt in its capital
structure than Ryan Air.
d) Current ratio:
c) Debt-equity ratio:
2015 2016
2.02 2.12
9.67
8.33
Debt equity ratio
Ryan Air Norwegian Air shuttle
The calculation above shows that the Norwegian Air Shuttle is using more debt in its capital
structure than Ryan Air.
d) Current ratio:
⊘ This is a preview!⊘
Do you want full access?
Subscribe today to unlock all pages.
Trusted by 1+ million students worldwide
1 out of 20
Related Documents


Your All-in-One AI-Powered Toolkit for Academic Success.
+13062052269
info@desklib.com
Available 24*7 on WhatsApp / Email
![[object Object]](/_next/static/media/star-bottom.7253800d.svg)
Unlock your academic potential
Copyright © 2020–2026 A2Z Services. All Rights Reserved. Developed and managed by ZUCOL.