Risk Management in Highway Construction: Safety Improvement Study
VerifiedAdded on 2023/06/03
|5
|2610
|135
Report
AI Summary
This report investigates safety improvements in highway construction through the lens of project risk management. It utilizes data gathered from survey questionnaires to analyze the effectiveness of mobile tools, hazard assessments, and safety plans in reducing worker fatalities and improving overall safety. The research employs statistical methods, including regression analysis, to determine the correlation between these factors and safety improvements. The study concludes that implementing risk management practices, such as using mobile tools for communication, conducting thorough hazard assessments, and developing comprehensive safety plans, significantly contributes to enhancing safety measures in highway construction projects. The report suggests further research to address existing gaps and validate the findings with more in-depth analysis.
1Abstract—This research is focused on determining the
safety improvements that can be made in Highway
construction with the help of project risk management. In this
research, the analysis has been done with the help of data
being gathered through survey questionnaires. The project risk
management is an essential element to improve and implement
security measures that are required for construction of
highways. From the overall analysis and previous researches, it
has been identified that use of mobile tool will help to
effectively improve safety in highway construction. The
construction industry is more prone to workplace health and
safety issues which could be mitigated with the help of mobile
tool, hazard assessment and safety plans through project risk
management.
Index Terms—Risk management, Mobile tool, Hazard
assessment, Safety plan.
I. INTRODUCTION
HE construction industry has grown with the rapid
advancements in technology along with it there has
been an increasing number of worker fatalities during
construction. This study is aimed at determining the relevant
factors which will help to make safety improvements in
highway construction [9]. The research will help to improve
the safety measures being implemented in the construction
workplace so that worker fatalities can be significantly
reduced. In this research the focus of the researcher is to
utilize statistical tools for analyzing the data that will
gathered from survey on the chosen topic. The discussion
are also carried out on future scope of this study along with
the expected outcomes from this study.
T
II.LITERATURE REVIEW
You Kim [3] stated that the highway construction industry
is perceived as required into the development of country.
The construction projects are associated with poor
performance, lack of control; therefore it is encountered
uncertainties in terms of safety that can threaten the
completion of project work. Thomson and McLeod [6]
argued that the construction industry is known for their
complexities to deal with the construction safety. The
industry has high workforce turnover that can impact on
safety awareness of the workers. Following data provides
circumstances of work-related deaths in Australia:
From the year 2003-2016, 3414 workers lost the lives in
work related incidents. In the year 2016, there were
1
Student Name (student number) is studying XXXX engineering in the
Griffith School of Engineering and buildt Environment, Griffith University.
Email F.Author@griffithuni.edu.au
.
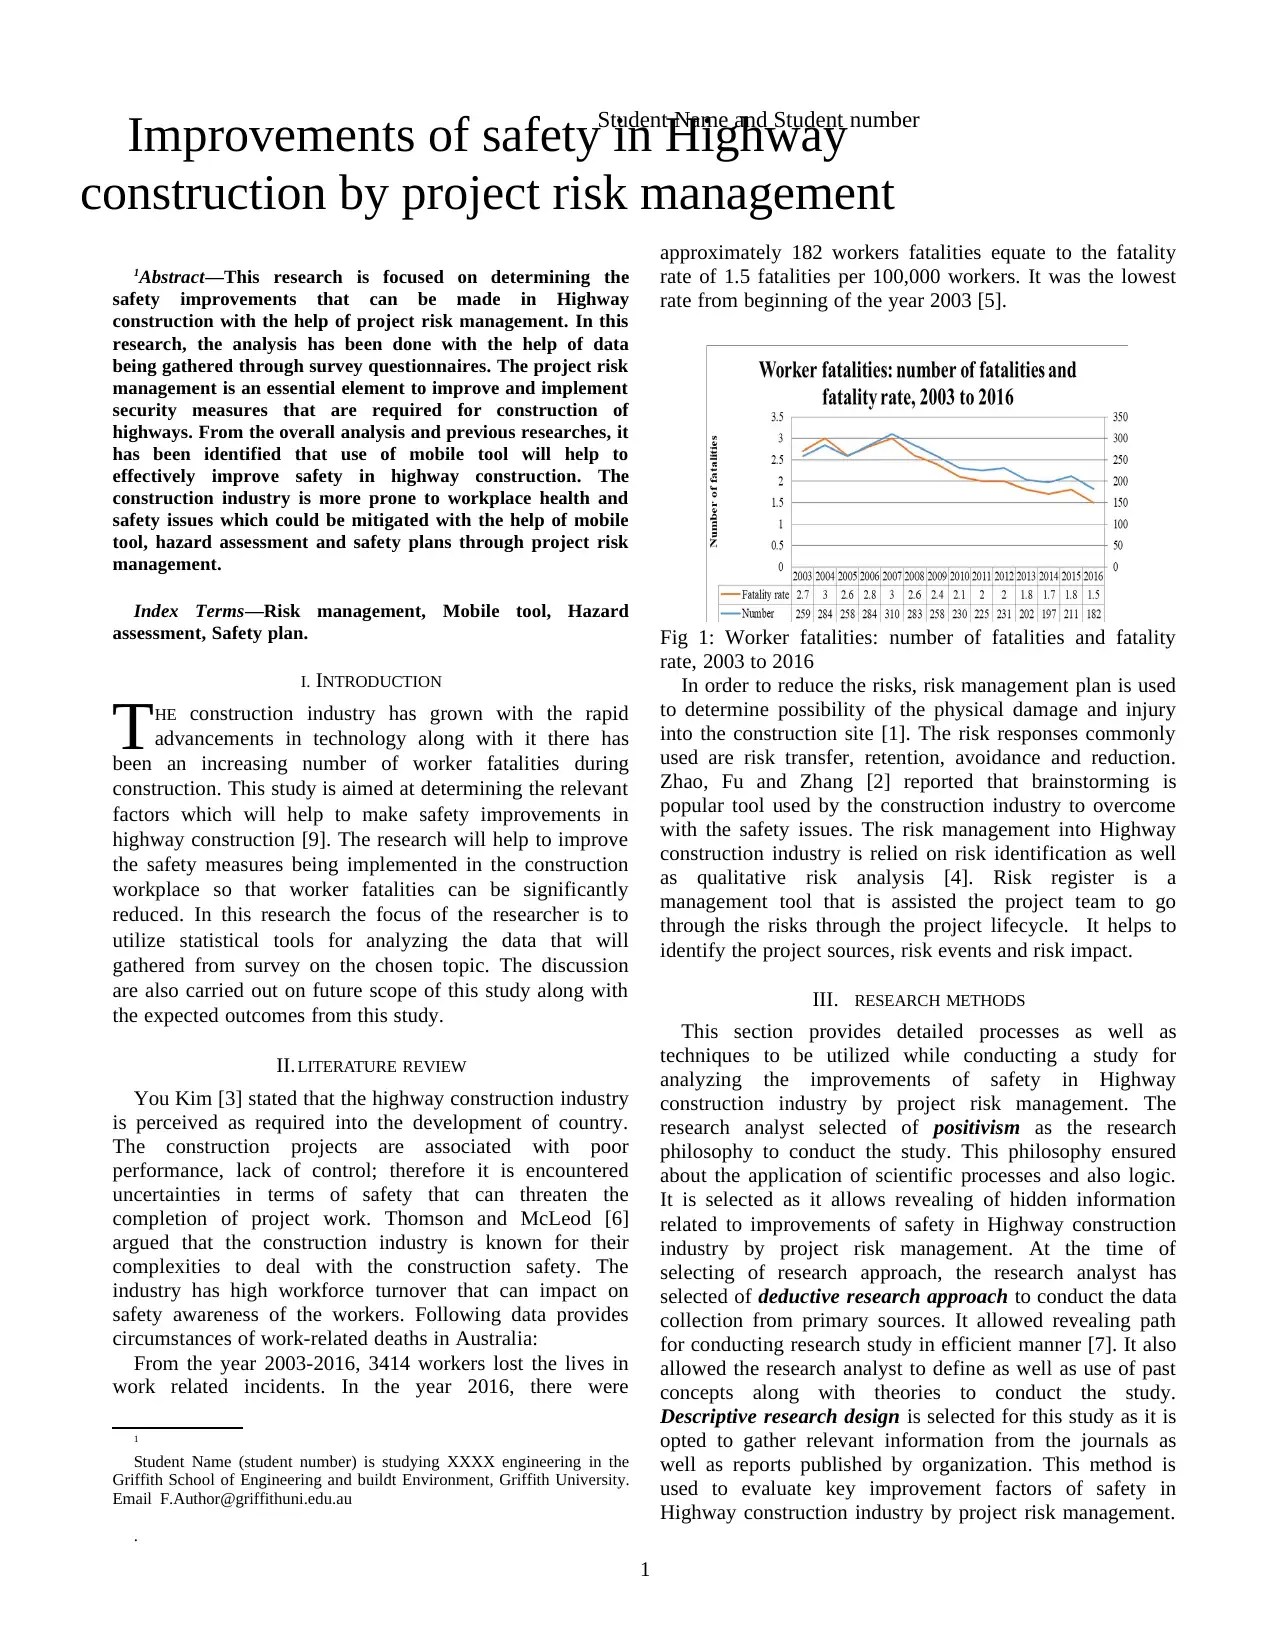
approximately 182 workers fatalities equate to the fatality
rate of 1.5 fatalities per 100,000 workers. It was the lowest
rate from beginning of the year 2003 [5].
Fig 1: Worker fatalities: number of fatalities and fatality
rate, 2003 to 2016
In order to reduce the risks, risk management plan is used
to determine possibility of the physical damage and injury
into the construction site [1]. The risk responses commonly
used are risk transfer, retention, avoidance and reduction.
Zhao, Fu and Zhang [2] reported that brainstorming is
popular tool used by the construction industry to overcome
with the safety issues. The risk management into Highway
construction industry is relied on risk identification as well
as qualitative risk analysis [4]. Risk register is a
management tool that is assisted the project team to go
through the risks through the project lifecycle. It helps to
identify the project sources, risk events and risk impact.
III. RESEARCH METHODS
This section provides detailed processes as well as
techniques to be utilized while conducting a study for
analyzing the improvements of safety in Highway
construction industry by project risk management. The
research analyst selected of positivism as the research
philosophy to conduct the study. This philosophy ensured
about the application of scientific processes and also logic.
It is selected as it allows revealing of hidden information
related to improvements of safety in Highway construction
industry by project risk management. At the time of
selecting of research approach, the research analyst has
selected of deductive research approach to conduct the data
collection from primary sources. It allowed revealing path
for conducting research study in efficient manner [7]. It also
allowed the research analyst to define as well as use of past
concepts along with theories to conduct the study.
Descriptive research design is selected for this study as it is
opted to gather relevant information from the journals as
well as reports published by organization. This method is
used to evaluate key improvement factors of safety in
Highway construction industry by project risk management.
1
Improvements of safety in Highway
construction by project risk management
Student Name and Student number
safety improvements that can be made in Highway
construction with the help of project risk management. In this
research, the analysis has been done with the help of data
being gathered through survey questionnaires. The project risk
management is an essential element to improve and implement
security measures that are required for construction of
highways. From the overall analysis and previous researches, it
has been identified that use of mobile tool will help to
effectively improve safety in highway construction. The
construction industry is more prone to workplace health and
safety issues which could be mitigated with the help of mobile
tool, hazard assessment and safety plans through project risk
management.
Index Terms—Risk management, Mobile tool, Hazard
assessment, Safety plan.
I. INTRODUCTION
HE construction industry has grown with the rapid
advancements in technology along with it there has
been an increasing number of worker fatalities during
construction. This study is aimed at determining the relevant
factors which will help to make safety improvements in
highway construction [9]. The research will help to improve
the safety measures being implemented in the construction
workplace so that worker fatalities can be significantly
reduced. In this research the focus of the researcher is to
utilize statistical tools for analyzing the data that will
gathered from survey on the chosen topic. The discussion
are also carried out on future scope of this study along with
the expected outcomes from this study.
T
II.LITERATURE REVIEW
You Kim [3] stated that the highway construction industry
is perceived as required into the development of country.
The construction projects are associated with poor
performance, lack of control; therefore it is encountered
uncertainties in terms of safety that can threaten the
completion of project work. Thomson and McLeod [6]
argued that the construction industry is known for their
complexities to deal with the construction safety. The
industry has high workforce turnover that can impact on
safety awareness of the workers. Following data provides
circumstances of work-related deaths in Australia:
From the year 2003-2016, 3414 workers lost the lives in
work related incidents. In the year 2016, there were
1
Student Name (student number) is studying XXXX engineering in the
Griffith School of Engineering and buildt Environment, Griffith University.
Email F.Author@griffithuni.edu.au
.
approximately 182 workers fatalities equate to the fatality
rate of 1.5 fatalities per 100,000 workers. It was the lowest
rate from beginning of the year 2003 [5].
Fig 1: Worker fatalities: number of fatalities and fatality
rate, 2003 to 2016
In order to reduce the risks, risk management plan is used
to determine possibility of the physical damage and injury
into the construction site [1]. The risk responses commonly
used are risk transfer, retention, avoidance and reduction.
Zhao, Fu and Zhang [2] reported that brainstorming is
popular tool used by the construction industry to overcome
with the safety issues. The risk management into Highway
construction industry is relied on risk identification as well
as qualitative risk analysis [4]. Risk register is a
management tool that is assisted the project team to go
through the risks through the project lifecycle. It helps to
identify the project sources, risk events and risk impact.
III. RESEARCH METHODS
This section provides detailed processes as well as
techniques to be utilized while conducting a study for
analyzing the improvements of safety in Highway
construction industry by project risk management. The
research analyst selected of positivism as the research
philosophy to conduct the study. This philosophy ensured
about the application of scientific processes and also logic.
It is selected as it allows revealing of hidden information
related to improvements of safety in Highway construction
industry by project risk management. At the time of
selecting of research approach, the research analyst has
selected of deductive research approach to conduct the data
collection from primary sources. It allowed revealing path
for conducting research study in efficient manner [7]. It also
allowed the research analyst to define as well as use of past
concepts along with theories to conduct the study.
Descriptive research design is selected for this study as it is
opted to gather relevant information from the journals as
well as reports published by organization. This method is
used to evaluate key improvement factors of safety in
Highway construction industry by project risk management.
1
Improvements of safety in Highway
construction by project risk management
Student Name and Student number
Paraphrase This Document
Need a fresh take? Get an instant paraphrase of this document with our AI Paraphraser
The research analyst described the process followed into the
risk management for highway construction. Primary data
collection method is selected to collect of raw data helps to
cater as per the research requirements. The raw data are
used to validate the sources in terms of reliability [10]. As
the data are obtained from the survey questionnaire,
therefore the researcher has conducted of quantitative data
analysis method. The questionnaire survey is distributed
among the safety experts in highway construction [6]. It
helps to get statistical data related to the research topic.
Those statistical data are analyzing validity of developed
hypothesis. The risk factor assessment is also implemented
to classify the risk factors based on degree of importance.
IV. DATA ANALYSIS
A. Figures and Tables
For this particular research a hypothesis has been set to
determine whether Use of mobile tool and hazard
assessment and safety plans are the major effective factors
of improving the safety in highway construction by project
risk management. The hypothesis is presented as below:
Null hypothesis (H0): Use of mobile tool and hazard
assessment and safety plans are not the major effective
factors of improving the safety in highway construction by
project risk management.
Alternative hypothesis (H1): Use of mobile tool and
hazard assessment and safety plans are the major effective
factors of improving the safety in highway construction by
project risk management.
The statistical data which is used to provide identified
hypothesis are regression analysis. It is a technique that can
serve basis for drawing inferences about the relationships
among the interrelated variables [8]. Based on the regression
model, the research analyst can identify both dependent as
well as independent variable resent into this particular study.
The regression model is:
Safety improvements in highway construction = A + B *
Use of Mobile tool + C * Use of hazard assessment + D *
Use of safety plans + e
Where;
A = Intercept of Linear Regression Model
B = Coefficient of Use of Mobile tool
C = Use of hazard assessment
D = Use of safety plans
E = Error term
The benefits of regression analysis are that it can indicate
if the independent variables have significant relationships
with the dependent variable. It also indicates relative
strength of various independent variables effect on the
dependent variable as well as helps to make predictions.
Table 1. Descriptive Statistics for the survey responses
Statistics Use of Mobile
tool
Use of Hazard
assessment
Use of Safety
Plans
Mean 2.1 1.95 1.55
Standard
Error
0.190567021 0.198348444 0.169752141
Median 2 2 1
Mode 2 2 1
Standard
Deviation
0.852241626 0.887041208 0.759154655
Sample
Variance
0.726315789 0.786842105 0.576315789
Kurtosis 1.01177459 -0.245946277 4.587477325
Skewness 0.929631348 0.60703103 1.818493104
Range 3 3 3
Minimum 1 1 1
Maximum 4 4 4
Sum 42 39 31
Count 20 20 20
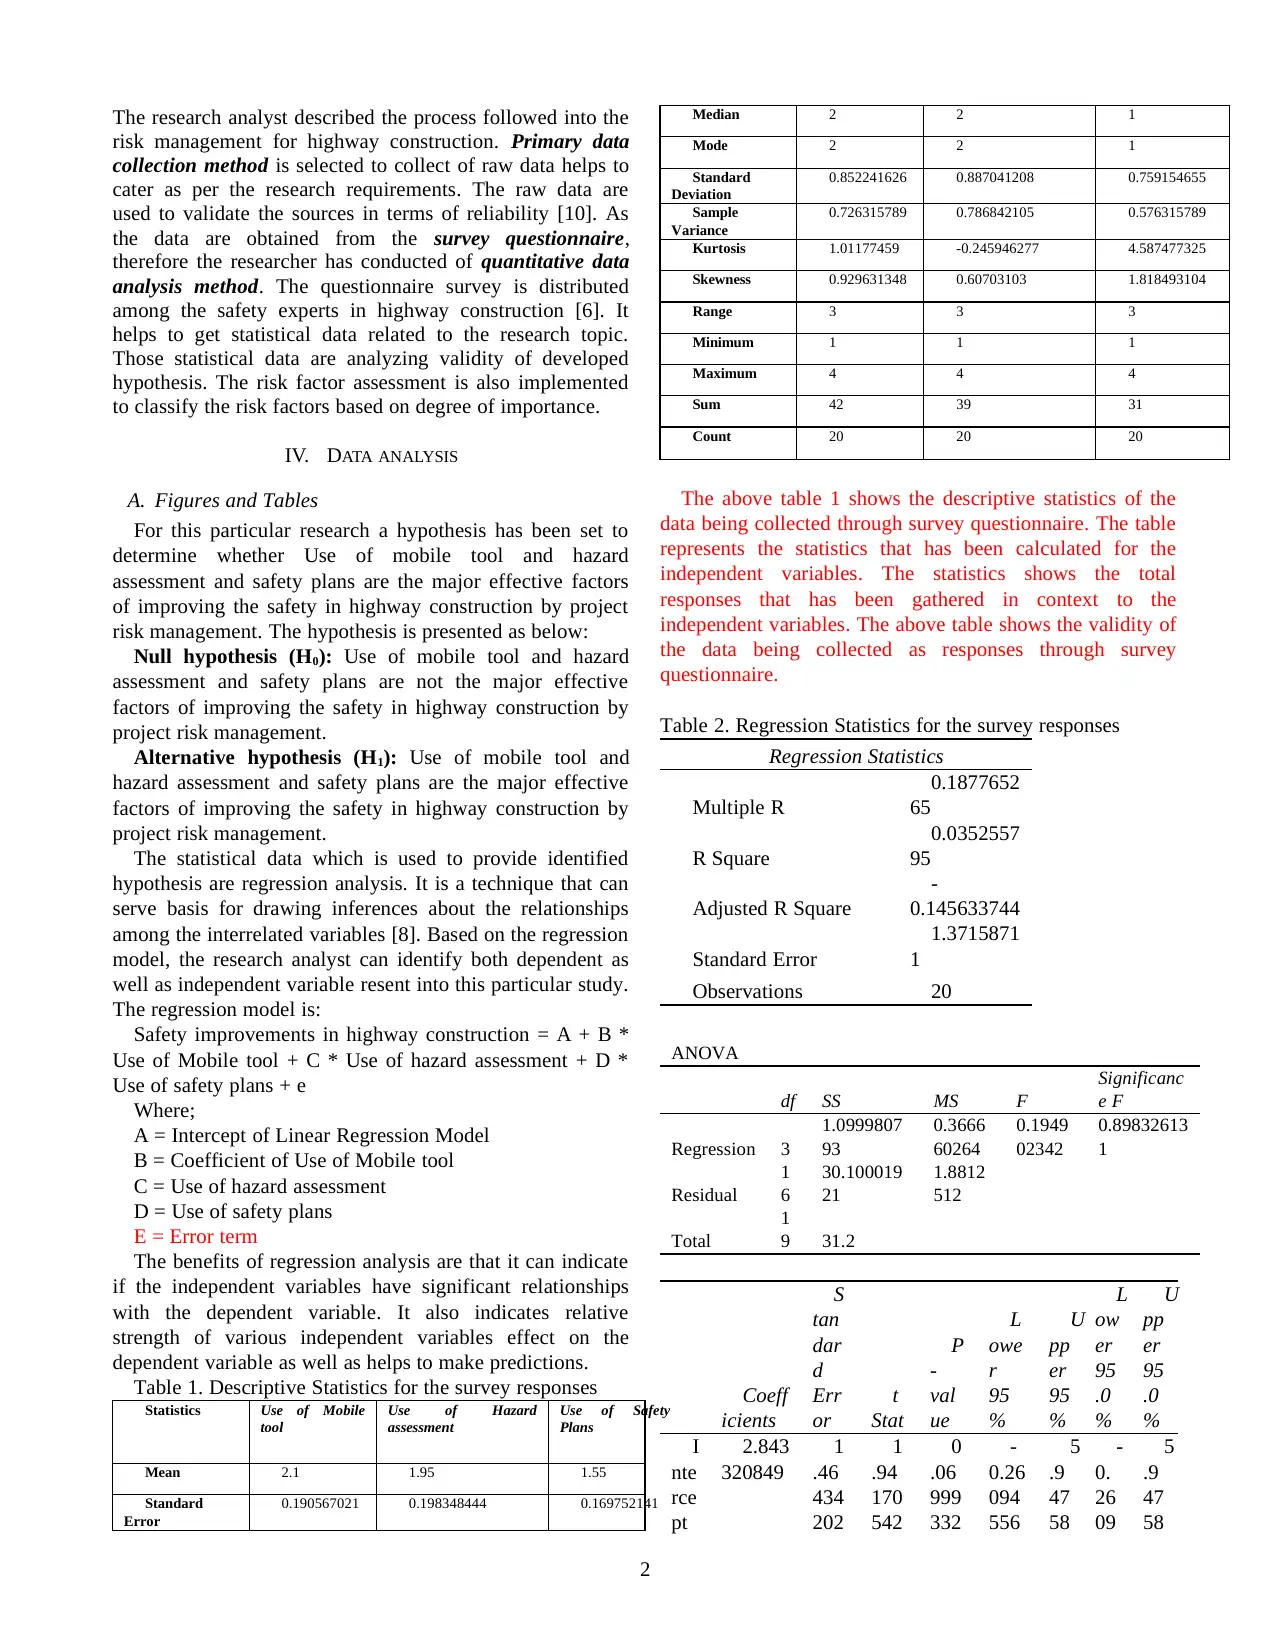
The above table 1 shows the descriptive statistics of the
data being collected through survey questionnaire. The table
represents the statistics that has been calculated for the
independent variables. The statistics shows the total
responses that has been gathered in context to the
independent variables. The above table shows the validity of
the data being collected as responses through survey
questionnaire.
Table 2. Regression Statistics for the survey responses
Regression Statistics
Multiple R
0.1877652
65
R Square
0.0352557
95
Adjusted R Square
-
0.145633744
Standard Error
1.3715871
1
Observations 20
ANOVA
df SS MS F
Significanc
e F
Regression 3
1.0999807
93
0.3666
60264
0.1949
02342
0.89832613
1
Residual
1
6
30.100019
21
1.8812
512
Total
1
9 31.2
Coeff
icients
S
tan
dar
d
Err
or
t
Stat
P
-
val
ue
L
owe
r
95
%
U
pp
er
95
%
L
ow
er
95
.0
%
U
pp
er
95
.0
%
I
nte
rce
pt
2.843
320849
1
.46
434
202
1
.94
170
542
0
.06
999
332
-
0.26
094
556
5
.9
47
58
-
0.
26
09
5
.9
47
58
2
risk management for highway construction. Primary data
collection method is selected to collect of raw data helps to
cater as per the research requirements. The raw data are
used to validate the sources in terms of reliability [10]. As
the data are obtained from the survey questionnaire,
therefore the researcher has conducted of quantitative data
analysis method. The questionnaire survey is distributed
among the safety experts in highway construction [6]. It
helps to get statistical data related to the research topic.
Those statistical data are analyzing validity of developed
hypothesis. The risk factor assessment is also implemented
to classify the risk factors based on degree of importance.
IV. DATA ANALYSIS
A. Figures and Tables
For this particular research a hypothesis has been set to
determine whether Use of mobile tool and hazard
assessment and safety plans are the major effective factors
of improving the safety in highway construction by project
risk management. The hypothesis is presented as below:
Null hypothesis (H0): Use of mobile tool and hazard
assessment and safety plans are not the major effective
factors of improving the safety in highway construction by
project risk management.
Alternative hypothesis (H1): Use of mobile tool and
hazard assessment and safety plans are the major effective
factors of improving the safety in highway construction by
project risk management.
The statistical data which is used to provide identified
hypothesis are regression analysis. It is a technique that can
serve basis for drawing inferences about the relationships
among the interrelated variables [8]. Based on the regression
model, the research analyst can identify both dependent as
well as independent variable resent into this particular study.
The regression model is:
Safety improvements in highway construction = A + B *
Use of Mobile tool + C * Use of hazard assessment + D *
Use of safety plans + e
Where;
A = Intercept of Linear Regression Model
B = Coefficient of Use of Mobile tool
C = Use of hazard assessment
D = Use of safety plans
E = Error term
The benefits of regression analysis are that it can indicate
if the independent variables have significant relationships
with the dependent variable. It also indicates relative
strength of various independent variables effect on the
dependent variable as well as helps to make predictions.
Table 1. Descriptive Statistics for the survey responses
Statistics Use of Mobile
tool
Use of Hazard
assessment
Use of Safety
Plans
Mean 2.1 1.95 1.55
Standard
Error
0.190567021 0.198348444 0.169752141
Median 2 2 1
Mode 2 2 1
Standard
Deviation
0.852241626 0.887041208 0.759154655
Sample
Variance
0.726315789 0.786842105 0.576315789
Kurtosis 1.01177459 -0.245946277 4.587477325
Skewness 0.929631348 0.60703103 1.818493104
Range 3 3 3
Minimum 1 1 1
Maximum 4 4 4
Sum 42 39 31
Count 20 20 20
The above table 1 shows the descriptive statistics of the
data being collected through survey questionnaire. The table
represents the statistics that has been calculated for the
independent variables. The statistics shows the total
responses that has been gathered in context to the
independent variables. The above table shows the validity of
the data being collected as responses through survey
questionnaire.
Table 2. Regression Statistics for the survey responses
Regression Statistics
Multiple R
0.1877652
65
R Square
0.0352557
95
Adjusted R Square
-
0.145633744
Standard Error
1.3715871
1
Observations 20
ANOVA
df SS MS F
Significanc
e F
Regression 3
1.0999807
93
0.3666
60264
0.1949
02342
0.89832613
1
Residual
1
6
30.100019
21
1.8812
512
Total
1
9 31.2
Coeff
icients
S
tan
dar
d
Err
or
t
Stat
P
-
val
ue
L
owe
r
95
%
U
pp
er
95
%
L
ow
er
95
.0
%
U
pp
er
95
.0
%
I
nte
rce
pt
2.843
320849
1
.46
434
202
1
.94
170
542
0
.06
999
332
-
0.26
094
556
5
.9
47
58
-
0.
26
09
5
.9
47
58
2
3 4 1 6
72
64
45
56
6
72
64
U
se
of
M
obi
le
too
l
0.019
927014
0
.37
742
990
7
0
.05
279
659
6
0
.95
854
755
-
0.78
018
864
5
0
.8
20
04
26
74
-
0.
78
01
88
64
5
0
.8
20
04
26
74
U
se
of
Ha
zar
d
ass
ess
me
nt
-
0.10121
9629
0
.36
944
746
9
-
0.2
739
757
01
0
.78
760
882
8
-
0.88
441
327
6
0
.6
81
97
40
17
-
0.
88
44
13
27
6
0
.6
81
97
40
17
U
se
of
Sa
fet
y
Pla
ns
-
0.31470
2775
0
.42
280
816
-
0.7
443
157
57
0
.46
747
726
-
1.21
101
603
4
0
.5
81
61
04
83
-
1.
21
10
16
03
4
0
.5
81
61
04
83
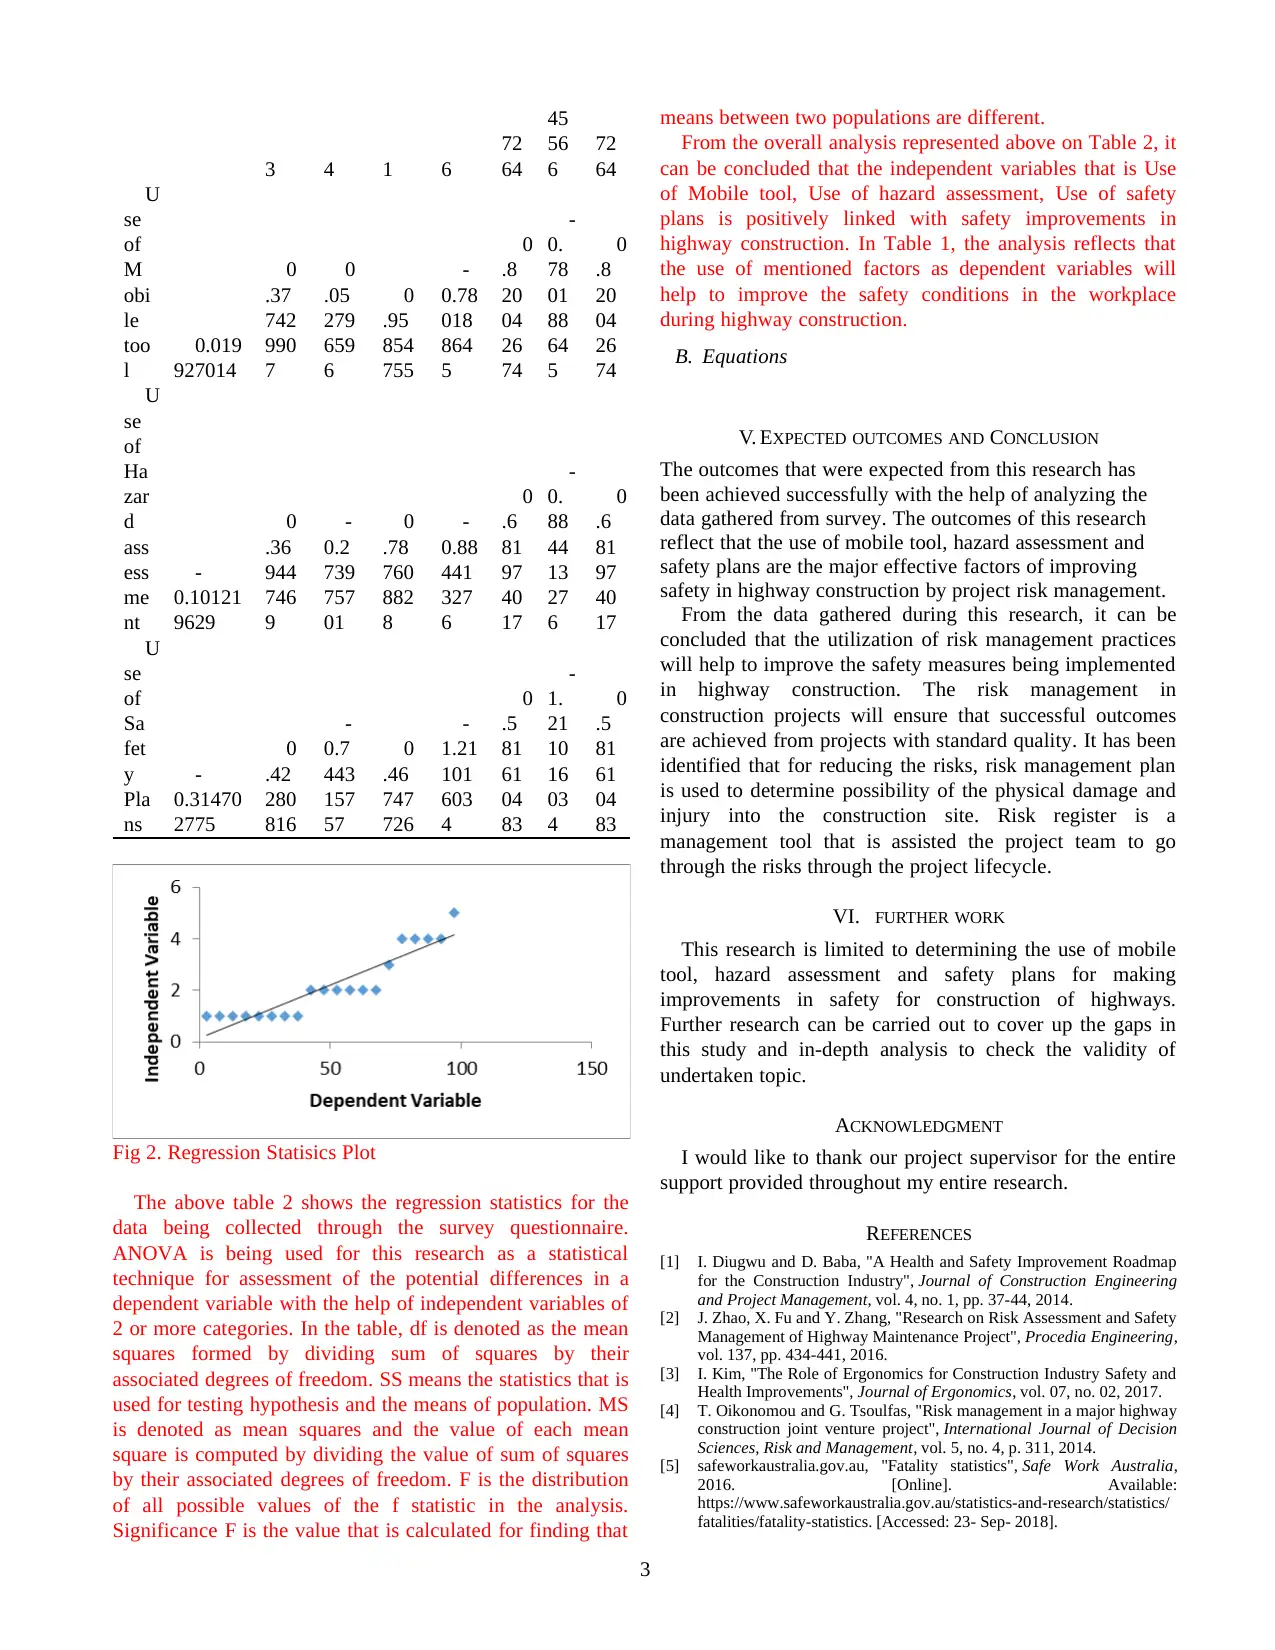
Fig 2. Regression Statisics Plot
The above table 2 shows the regression statistics for the
data being collected through the survey questionnaire.
ANOVA is being used for this research as a statistical
technique for assessment of the potential differences in a
dependent variable with the help of independent variables of
2 or more categories. In the table, df is denoted as the mean
squares formed by dividing sum of squares by their
associated degrees of freedom. SS means the statistics that is
used for testing hypothesis and the means of population. MS
is denoted as mean squares and the value of each mean
square is computed by dividing the value of sum of squares
by their associated degrees of freedom. F is the distribution
of all possible values of the f statistic in the analysis.
Significance F is the value that is calculated for finding that
means between two populations are different.
From the overall analysis represented above on Table 2, it
can be concluded that the independent variables that is Use
of Mobile tool, Use of hazard assessment, Use of safety
plans is positively linked with safety improvements in
highway construction. In Table 1, the analysis reflects that
the use of mentioned factors as dependent variables will
help to improve the safety conditions in the workplace
during highway construction.
B. Equations
V. EXPECTED OUTCOMES AND CONCLUSION
The outcomes that were expected from this research has
been achieved successfully with the help of analyzing the
data gathered from survey. The outcomes of this research
reflect that the use of mobile tool, hazard assessment and
safety plans are the major effective factors of improving
safety in highway construction by project risk management.
From the data gathered during this research, it can be
concluded that the utilization of risk management practices
will help to improve the safety measures being implemented
in highway construction. The risk management in
construction projects will ensure that successful outcomes
are achieved from projects with standard quality. It has been
identified that for reducing the risks, risk management plan
is used to determine possibility of the physical damage and
injury into the construction site. Risk register is a
management tool that is assisted the project team to go
through the risks through the project lifecycle.
VI. FURTHER WORK
This research is limited to determining the use of mobile
tool, hazard assessment and safety plans for making
improvements in safety for construction of highways.
Further research can be carried out to cover up the gaps in
this study and in-depth analysis to check the validity of
undertaken topic.
ACKNOWLEDGMENT
I would like to thank our project supervisor for the entire
support provided throughout my entire research.
REFERENCES
[1] I. Diugwu and D. Baba, "A Health and Safety Improvement Roadmap
for the Construction Industry", Journal of Construction Engineering
and Project Management, vol. 4, no. 1, pp. 37-44, 2014.
[2] J. Zhao, X. Fu and Y. Zhang, "Research on Risk Assessment and Safety
Management of Highway Maintenance Project", Procedia Engineering,
vol. 137, pp. 434-441, 2016.
[3] I. Kim, "The Role of Ergonomics for Construction Industry Safety and
Health Improvements", Journal of Ergonomics, vol. 07, no. 02, 2017.
[4] T. Oikonomou and G. Tsoulfas, "Risk management in a major highway
construction joint venture project", International Journal of Decision
Sciences, Risk and Management, vol. 5, no. 4, p. 311, 2014.
[5] safeworkaustralia.gov.au, "Fatality statistics", Safe Work Australia,
2016. [Online]. Available:
https://www.safeworkaustralia.gov.au/statistics-and-research/statistics/
fatalities/fatality-statistics. [Accessed: 23- Sep- 2018].
3
72
64
45
56
6
72
64
U
se
of
M
obi
le
too
l
0.019
927014
0
.37
742
990
7
0
.05
279
659
6
0
.95
854
755
-
0.78
018
864
5
0
.8
20
04
26
74
-
0.
78
01
88
64
5
0
.8
20
04
26
74
U
se
of
Ha
zar
d
ass
ess
me
nt
-
0.10121
9629
0
.36
944
746
9
-
0.2
739
757
01
0
.78
760
882
8
-
0.88
441
327
6
0
.6
81
97
40
17
-
0.
88
44
13
27
6
0
.6
81
97
40
17
U
se
of
Sa
fet
y
Pla
ns
-
0.31470
2775
0
.42
280
816
-
0.7
443
157
57
0
.46
747
726
-
1.21
101
603
4
0
.5
81
61
04
83
-
1.
21
10
16
03
4
0
.5
81
61
04
83
Fig 2. Regression Statisics Plot
The above table 2 shows the regression statistics for the
data being collected through the survey questionnaire.
ANOVA is being used for this research as a statistical
technique for assessment of the potential differences in a
dependent variable with the help of independent variables of
2 or more categories. In the table, df is denoted as the mean
squares formed by dividing sum of squares by their
associated degrees of freedom. SS means the statistics that is
used for testing hypothesis and the means of population. MS
is denoted as mean squares and the value of each mean
square is computed by dividing the value of sum of squares
by their associated degrees of freedom. F is the distribution
of all possible values of the f statistic in the analysis.
Significance F is the value that is calculated for finding that
means between two populations are different.
From the overall analysis represented above on Table 2, it
can be concluded that the independent variables that is Use
of Mobile tool, Use of hazard assessment, Use of safety
plans is positively linked with safety improvements in
highway construction. In Table 1, the analysis reflects that
the use of mentioned factors as dependent variables will
help to improve the safety conditions in the workplace
during highway construction.
B. Equations
V. EXPECTED OUTCOMES AND CONCLUSION
The outcomes that were expected from this research has
been achieved successfully with the help of analyzing the
data gathered from survey. The outcomes of this research
reflect that the use of mobile tool, hazard assessment and
safety plans are the major effective factors of improving
safety in highway construction by project risk management.
From the data gathered during this research, it can be
concluded that the utilization of risk management practices
will help to improve the safety measures being implemented
in highway construction. The risk management in
construction projects will ensure that successful outcomes
are achieved from projects with standard quality. It has been
identified that for reducing the risks, risk management plan
is used to determine possibility of the physical damage and
injury into the construction site. Risk register is a
management tool that is assisted the project team to go
through the risks through the project lifecycle.
VI. FURTHER WORK
This research is limited to determining the use of mobile
tool, hazard assessment and safety plans for making
improvements in safety for construction of highways.
Further research can be carried out to cover up the gaps in
this study and in-depth analysis to check the validity of
undertaken topic.
ACKNOWLEDGMENT
I would like to thank our project supervisor for the entire
support provided throughout my entire research.
REFERENCES
[1] I. Diugwu and D. Baba, "A Health and Safety Improvement Roadmap
for the Construction Industry", Journal of Construction Engineering
and Project Management, vol. 4, no. 1, pp. 37-44, 2014.
[2] J. Zhao, X. Fu and Y. Zhang, "Research on Risk Assessment and Safety
Management of Highway Maintenance Project", Procedia Engineering,
vol. 137, pp. 434-441, 2016.
[3] I. Kim, "The Role of Ergonomics for Construction Industry Safety and
Health Improvements", Journal of Ergonomics, vol. 07, no. 02, 2017.
[4] T. Oikonomou and G. Tsoulfas, "Risk management in a major highway
construction joint venture project", International Journal of Decision
Sciences, Risk and Management, vol. 5, no. 4, p. 311, 2014.
[5] safeworkaustralia.gov.au, "Fatality statistics", Safe Work Australia,
2016. [Online]. Available:
https://www.safeworkaustralia.gov.au/statistics-and-research/statistics/
fatalities/fatality-statistics. [Accessed: 23- Sep- 2018].
3
⊘ This is a preview!⊘
Do you want full access?
Subscribe today to unlock all pages.
Trusted by 1+ million students worldwide
[6] R. Thomson and J. McLeod, "New frontiers in qualitative longitudinal
research: an agenda for research", International Journal of Social
Research Methodology, vol. 18, no. 3, pp. 243-250, 2015.
[7] A. Thiem, "Designing research in the social sciences", International
Journal of Social Research Methodology, vol. 18, no. 4, pp. 453-454,
2015.
[8] B. Hwang, X. Zhao and L. Toh, "Risk management in small
construction projects in Singapore: Status, barriers and
impact", International Journal of Project Management, vol. 32, no. 1,
pp. 116-124, 2014.
[9] P. Szymański, "Risk management in construction projects", Procedia
Engineering, vol. 208, pp. 174-182, 2017.
[10] C. Maseko, "IDENTIFICATION OF RISK FACTORS AFFECTING
CONSTRUCTION OF PROJECTS: THE CASE OF EMERGING
ECONOMY", Risk Governance and Control: Financial Markets &
Institutions, vol. 7, no. 4-2, pp. 247-260, 2017.
4
Paraphrase This Document
Need a fresh take? Get an instant paraphrase of this document with our AI Paraphraser
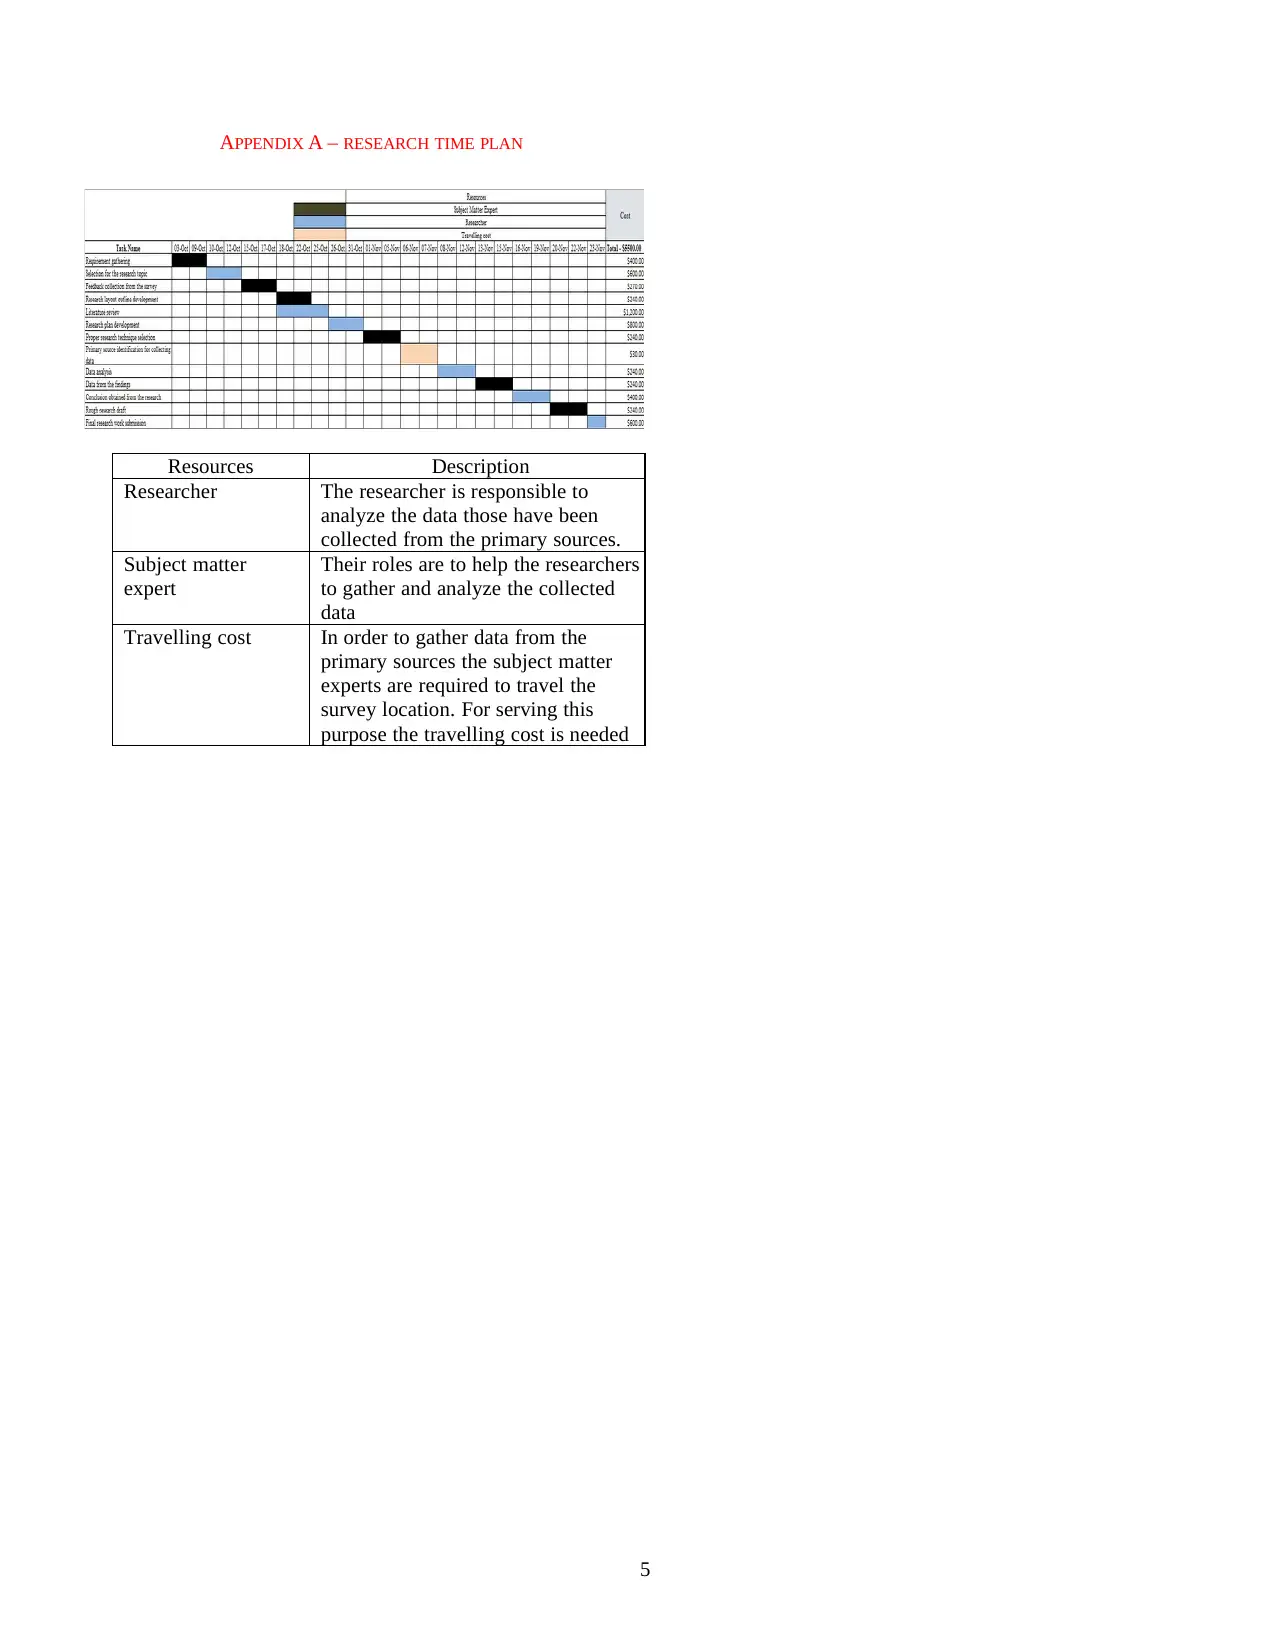
APPENDIX A – RESEARCH TIME PLAN
Resources Description
Researcher The researcher is responsible to
analyze the data those have been
collected from the primary sources.
Subject matter
expert
Their roles are to help the researchers
to gather and analyze the collected
data
Travelling cost In order to gather data from the
primary sources the subject matter
experts are required to travel the
survey location. For serving this
purpose the travelling cost is needed
5
1 out of 5
Related Documents


Your All-in-One AI-Powered Toolkit for Academic Success.
+13062052269
info@desklib.com
Available 24*7 on WhatsApp / Email
![[object Object]](/_next/static/media/star-bottom.7253800d.svg)
Unlock your academic potential
Copyright © 2020–2026 A2Z Services. All Rights Reserved. Developed and managed by ZUCOL.