Comparative Financial Analysis of Sainsbury's and Tesco's Performance
VerifiedAdded on 2021/02/19
|18
|4697
|44
Report
AI Summary
This report presents a detailed financial analysis of Sainsbury's and Tesco, two major retail companies. It includes a comprehensive examination of their financial statements, incorporating profitability, liquidity, and solvency ratios, along with efficiency and investment ratios from 2016 to 2019. The analysis utilizes both horizontal and vertical analysis techniques to compare income statements and balance sheets, providing insights into the companies' revenue trends, expenses, and overall financial health. The study also assesses the importance of working capital management and evaluates the cash flow statements over the specified period, offering a critical perspective on the companies' financial performance and strategic decisions. The report aims to provide a clear understanding of their financial positions and performance trends.
Financial Analysis
Management & Enterprise
Management & Enterprise
Paraphrase This Document
Need a fresh take? Get an instant paraphrase of this document with our AI Paraphraser
TABLE OF CONTENTS
INTRODUCTION...........................................................................................................................1
MAIN BODY...................................................................................................................................1
1. Financial statement of Sainsbury and Tesco...........................................................................1
2. Importance of analysing working capital in the organisation...............................................11
3. Evaluation of cash flow of last 2 year of the company.........................................................13
CONCLUSION..............................................................................................................................15
REFERENCES..............................................................................................................................16
INTRODUCTION
Financial analysis is an effective process of analysing the financial statement such as
income statement, balance sheet and cash flow of the company in order to assess the viability,
performance and profitability of the company. It is an effective process as it helps in determining
the cost of the project, budget and various other expenses.
The aim of this study is to make a detailed horizontal, vertical and ratio analysis of the
financial statements of the company. This study also outlines the value of examining the working
capital of the Sainsbury and Tesco in order to make strategic decision. This study will also
critically analyse the annual cash flow statements over the last 2 years.
Sainsbury's is one of the second largest retail company, which was founded in the year
1869 by John James Sainsbury. It mainly deals in groceries, food products, forecourt shop, etc.
Tesco plc. is a multinational British retail company which was founded in the year 1919
by Jack Cohen. It mainly deals in furniture, groceries, petrol, software, telecom services,
electronics, financial services, etc.
MAIN BODY
1. Financial statement of Sainsbury and Tesco.
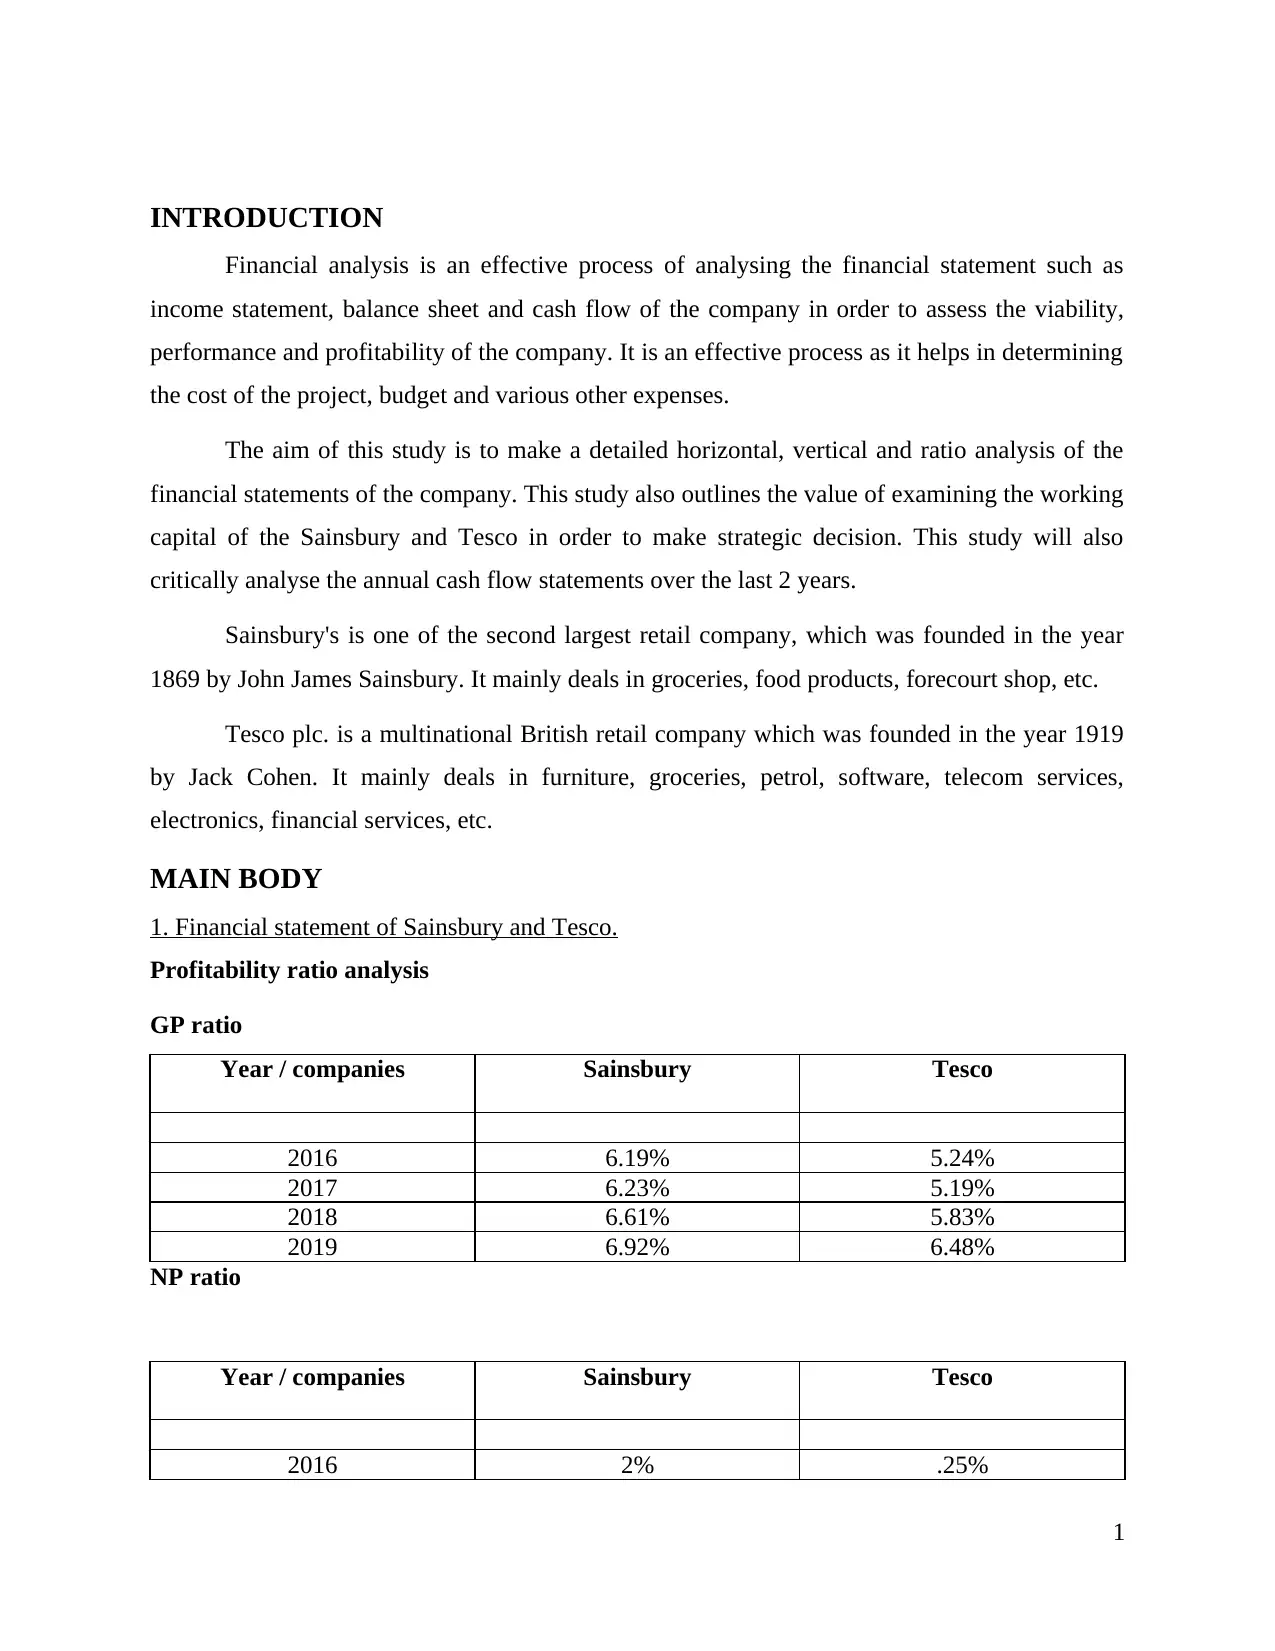
Profitability ratio analysis
GP ratio
Year / companies Sainsbury Tesco
2016 6.19% 5.24%
2017 6.23% 5.19%
2018 6.61% 5.83%
2019 6.92% 6.48%
NP ratio
Year / companies Sainsbury Tesco
2016 2% .25%
1
Financial analysis is an effective process of analysing the financial statement such as
income statement, balance sheet and cash flow of the company in order to assess the viability,
performance and profitability of the company. It is an effective process as it helps in determining
the cost of the project, budget and various other expenses.
The aim of this study is to make a detailed horizontal, vertical and ratio analysis of the
financial statements of the company. This study also outlines the value of examining the working
capital of the Sainsbury and Tesco in order to make strategic decision. This study will also
critically analyse the annual cash flow statements over the last 2 years.
Sainsbury's is one of the second largest retail company, which was founded in the year
1869 by John James Sainsbury. It mainly deals in groceries, food products, forecourt shop, etc.
Tesco plc. is a multinational British retail company which was founded in the year 1919
by Jack Cohen. It mainly deals in furniture, groceries, petrol, software, telecom services,
electronics, financial services, etc.
MAIN BODY
1. Financial statement of Sainsbury and Tesco.
Profitability ratio analysis
GP ratio
Year / companies Sainsbury Tesco
2016 6.19% 5.24%
2017 6.23% 5.19%
2018 6.61% 5.83%
2019 6.92% 6.48%
NP ratio
Year / companies Sainsbury Tesco
2016 2% .25%
1
⊘ This is a preview!⊘
Do you want full access?
Subscribe today to unlock all pages.
Trusted by 1+ million students worldwide
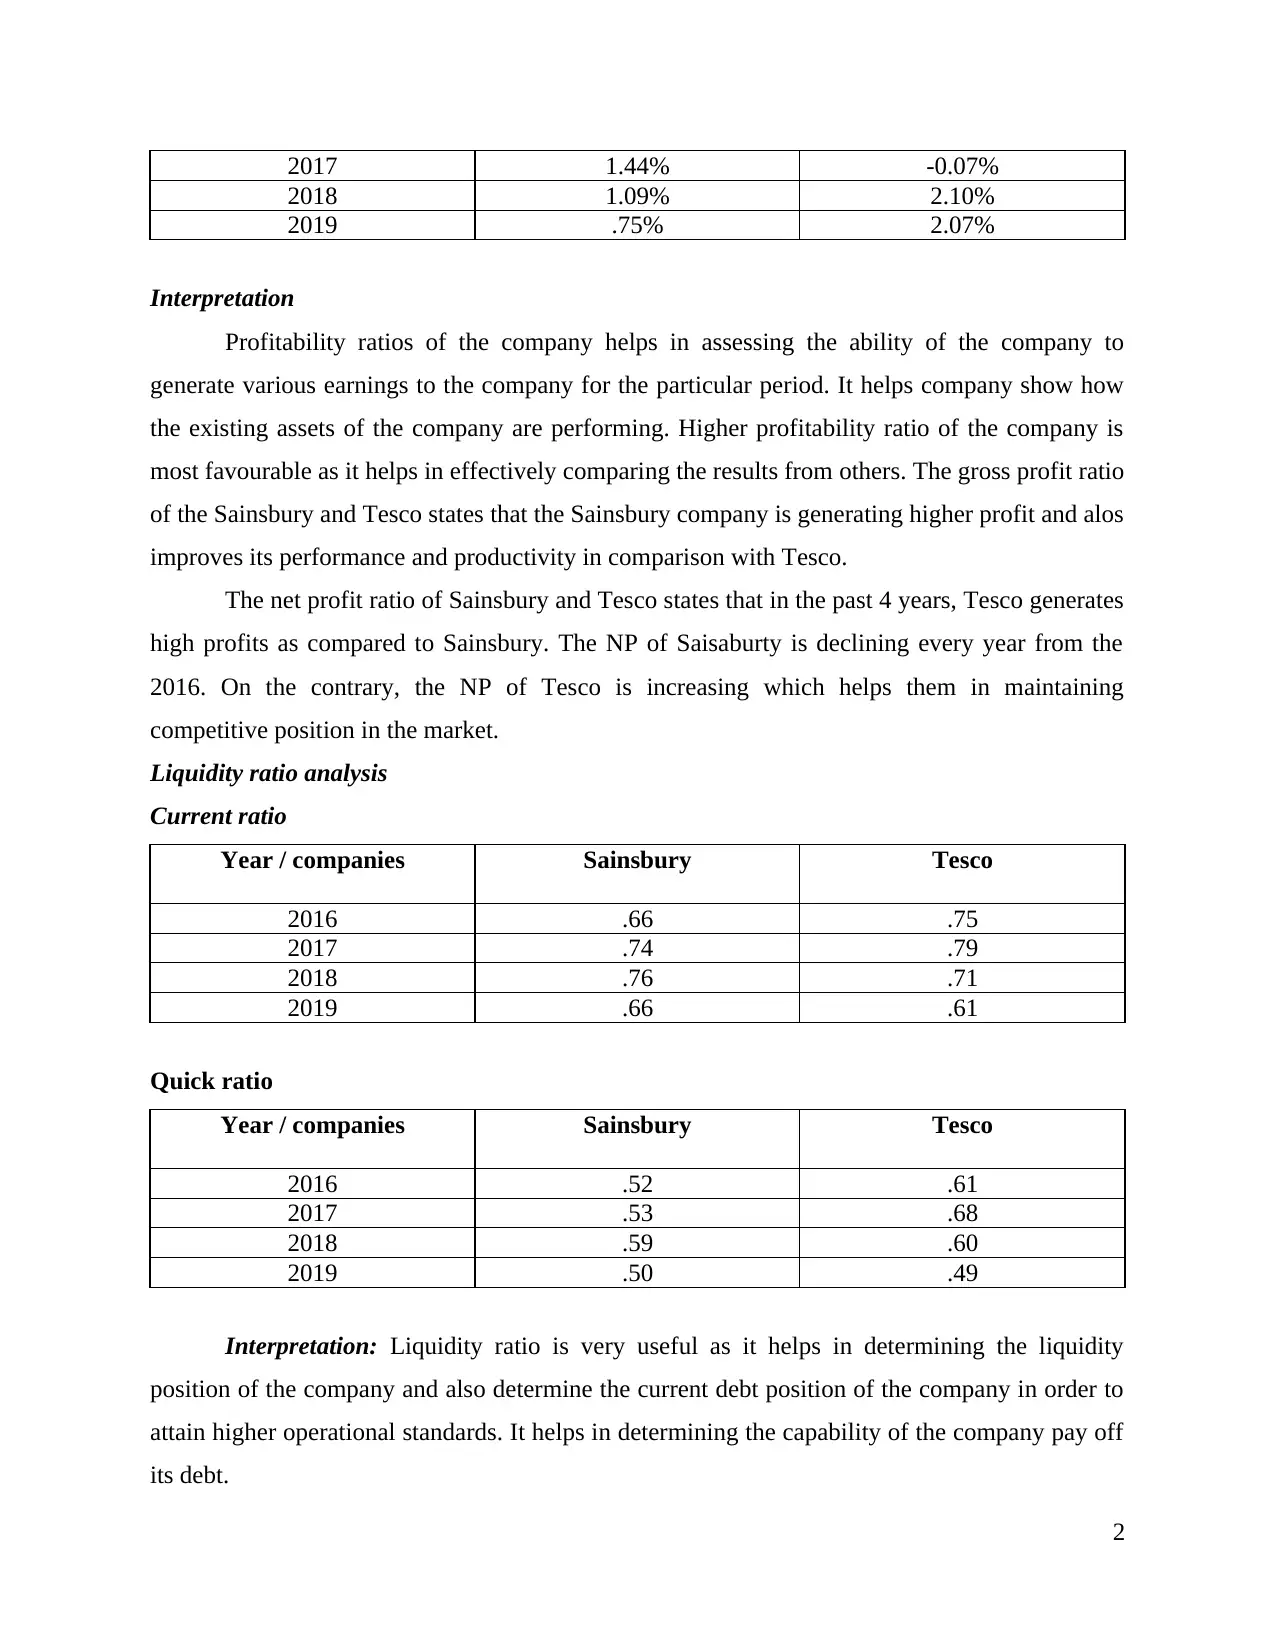
2017 1.44% -0.07%
2018 1.09% 2.10%
2019 .75% 2.07%
Interpretation
Profitability ratios of the company helps in assessing the ability of the company to
generate various earnings to the company for the particular period. It helps company show how
the existing assets of the company are performing. Higher profitability ratio of the company is
most favourable as it helps in effectively comparing the results from others. The gross profit ratio
of the Sainsbury and Tesco states that the Sainsbury company is generating higher profit and alos
improves its performance and productivity in comparison with Tesco.
The net profit ratio of Sainsbury and Tesco states that in the past 4 years, Tesco generates
high profits as compared to Sainsbury. The NP of Saisaburty is declining every year from the
2016. On the contrary, the NP of Tesco is increasing which helps them in maintaining
competitive position in the market.
Liquidity ratio analysis
Current ratio
Year / companies Sainsbury Tesco
2016 .66 .75
2017 .74 .79
2018 .76 .71
2019 .66 .61
Quick ratio
Year / companies Sainsbury Tesco
2016 .52 .61
2017 .53 .68
2018 .59 .60
2019 .50 .49
Interpretation: Liquidity ratio is very useful as it helps in determining the liquidity
position of the company and also determine the current debt position of the company in order to
attain higher operational standards. It helps in determining the capability of the company pay off
its debt.
2
Paraphrase This Document
Need a fresh take? Get an instant paraphrase of this document with our AI Paraphraser
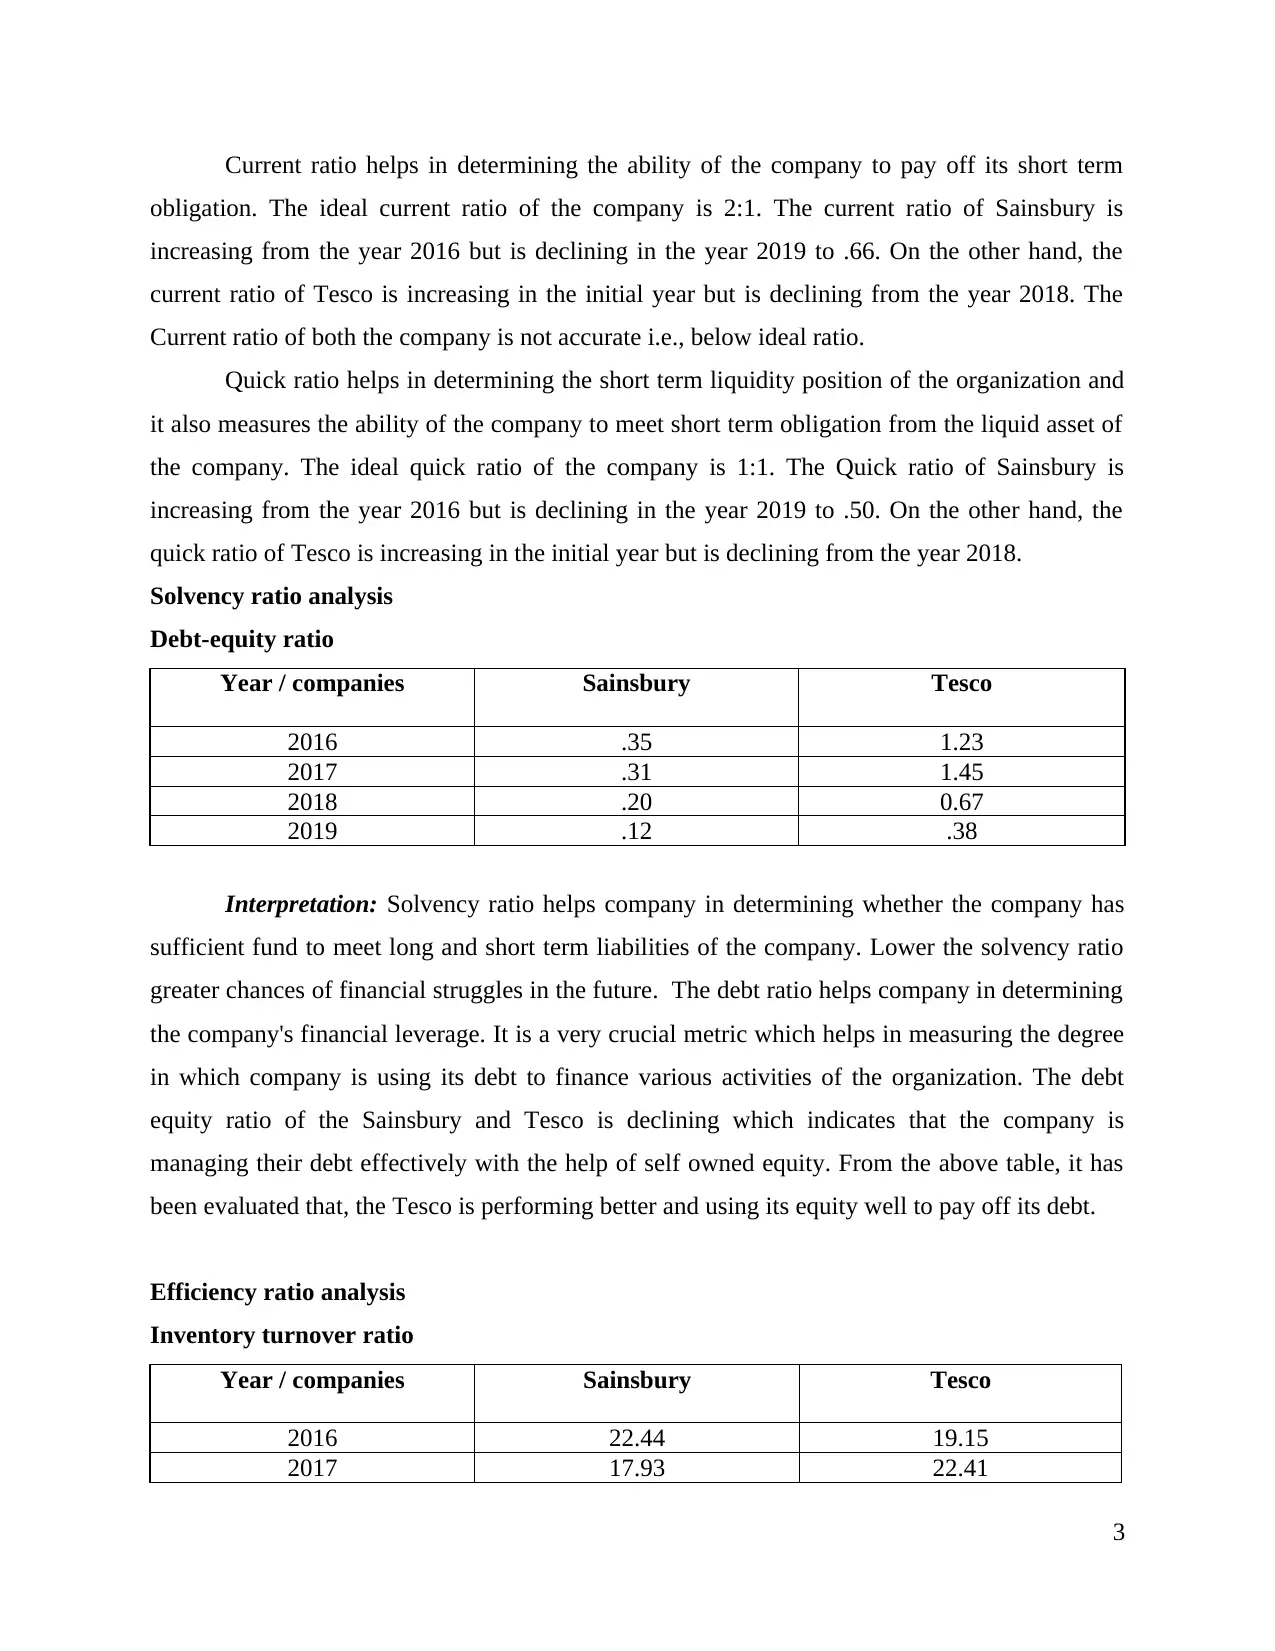
Current ratio helps in determining the ability of the company to pay off its short term
obligation. The ideal current ratio of the company is 2:1. The current ratio of Sainsbury is
increasing from the year 2016 but is declining in the year 2019 to .66. On the other hand, the
current ratio of Tesco is increasing in the initial year but is declining from the year 2018. The
Current ratio of both the company is not accurate i.e., below ideal ratio.
Quick ratio helps in determining the short term liquidity position of the organization and
it also measures the ability of the company to meet short term obligation from the liquid asset of
the company. The ideal quick ratio of the company is 1:1. The Quick ratio of Sainsbury is
increasing from the year 2016 but is declining in the year 2019 to .50. On the other hand, the
quick ratio of Tesco is increasing in the initial year but is declining from the year 2018.
Solvency ratio analysis
Debt-equity ratio
Year / companies Sainsbury Tesco
2016 .35 1.23
2017 .31 1.45
2018 .20 0.67
2019 .12 .38
Interpretation: Solvency ratio helps company in determining whether the company has
sufficient fund to meet long and short term liabilities of the company. Lower the solvency ratio
greater chances of financial struggles in the future. The debt ratio helps company in determining
the company's financial leverage. It is a very crucial metric which helps in measuring the degree
in which company is using its debt to finance various activities of the organization. The debt
equity ratio of the Sainsbury and Tesco is declining which indicates that the company is
managing their debt effectively with the help of self owned equity. From the above table, it has
been evaluated that, the Tesco is performing better and using its equity well to pay off its debt.
Efficiency ratio analysis
Inventory turnover ratio
Year / companies Sainsbury Tesco
2016 22.44 19.15
2017 17.93 22.41
3
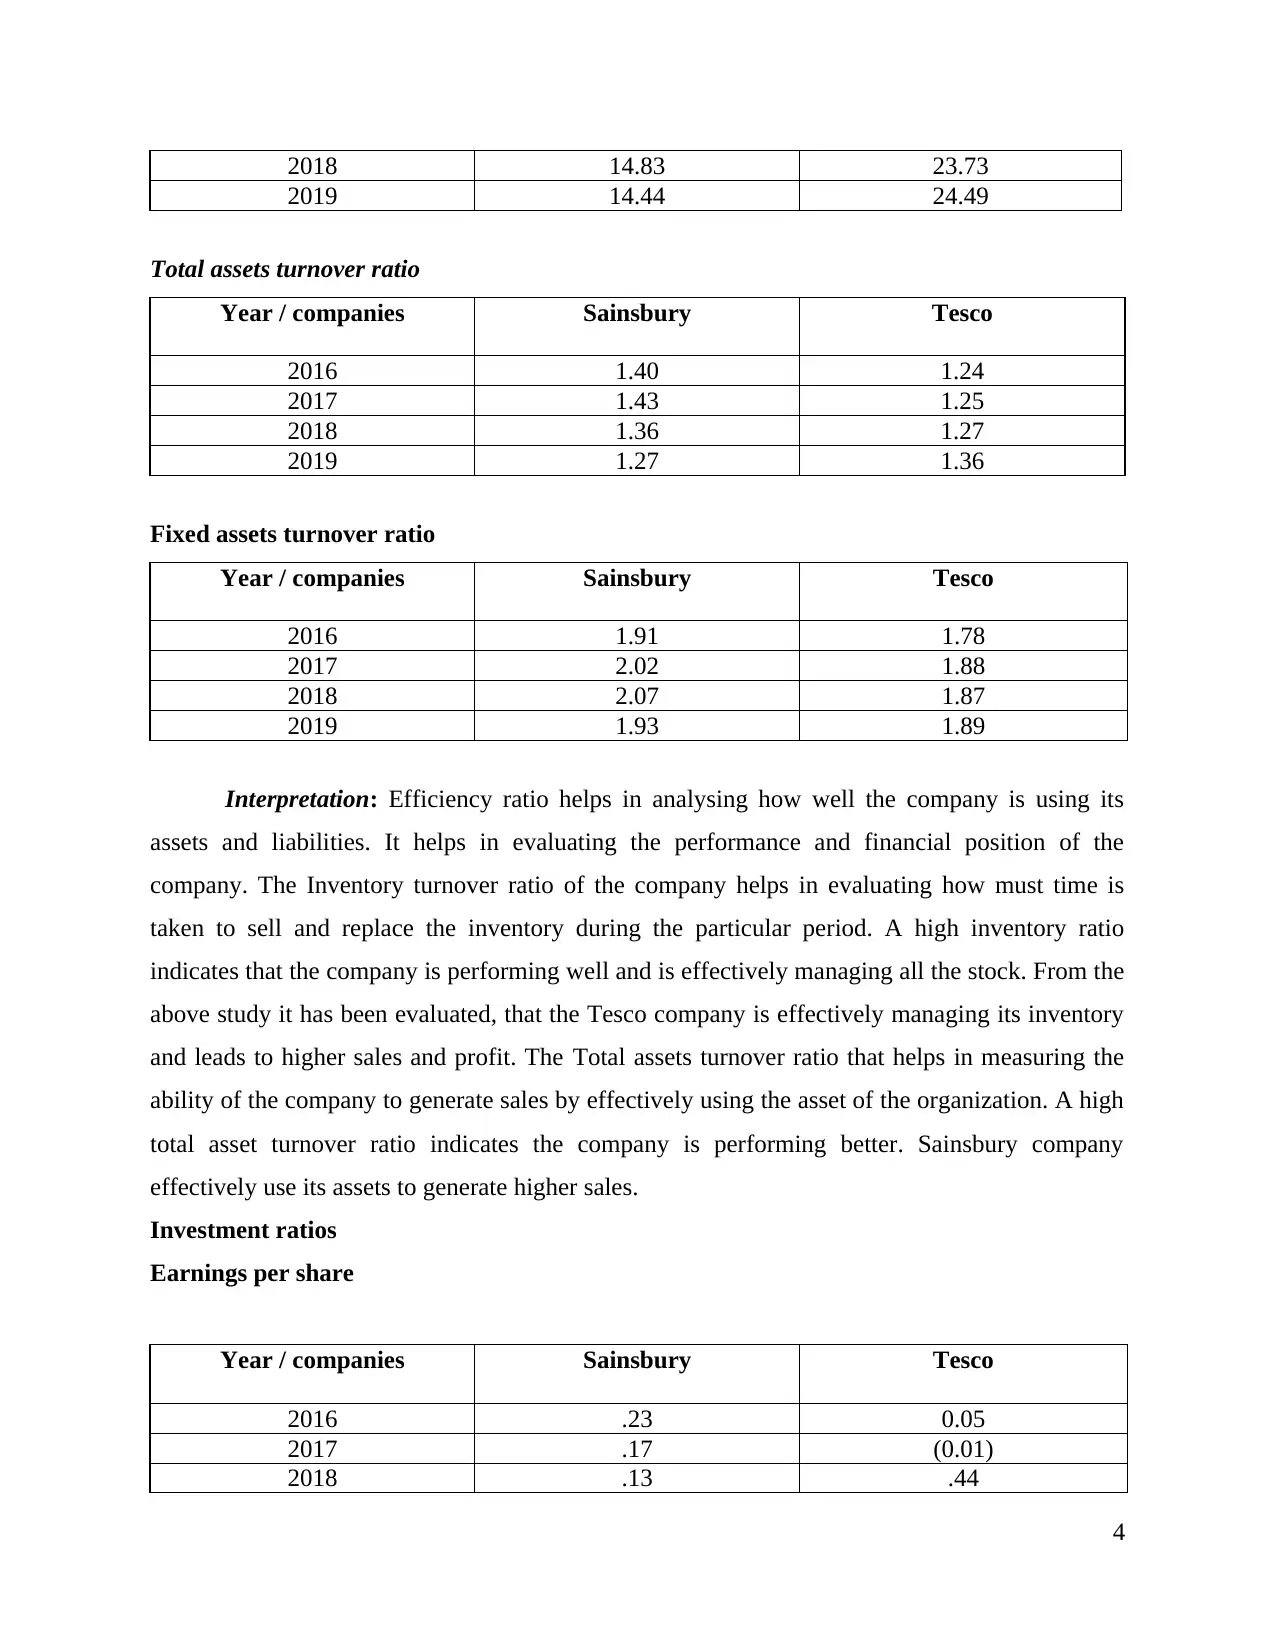
2018 14.83 23.73
2019 14.44 24.49
Total assets turnover ratio
Year / companies Sainsbury Tesco
2016 1.40 1.24
2017 1.43 1.25
2018 1.36 1.27
2019 1.27 1.36
Fixed assets turnover ratio
Year / companies Sainsbury Tesco
2016 1.91 1.78
2017 2.02 1.88
2018 2.07 1.87
2019 1.93 1.89
Interpretation: Efficiency ratio helps in analysing how well the company is using its
assets and liabilities. It helps in evaluating the performance and financial position of the
company. The Inventory turnover ratio of the company helps in evaluating how must time is
taken to sell and replace the inventory during the particular period. A high inventory ratio
indicates that the company is performing well and is effectively managing all the stock. From the
above study it has been evaluated, that the Tesco company is effectively managing its inventory
and leads to higher sales and profit. The Total assets turnover ratio that helps in measuring the
ability of the company to generate sales by effectively using the asset of the organization. A high
total asset turnover ratio indicates the company is performing better. Sainsbury company
effectively use its assets to generate higher sales.
Investment ratios
Earnings per share
Year / companies Sainsbury Tesco
2016 .23 0.05
2017 .17 (0.01)
2018 .13 .44
4
⊘ This is a preview!⊘
Do you want full access?
Subscribe today to unlock all pages.
Trusted by 1+ million students worldwide
2019 .08 .41
Dividends per share
Year / companies Sainsbury Tesco
2016 .12 -
2017 .12 -
2018 .1 .03
2019 .1 .11
Interpretation: Investment ratio is very useful as it helps in effectively providing
information to investors which helps them in taking investment decision. It helps investor in
evaluating whether they should invest in the particular company or not by critically investigating
the risk and uncertainties and the percentage of return and investment. The earning per share of
the company as it helps in determining the profit of the company by the number of O/s shares.
High earning per share is better as it helps in determining the profitability of the company and
the company also have sufficient balance to distribute it to the shareholders. The earning peer
share of Sainsbury is good as compared to Tesco.
Dividend per share ratio shows the declared dividends in the organization to every share
O/s. The investment ratio of the Sainsbury is better when compared with Tesco. Tesco is prone
to high level of risk and has to adapt effective strategies which helps in raising money from
investors.
Horizontal analysis of Sainsbury and Tesco
Horizontal analysis of income statements helps in comparison of various financial ratios,
setting benchmark, etc. The analysis can be conducted on the basis of expenses, assets, cost of
sales, revenues, cash, equity and liabilities, etc. It helps in effectively comparing the income
statement of the company by comparing it with the past year. This also helps in analysing the
current trends of the company in order to attain higher operational efficiency, performance and
productivity.
Income statement: Sainsbury
Particulars 2016
%
change
in 2017 2017
%
change
in 2018 2018
%
change
in 2019
201
9
Revenue 23,506 11.6% 26,224 8.5% 28,456 1.9% 29,
5
Paraphrase This Document
Need a fresh take? Get an instant paraphrase of this document with our AI Paraphraser
007
Cost of revenue 22,050 11.5% 24,590 8.1% 26,574 1.6%
27,
000
Gross profit 1,456 12.2% 1,634 15.2% 1,882 6.6%
2,0
07
Total operating expenses 749 32.4% 992 37.5% 1,364 24.3%
1,6
95
Operating income 707 -9.2% 642 -19.3% 518 -39.8% 312
Interest Expense 142 -8.5% 130 3.8% 135 -38.5% 83
Other income 26 -61.5% 10
Other expenses 17 -47.1% 9
Income before income t... 548 -8.2% 503 -18.7% 409 -41.6% 239
Provision for income t... 77 63.6% 126 -20.6% 100 -80.0% 20
Net income 471 -20.0% 377 -18.0% 309 -29.1% 219
Interpretation: The income statement of the Sainsbury company states that the revenue
of the company is increasing year after year. The total operating expense of the company is also
increasing from 749 in year 2016 to 1695 in the year 2019. The net income of the Sainsbury has
reduced over the years which results in lower operational standards and efficiency.
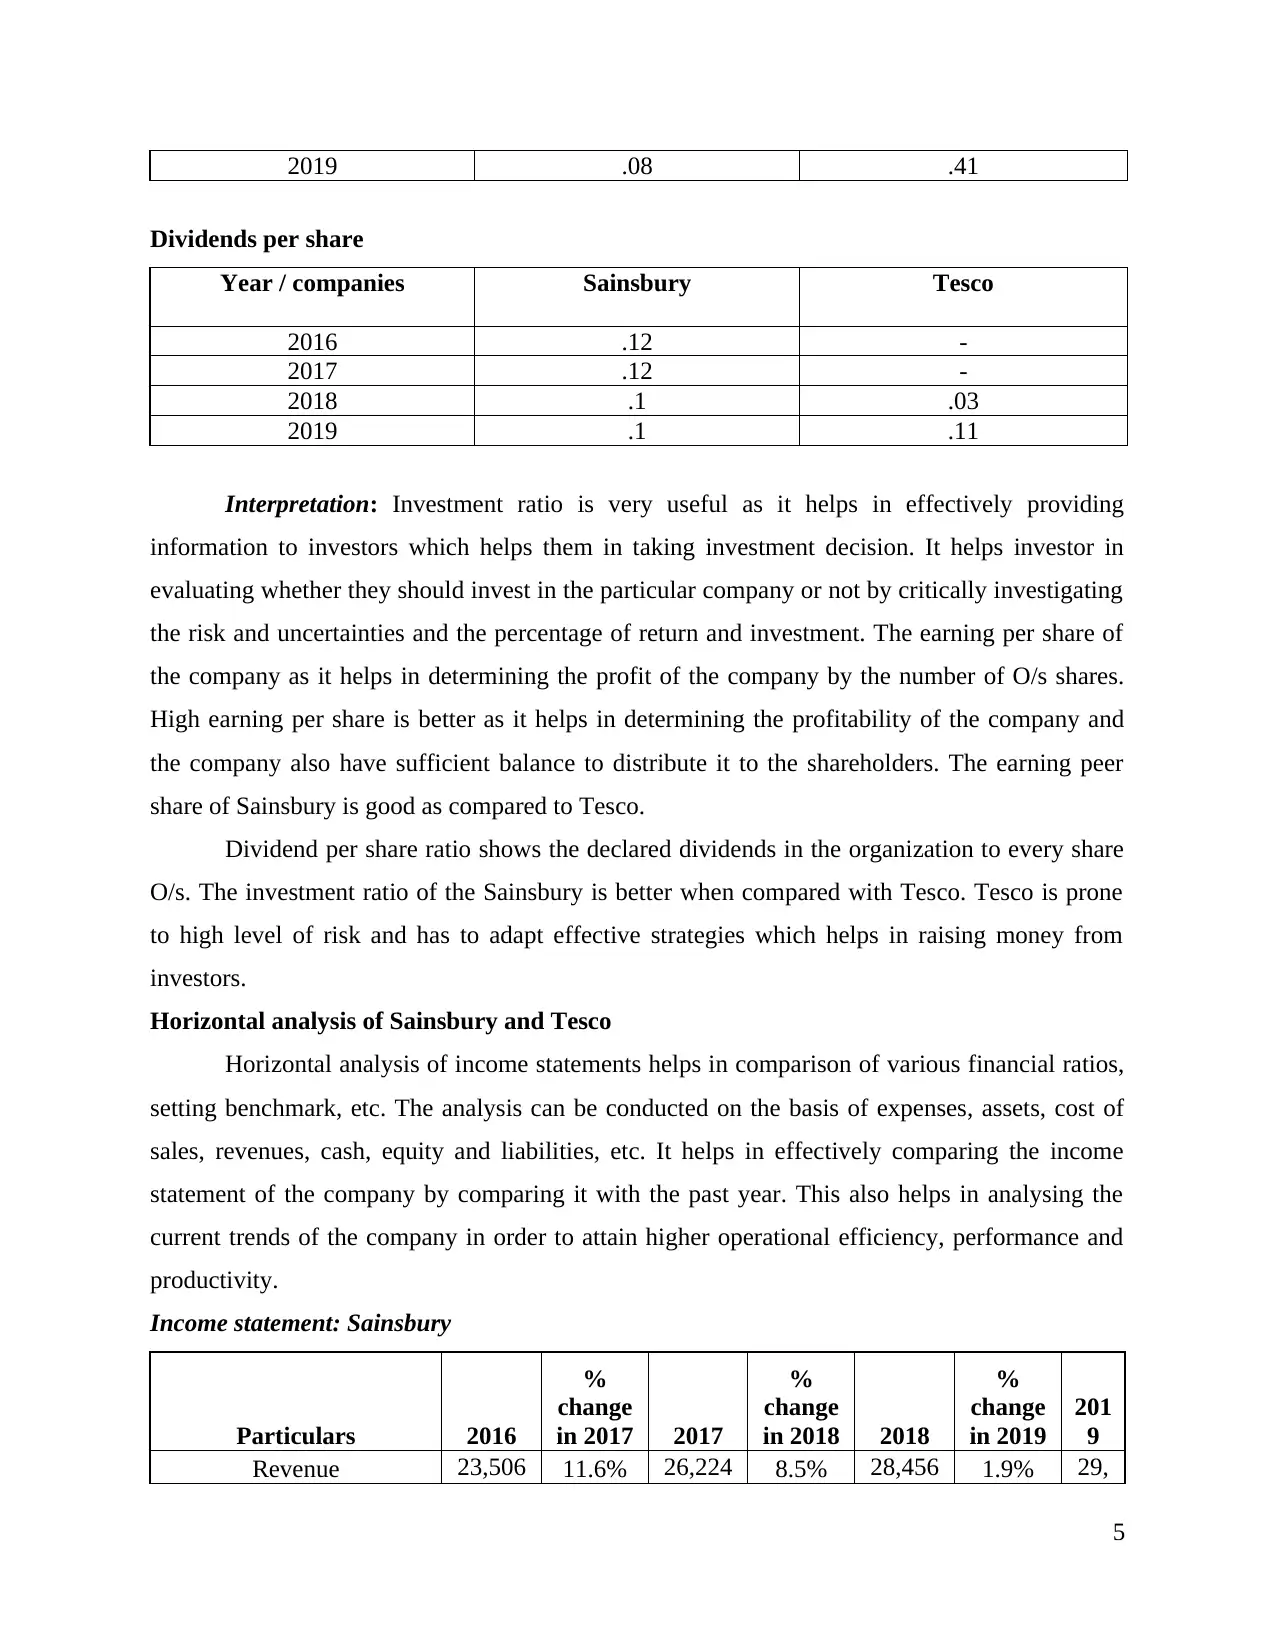
Tesco: Income statement
Interpretation: The income statement of the Tesco company states that the revenue of the
company is increasing over the years. The gross profit of the company is also increasing which
in turn results in higher operational productivity and profitability. The gross profit has increased
from 1.68% to 23.70% in 2019. The net income of the company is also increasing which results
in higher sustainable growth in the future. Tesco focuses on managing the income and
expenditure of the company which results in higher net income.
6
Cost of revenue 22,050 11.5% 24,590 8.1% 26,574 1.6%
27,
000
Gross profit 1,456 12.2% 1,634 15.2% 1,882 6.6%
2,0
07
Total operating expenses 749 32.4% 992 37.5% 1,364 24.3%
1,6
95
Operating income 707 -9.2% 642 -19.3% 518 -39.8% 312
Interest Expense 142 -8.5% 130 3.8% 135 -38.5% 83
Other income 26 -61.5% 10
Other expenses 17 -47.1% 9
Income before income t... 548 -8.2% 503 -18.7% 409 -41.6% 239
Provision for income t... 77 63.6% 126 -20.6% 100 -80.0% 20
Net income 471 -20.0% 377 -18.0% 309 -29.1% 219
Interpretation: The income statement of the Sainsbury company states that the revenue
of the company is increasing year after year. The total operating expense of the company is also
increasing from 749 in year 2016 to 1695 in the year 2019. The net income of the Sainsbury has
reduced over the years which results in lower operational standards and efficiency.
Tesco: Income statement
Interpretation: The income statement of the Tesco company states that the revenue of the
company is increasing over the years. The gross profit of the company is also increasing which
in turn results in higher operational productivity and profitability. The gross profit has increased
from 1.68% to 23.70% in 2019. The net income of the company is also increasing which results
in higher sustainable growth in the future. Tesco focuses on managing the income and
expenditure of the company which results in higher net income.
6
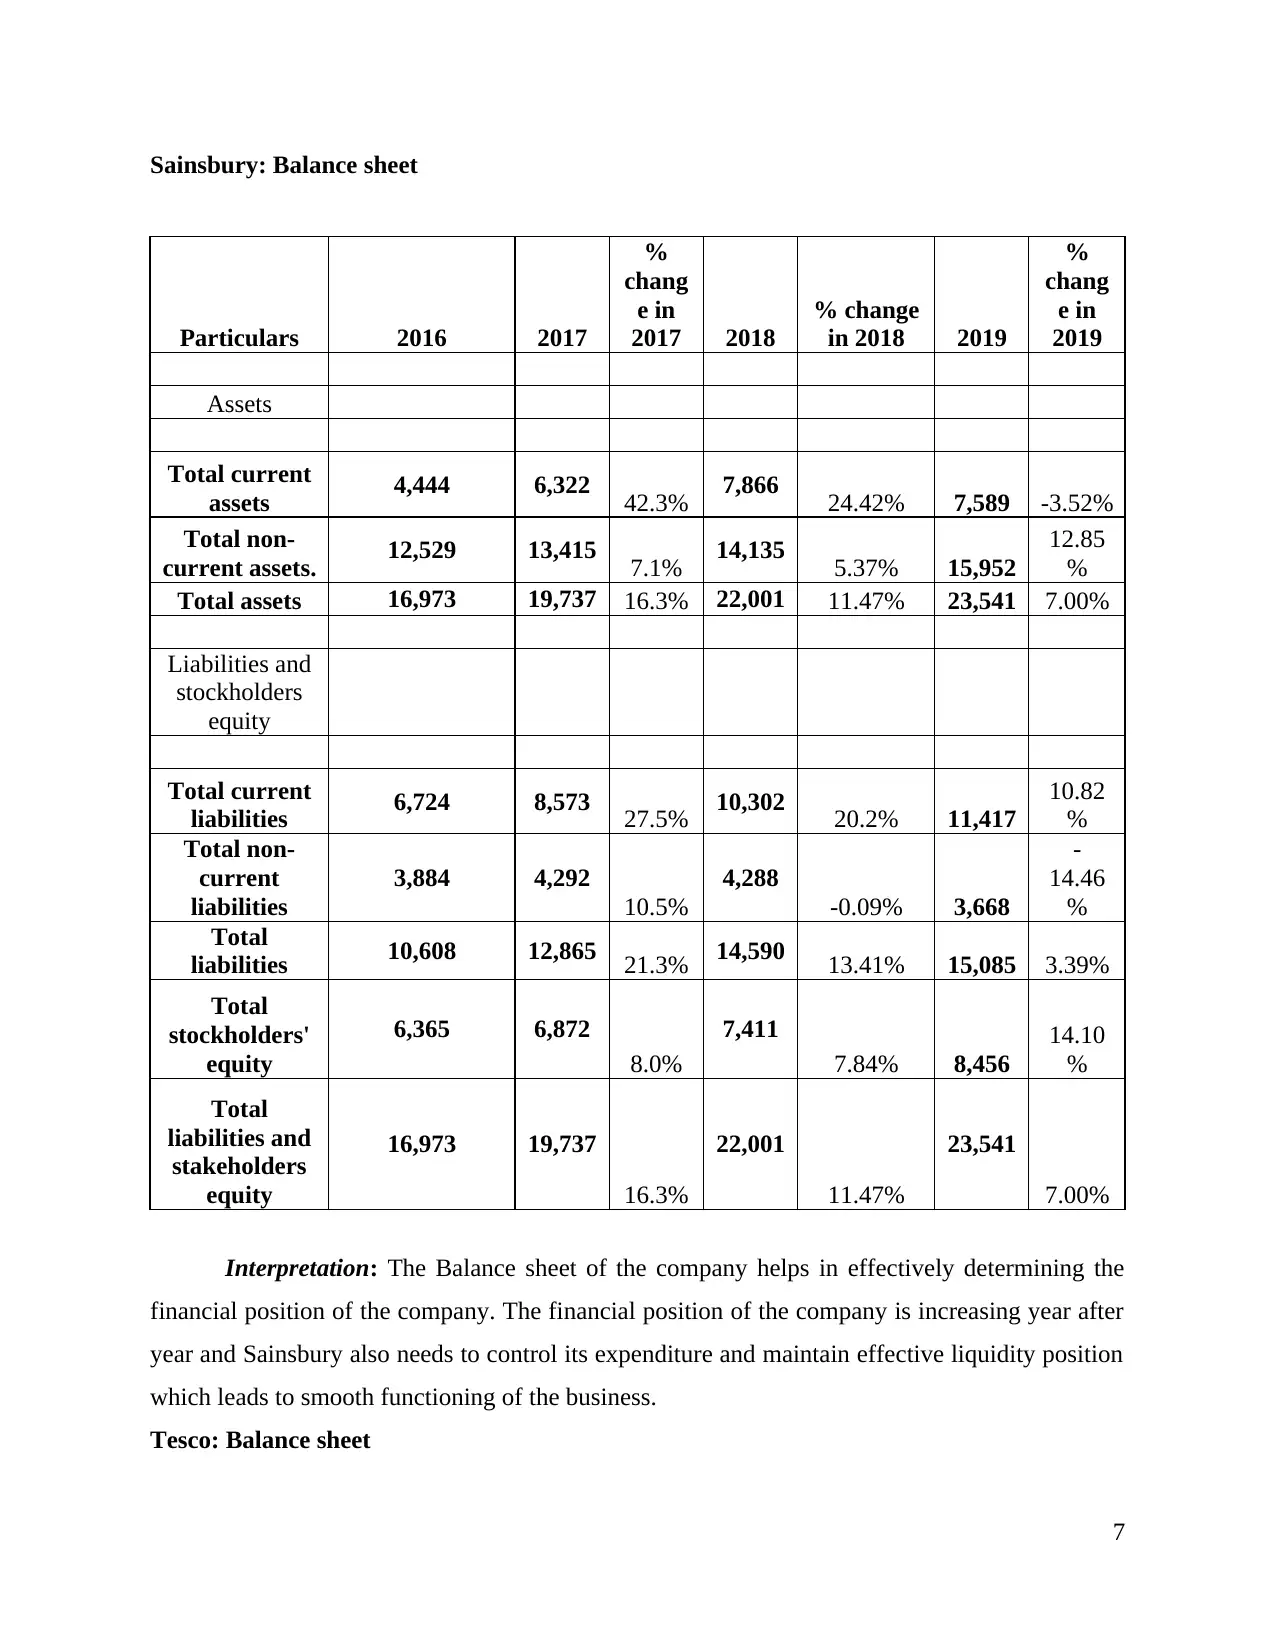
Sainsbury: Balance sheet
Particulars 2016 2017
%
chang
e in
2017 2018
% change
in 2018 2019
%
chang
e in
2019
Assets
Total current
assets 4,444 6,322 42.3% 7,866 24.42% 7,589 -3.52%
Total non-
current assets. 12,529 13,415 7.1% 14,135 5.37% 15,952
12.85
%
Total assets 16,973 19,737 16.3% 22,001 11.47% 23,541 7.00%
Liabilities and
stockholders
equity
Total current
liabilities 6,724 8,573 27.5% 10,302 20.2% 11,417
10.82
%
Total non-
current
liabilities
3,884 4,292
10.5%
4,288
-0.09% 3,668
-
14.46
%
Total
liabilities 10,608 12,865 21.3% 14,590 13.41% 15,085 3.39%
Total
stockholders'
equity
6,365 6,872
8.0%
7,411
7.84% 8,456
14.10
%
Total
liabilities and
stakeholders
equity
16,973 19,737
16.3%
22,001
11.47%
23,541
7.00%
Interpretation: The Balance sheet of the company helps in effectively determining the
financial position of the company. The financial position of the company is increasing year after
year and Sainsbury also needs to control its expenditure and maintain effective liquidity position
which leads to smooth functioning of the business.
Tesco: Balance sheet
7
⊘ This is a preview!⊘
Do you want full access?
Subscribe today to unlock all pages.
Trusted by 1+ million students worldwide
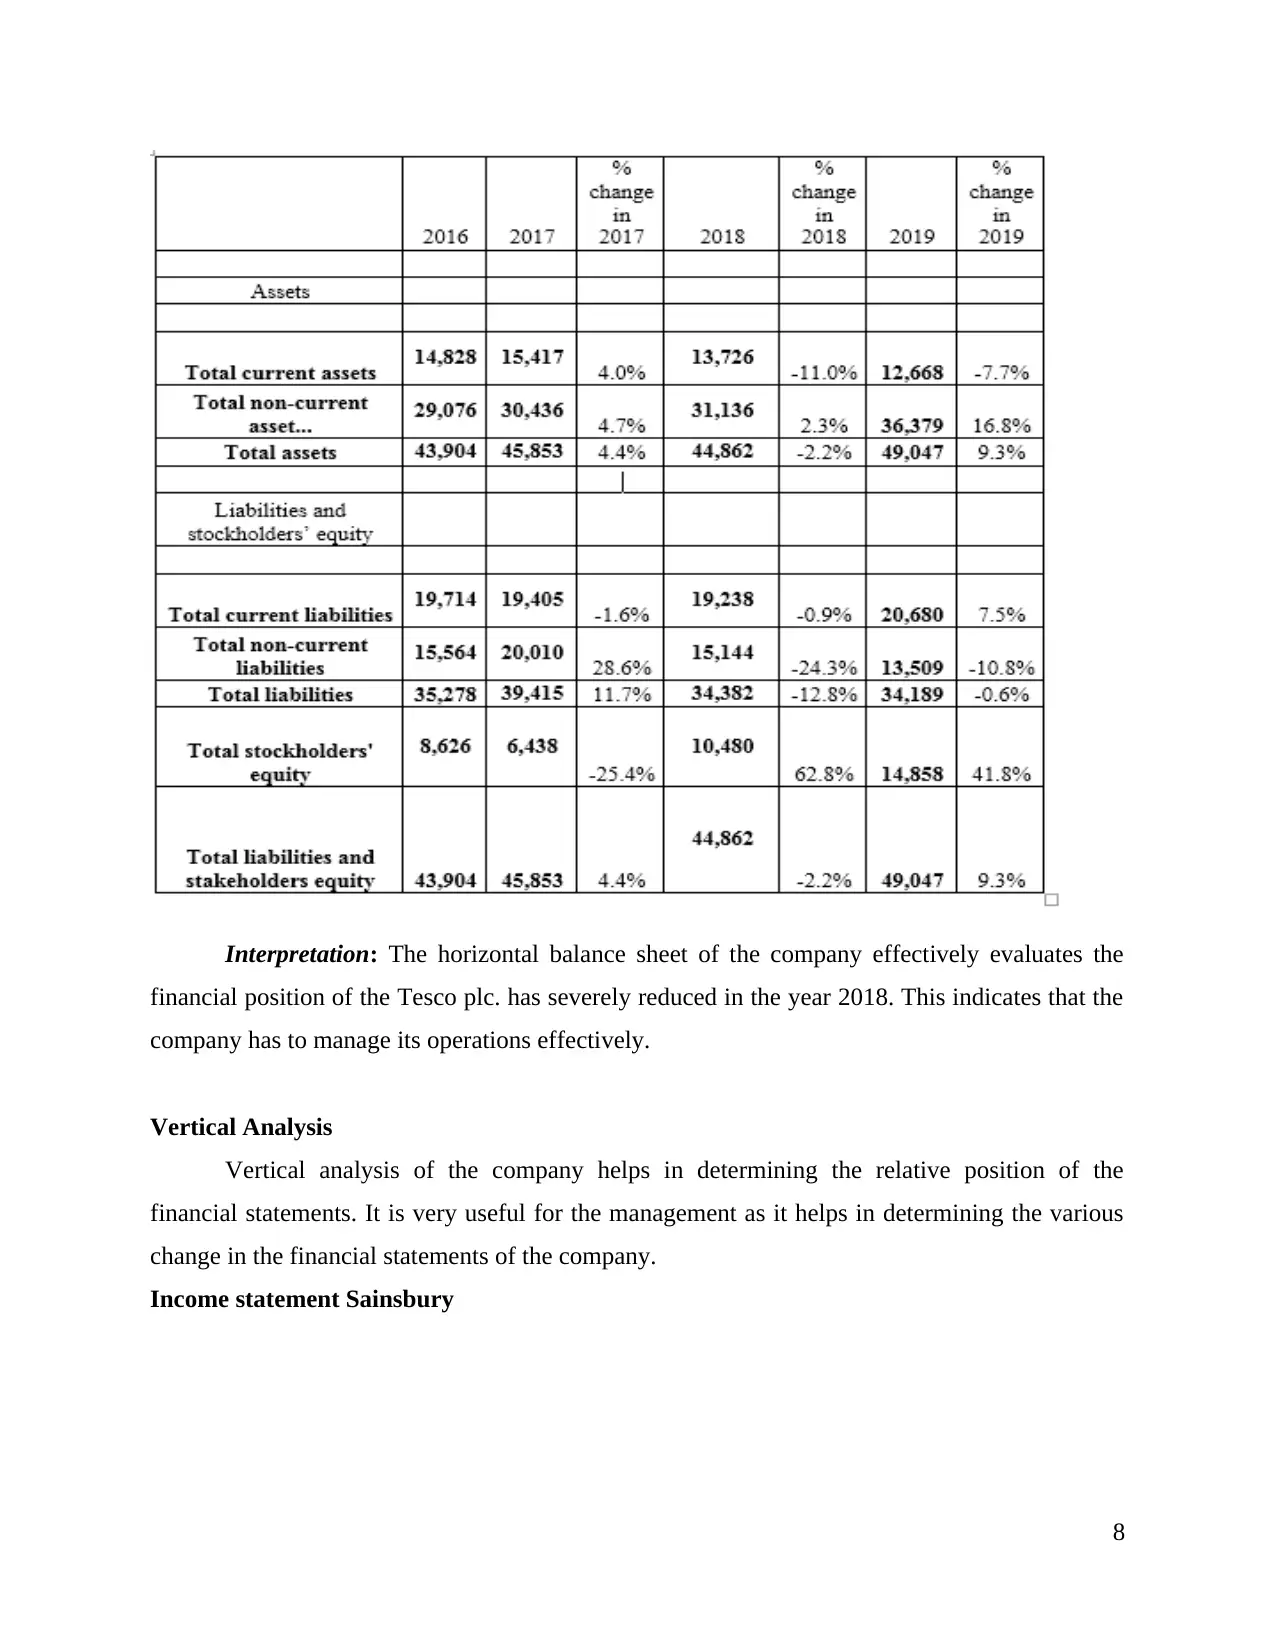
Interpretation: The horizontal balance sheet of the company effectively evaluates the
financial position of the Tesco plc. has severely reduced in the year 2018. This indicates that the
company has to manage its operations effectively.
Vertical Analysis
Vertical analysis of the company helps in determining the relative position of the
financial statements. It is very useful for the management as it helps in determining the various
change in the financial statements of the company.
Income statement Sainsbury
8
Paraphrase This Document
Need a fresh take? Get an instant paraphrase of this document with our AI Paraphraser
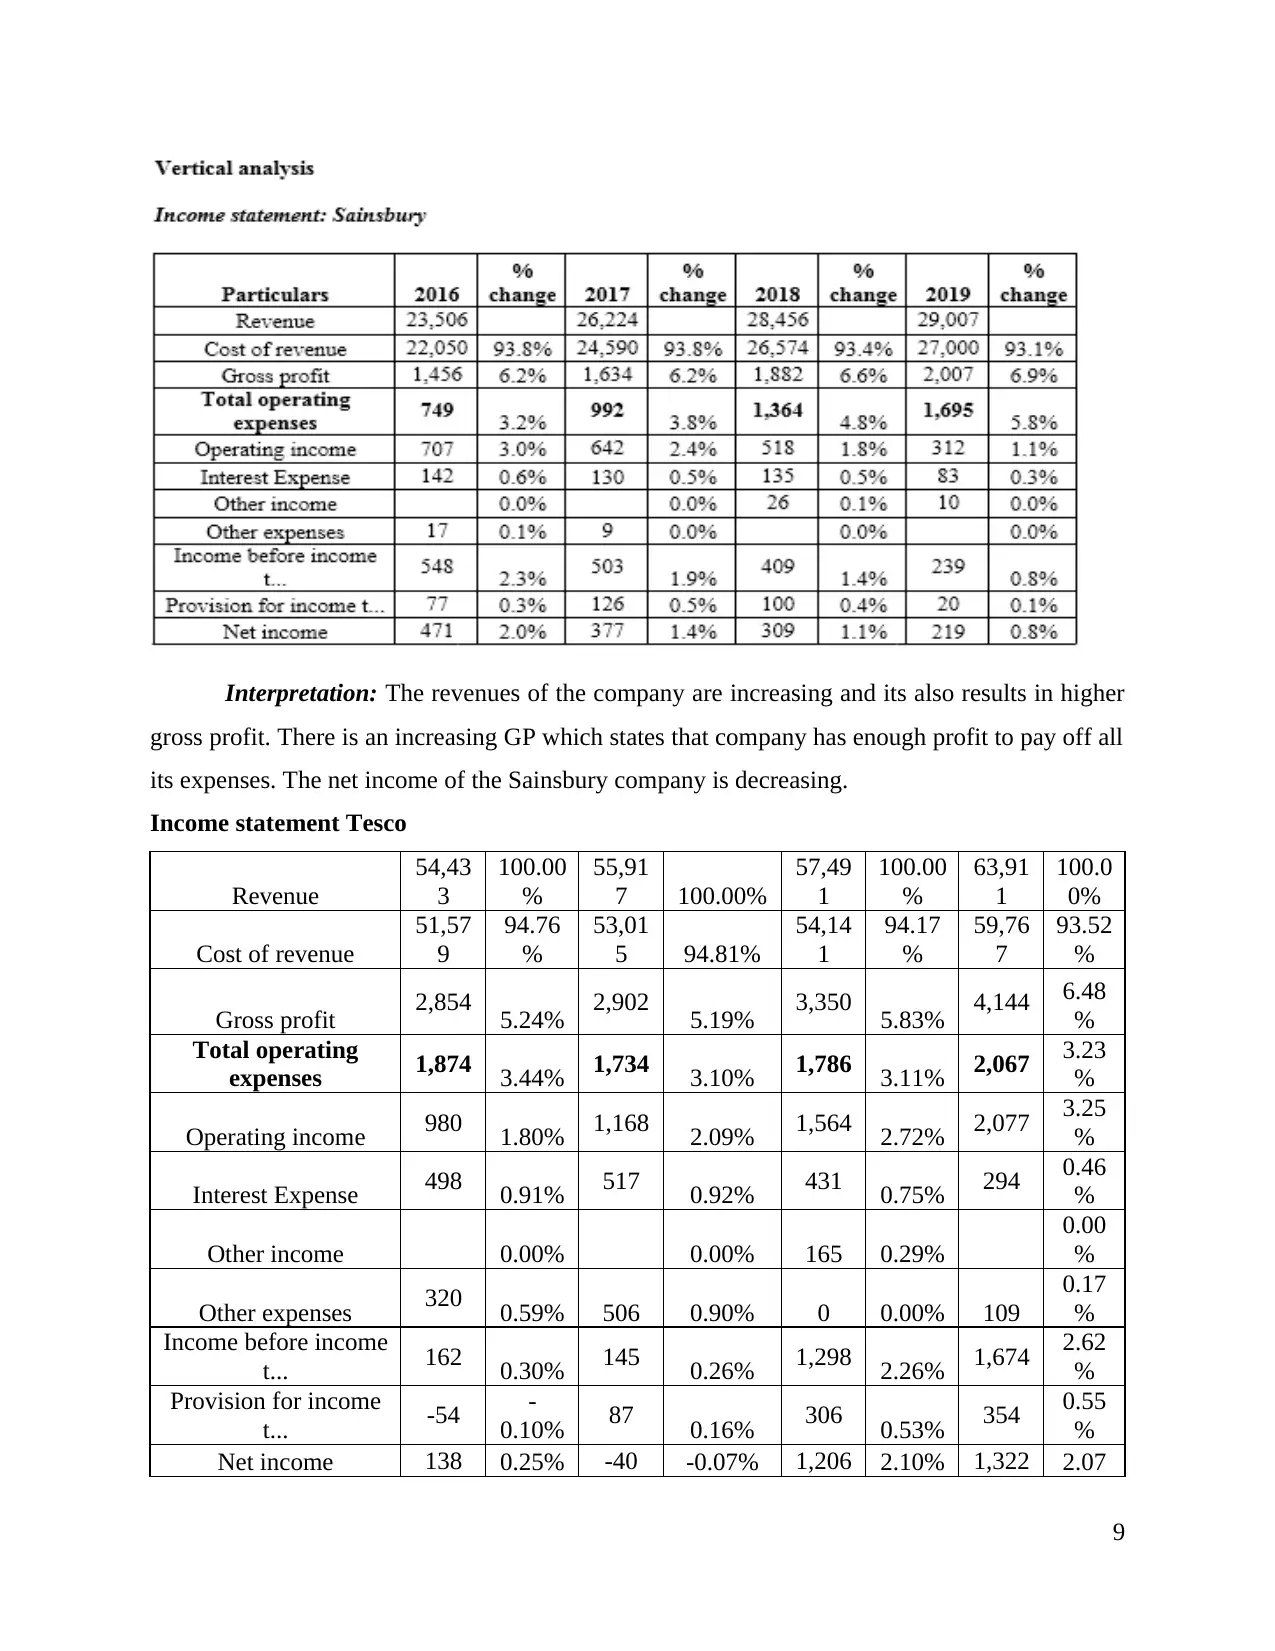
Interpretation: The revenues of the company are increasing and its also results in higher
gross profit. There is an increasing GP which states that company has enough profit to pay off all
its expenses. The net income of the Sainsbury company is decreasing.
Income statement Tesco
Revenue
54,43
3
100.00
%
55,91
7 100.00%
57,49
1
100.00
%
63,91
1
100.0
0%
Cost of revenue
51,57
9
94.76
%
53,01
5 94.81%
54,14
1
94.17
%
59,76
7
93.52
%
Gross profit 2,854 5.24% 2,902 5.19% 3,350 5.83% 4,144 6.48
%
Total operating
expenses 1,874 3.44% 1,734 3.10% 1,786 3.11% 2,067 3.23
%
Operating income 980 1.80% 1,168 2.09% 1,564 2.72% 2,077 3.25
%
Interest Expense 498 0.91% 517 0.92% 431 0.75% 294 0.46
%
Other income 0.00% 0.00% 165 0.29%
0.00
%
Other expenses 320 0.59% 506 0.90% 0 0.00% 109
0.17
%
Income before income
t... 162 0.30% 145 0.26% 1,298 2.26% 1,674 2.62
%
Provision for income
t... -54 -
0.10% 87 0.16% 306 0.53% 354 0.55
%
Net income 138 0.25% -40 -0.07% 1,206 2.10% 1,322 2.07
9
%
Interpretation: The revenues of the company are increasing which in turn results in
higher operational growth and efficiency. The GP of the Tesco is also increasing which results in
increasing trends of profit from the year 2017 to 2019. The net income of the company is lowest
in the year 2017 and has increased by 2.07% in the year 2019.
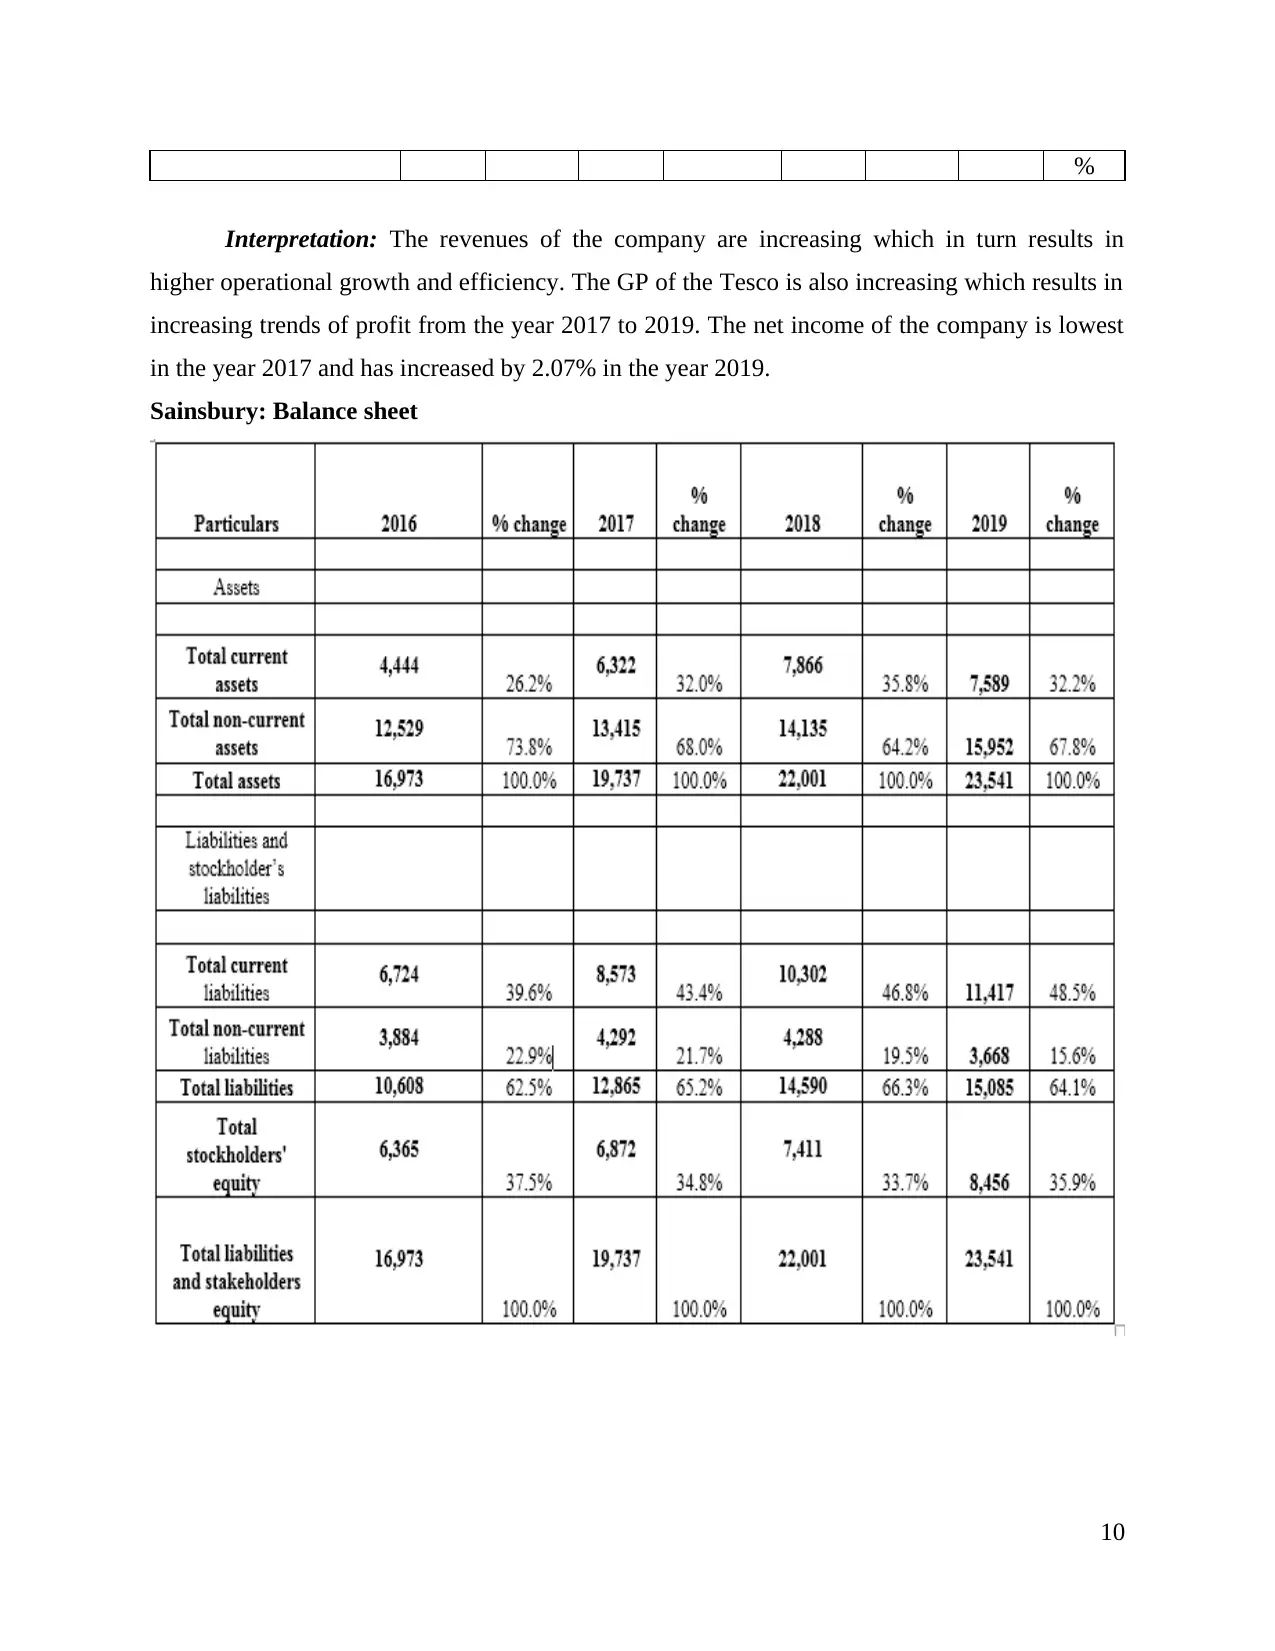
Sainsbury: Balance sheet
10
Interpretation: The revenues of the company are increasing which in turn results in
higher operational growth and efficiency. The GP of the Tesco is also increasing which results in
increasing trends of profit from the year 2017 to 2019. The net income of the company is lowest
in the year 2017 and has increased by 2.07% in the year 2019.
Sainsbury: Balance sheet
10
⊘ This is a preview!⊘
Do you want full access?
Subscribe today to unlock all pages.
Trusted by 1+ million students worldwide
1 out of 18
Related Documents


Your All-in-One AI-Powered Toolkit for Academic Success.
+13062052269
info@desklib.com
Available 24*7 on WhatsApp / Email
![[object Object]](/_next/static/media/star-bottom.7253800d.svg)
Unlock your academic potential
Copyright © 2020–2026 A2Z Services. All Rights Reserved. Developed and managed by ZUCOL.