Comparative Financial Analysis of Sainsbury and Tesco: 2018-2019
VerifiedAdded on 2023/01/03
|14
|3777
|26
Report
AI Summary
This report provides a comprehensive financial analysis of Sainsbury and Tesco, two major UK supermarket chains, for the years 2018 and 2019. It begins with a detailed presentation of key financial ratios, including liquidity, profitability, efficiency, gearing, and investor ratios, calculated from the companies' financial statements. The analysis delves into the performance and financial positions of both companies, highlighting their strengths and weaknesses based on the calculated ratios. The report then offers recommendations for improving the financial performance of the companies, focusing on strategies to enhance profitability and liquidity. Finally, it acknowledges the limitations of relying solely on financial ratios for performance interpretation, such as the dependence on historical data and the exclusion of market conditions. The report concludes by assessing the investment potential of each company based on the financial analysis conducted.

MANAGERIAL FINANCE
Paraphrase This Document
Need a fresh take? Get an instant paraphrase of this document with our AI Paraphraser
TABLE OF CONTENTS
PORTFOLIO 1.................................................................................................................................3
a) Financial Ratios of Sainsbury and Tesco for the year ending 2018 & 2019...........................3
b) Analysis of performance, financial position and the investment potential of Sainsbury and
Tesco............................................................................................................................................5
c. Recommendation on improving the financial performance of company.................................8
d. Limitation of relying over financial ratios in interpreting performance of company..............9
PORTOFOLIO 2..............................................................................................................................9
a. Use of appropriate investment appraisal techniques for project A and project B....................9
b. Limitation of using the investment appraisal techniques in long term decision making.......13
REFERENCES..............................................................................................................................15
PORTFOLIO 1
a) Financial Ratios of Sainsbury and Tesco for the year ending 2018 & 2019
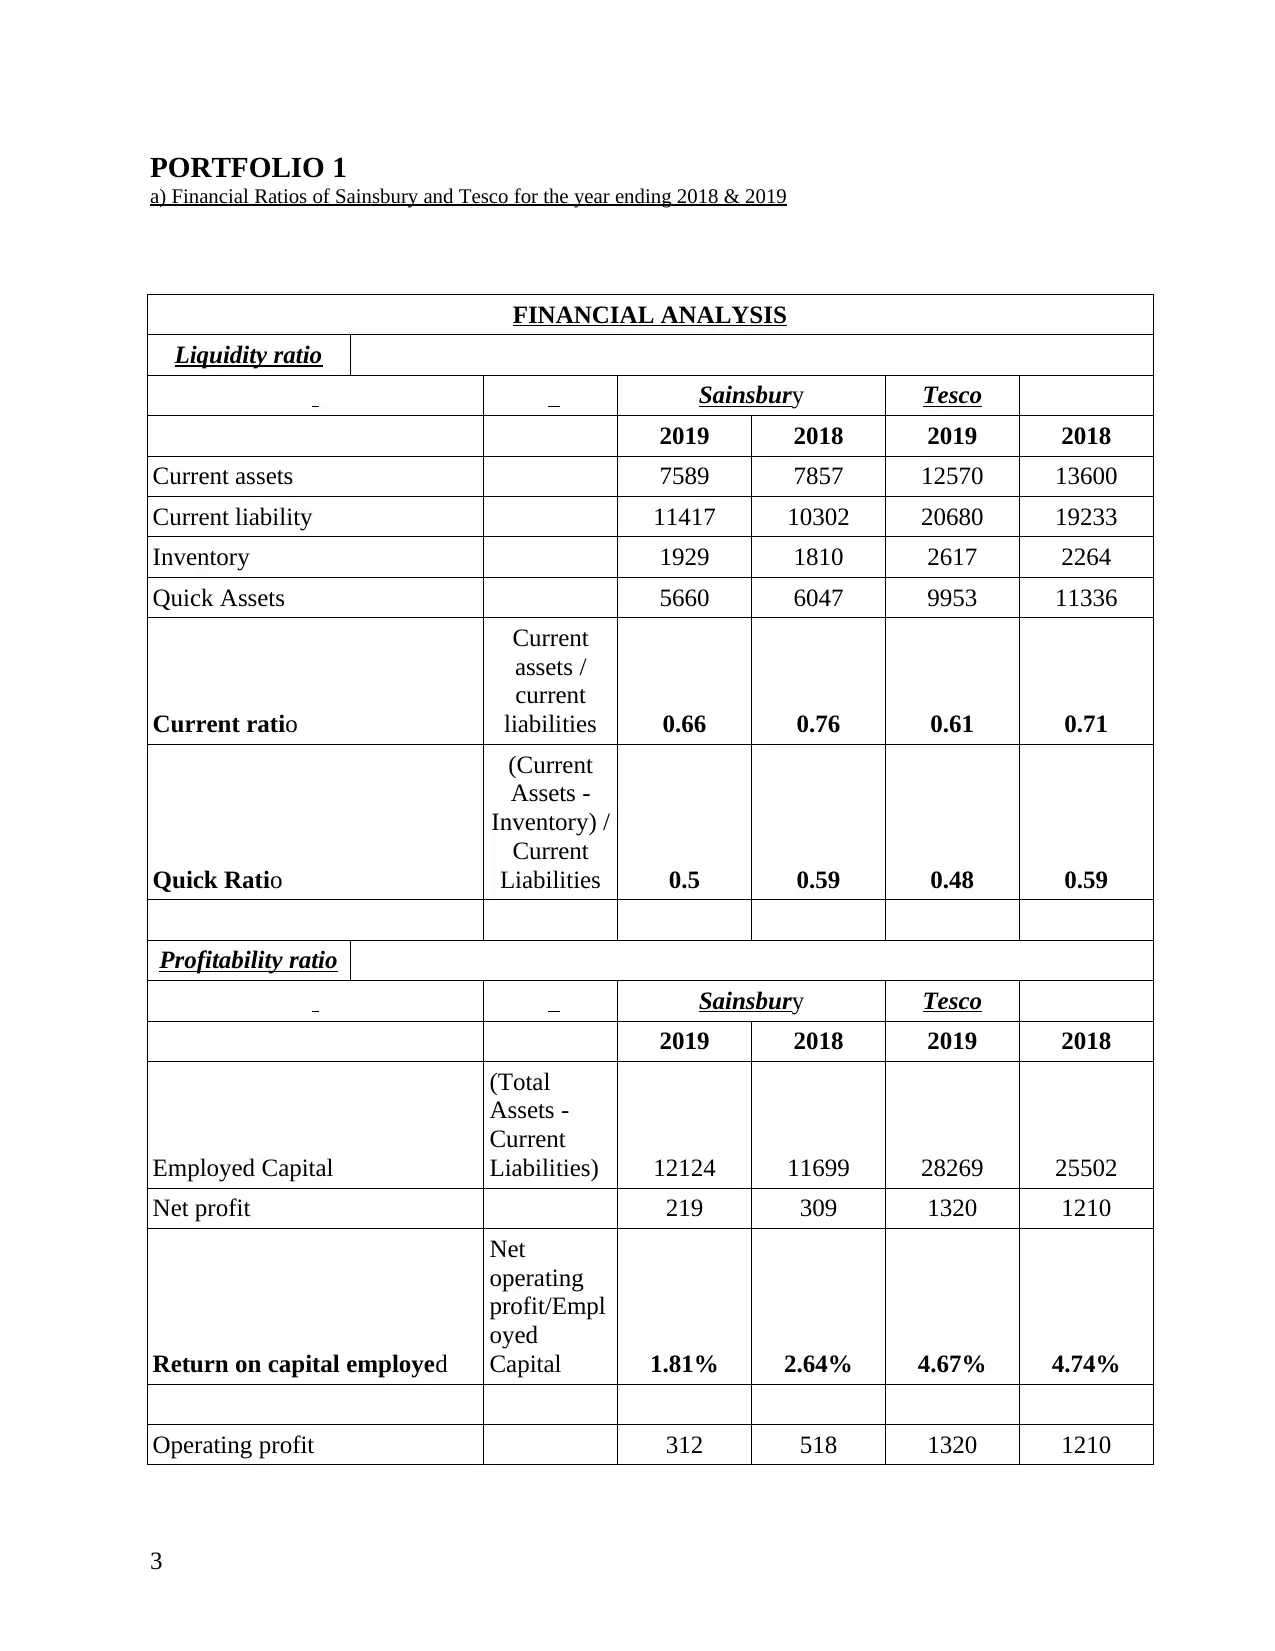
FINANCIAL ANALYSIS
Liquidity ratio
Sainsbury Tesco
2019 2018 2019 2018
Current assets 7589 7857 12570 13600
Current liability 11417 10302 20680 19233
Inventory 1929 1810 2617 2264
Quick Assets 5660 6047 9953 11336
Current ratio
Current
assets /
current
liabilities 0.66 0.76 0.61 0.71
Quick Ratio
(Current
Assets -
Inventory) /
Current
Liabilities 0.5 0.59 0.48 0.59
Profitability ratio
Sainsbury Tesco
2019 2018 2019 2018
Employed Capital
(Total
Assets -
Current
Liabilities) 12124 11699 28269 25502
Net profit 219 309 1320 1210
Return on capital employed
Net
operating
profit/Empl
oyed
Capital 1.81% 2.64% 4.67% 4.74%
Operating profit 312 518 1320 1210
3
a) Financial Ratios of Sainsbury and Tesco for the year ending 2018 & 2019
FINANCIAL ANALYSIS
Liquidity ratio
Sainsbury Tesco
2019 2018 2019 2018
Current assets 7589 7857 12570 13600
Current liability 11417 10302 20680 19233
Inventory 1929 1810 2617 2264
Quick Assets 5660 6047 9953 11336
Current ratio
Current
assets /
current
liabilities 0.66 0.76 0.61 0.71
Quick Ratio
(Current
Assets -
Inventory) /
Current
Liabilities 0.5 0.59 0.48 0.59
Profitability ratio
Sainsbury Tesco
2019 2018 2019 2018
Employed Capital
(Total
Assets -
Current
Liabilities) 12124 11699 28269 25502
Net profit 219 309 1320 1210
Return on capital employed
Net
operating
profit/Empl
oyed
Capital 1.81% 2.64% 4.67% 4.74%
Operating profit 312 518 1320 1210
3
⊘ This is a preview!⊘
Do you want full access?
Subscribe today to unlock all pages.
Trusted by 1+ million students worldwide
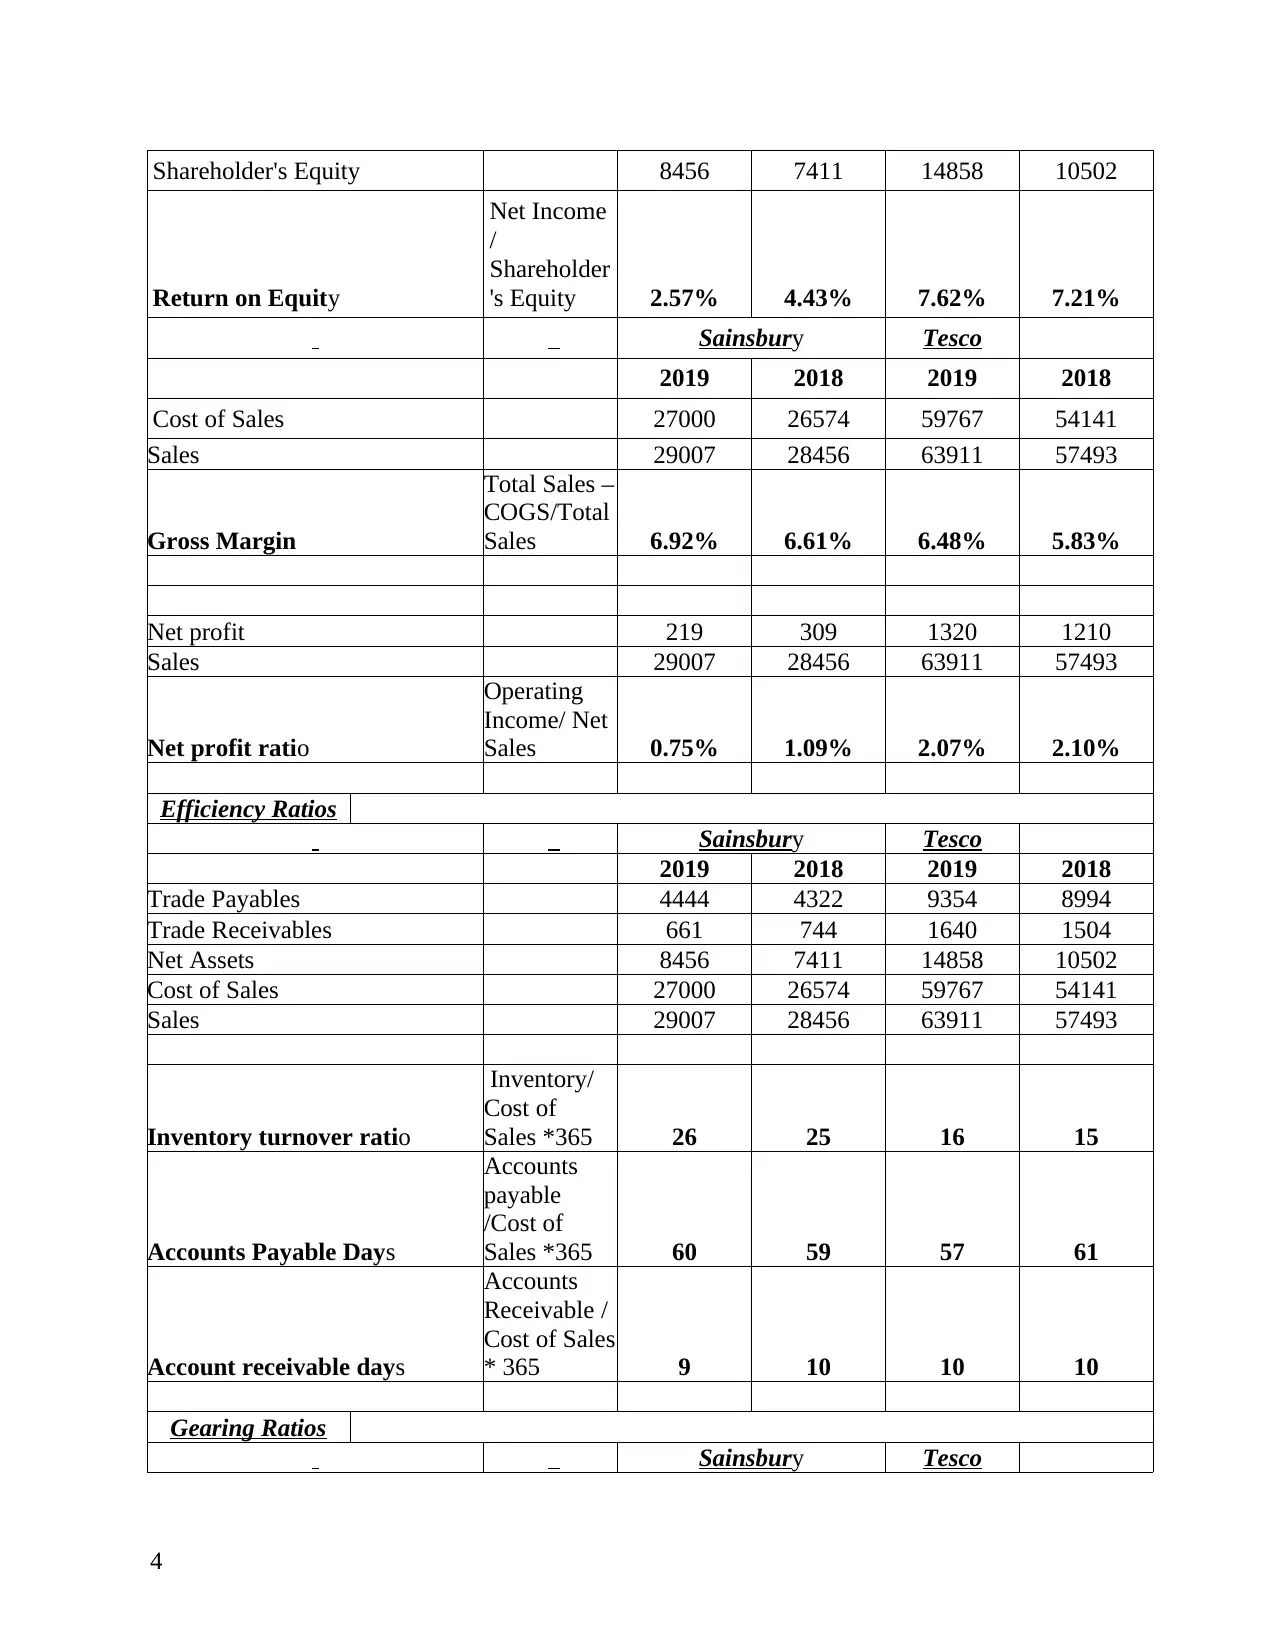
Shareholder's Equity 8456 7411 14858 10502
Return on Equity
Net Income
/
Shareholder
's Equity 2.57% 4.43% 7.62% 7.21%
Sainsbury Tesco
2019 2018 2019 2018
Cost of Sales 27000 26574 59767 54141
Sales 29007 28456 63911 57493
Gross Margin
Total Sales –
COGS/Total
Sales 6.92% 6.61% 6.48% 5.83%
Net profit 219 309 1320 1210
Sales 29007 28456 63911 57493
Net profit ratio
Operating
Income/ Net
Sales 0.75% 1.09% 2.07% 2.10%
Efficiency Ratios
Sainsbury Tesco
2019 2018 2019 2018
Trade Payables 4444 4322 9354 8994
Trade Receivables 661 744 1640 1504
Net Assets 8456 7411 14858 10502
Cost of Sales 27000 26574 59767 54141
Sales 29007 28456 63911 57493
Inventory turnover ratio
Inventory/
Cost of
Sales *365 26 25 16 15
Accounts Payable Days
Accounts
payable
/Cost of
Sales *365 60 59 57 61
Account receivable days
Accounts
Receivable /
Cost of Sales
* 365 9 10 10 10
Gearing Ratios
Sainsbury Tesco
4
Paraphrase This Document
Need a fresh take? Get an instant paraphrase of this document with our AI Paraphraser
2019 2018 2019 2018
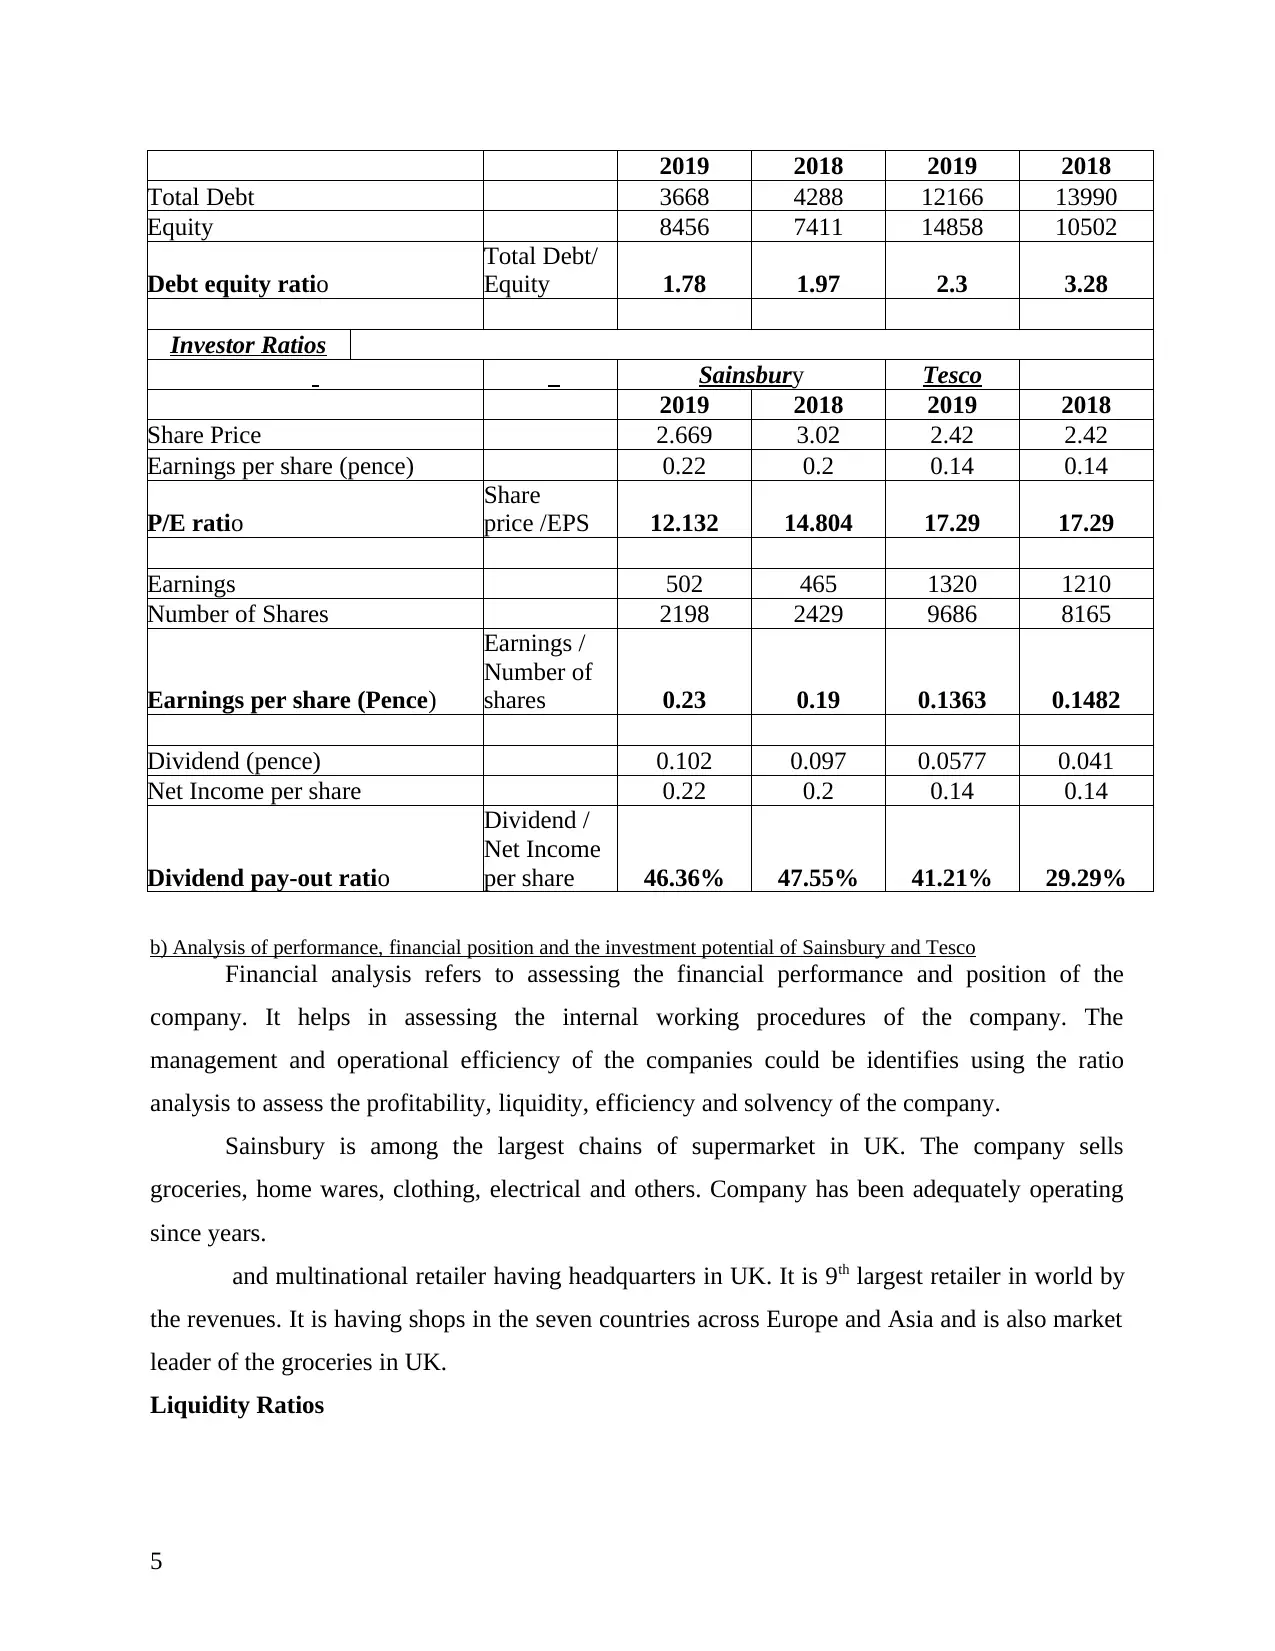
Total Debt 3668 4288 12166 13990
Equity 8456 7411 14858 10502
Debt equity ratio
Total Debt/
Equity 1.78 1.97 2.3 3.28
Investor Ratios
Sainsbury Tesco
2019 2018 2019 2018
Share Price 2.669 3.02 2.42 2.42
Earnings per share (pence) 0.22 0.2 0.14 0.14
P/E ratio
Share
price /EPS 12.132 14.804 17.29 17.29
Earnings 502 465 1320 1210
Number of Shares 2198 2429 9686 8165
Earnings per share (Pence)
Earnings /
Number of
shares 0.23 0.19 0.1363 0.1482
Dividend (pence) 0.102 0.097 0.0577 0.041
Net Income per share 0.22 0.2 0.14 0.14
Dividend pay-out ratio
Dividend /
Net Income
per share 46.36% 47.55% 41.21% 29.29%
b) Analysis of performance, financial position and the investment potential of Sainsbury and Tesco
Financial analysis refers to assessing the financial performance and position of the
company. It helps in assessing the internal working procedures of the company. The
management and operational efficiency of the companies could be identifies using the ratio
analysis to assess the profitability, liquidity, efficiency and solvency of the company.
Sainsbury is among the largest chains of supermarket in UK. The company sells
groceries, home wares, clothing, electrical and others. Company has been adequately operating
since years.
and multinational retailer having headquarters in UK. It is 9th largest retailer in world by
the revenues. It is having shops in the seven countries across Europe and Asia and is also market
leader of the groceries in UK.
Liquidity Ratios
5
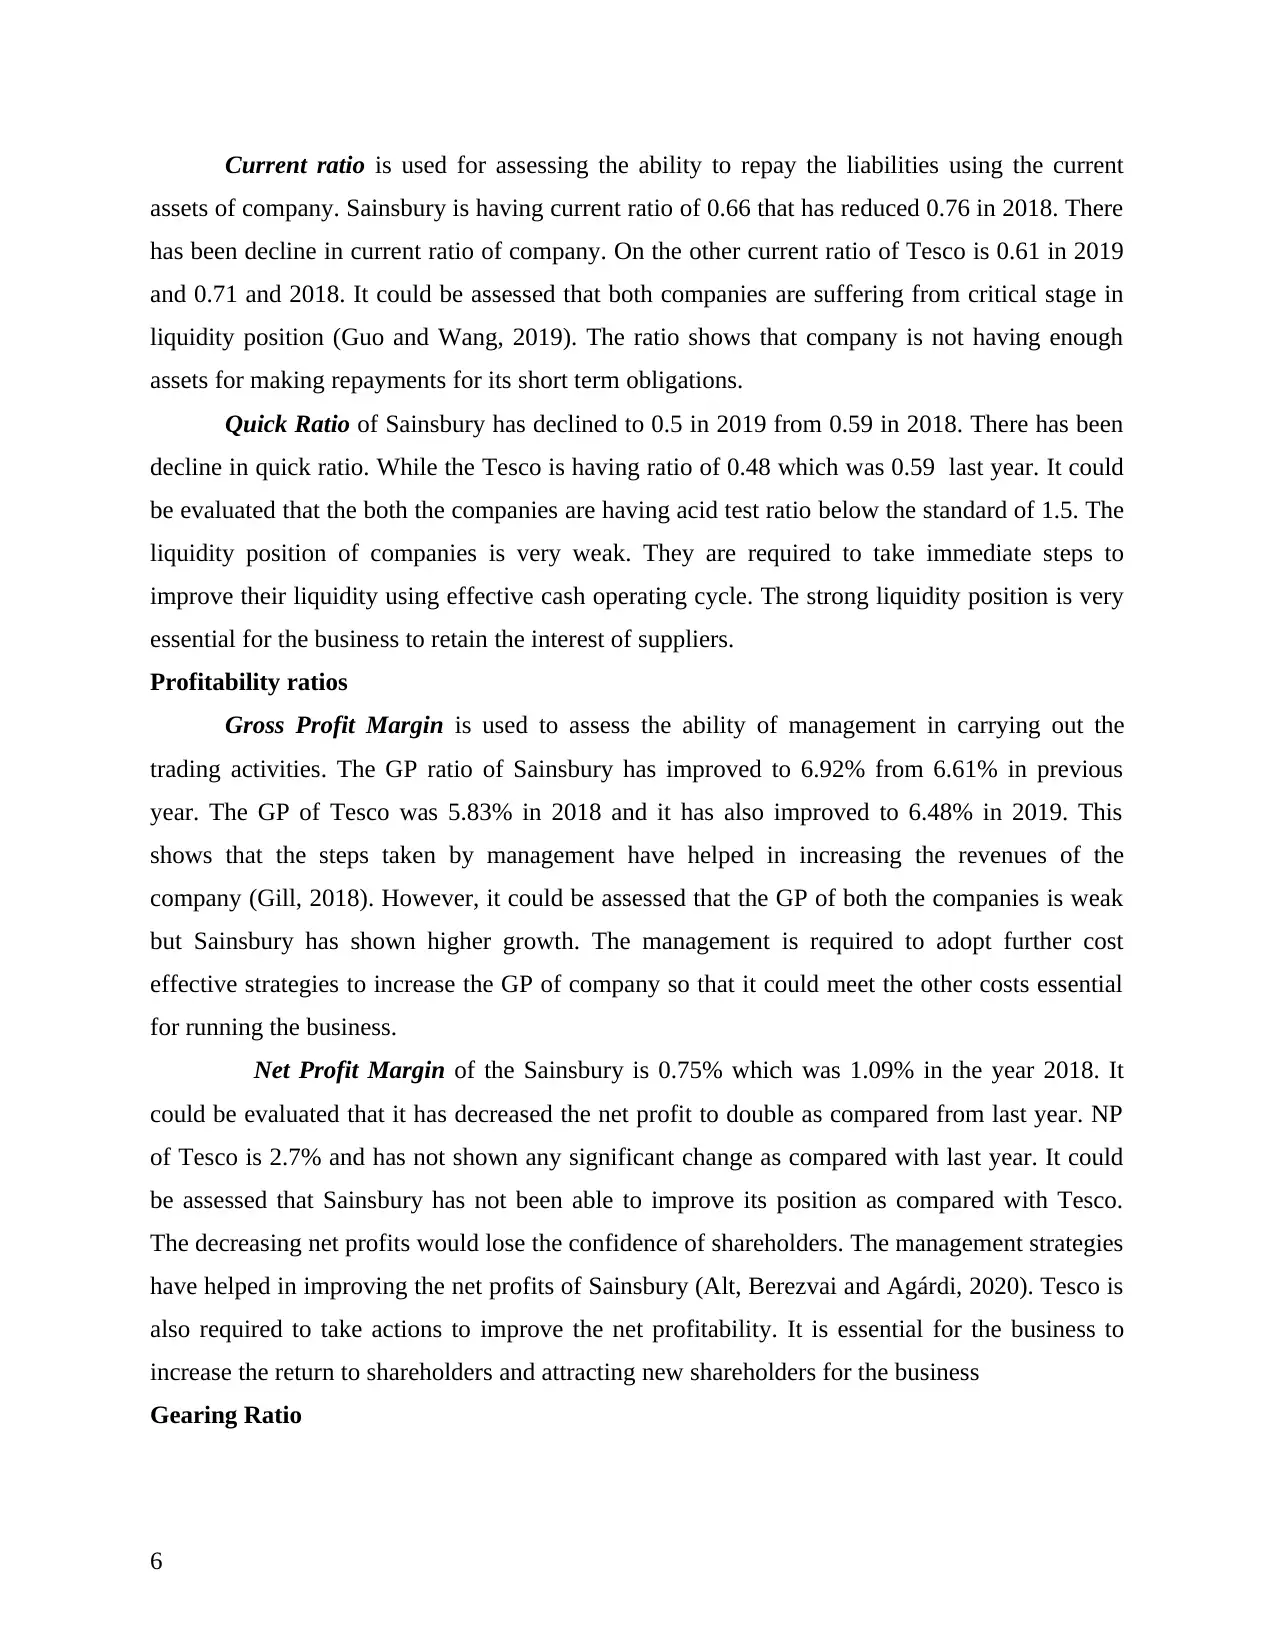
Current ratio is used for assessing the ability to repay the liabilities using the current
assets of company. Sainsbury is having current ratio of 0.66 that has reduced 0.76 in 2018. There
has been decline in current ratio of company. On the other current ratio of Tesco is 0.61 in 2019
and 0.71 and 2018. It could be assessed that both companies are suffering from critical stage in
liquidity position (Guo and Wang, 2019). The ratio shows that company is not having enough
assets for making repayments for its short term obligations.
Quick Ratio of Sainsbury has declined to 0.5 in 2019 from 0.59 in 2018. There has been
decline in quick ratio. While the Tesco is having ratio of 0.48 which was 0.59 last year. It could
be evaluated that the both the companies are having acid test ratio below the standard of 1.5. The
liquidity position of companies is very weak. They are required to take immediate steps to
improve their liquidity using effective cash operating cycle. The strong liquidity position is very
essential for the business to retain the interest of suppliers.
Profitability ratios
Gross Profit Margin is used to assess the ability of management in carrying out the
trading activities. The GP ratio of Sainsbury has improved to 6.92% from 6.61% in previous
year. The GP of Tesco was 5.83% in 2018 and it has also improved to 6.48% in 2019. This
shows that the steps taken by management have helped in increasing the revenues of the
company (Gill, 2018). However, it could be assessed that the GP of both the companies is weak
but Sainsbury has shown higher growth. The management is required to adopt further cost
effective strategies to increase the GP of company so that it could meet the other costs essential
for running the business.
Net Profit Margin of the Sainsbury is 0.75% which was 1.09% in the year 2018. It
could be evaluated that it has decreased the net profit to double as compared from last year. NP
of Tesco is 2.7% and has not shown any significant change as compared with last year. It could
be assessed that Sainsbury has not been able to improve its position as compared with Tesco.
The decreasing net profits would lose the confidence of shareholders. The management strategies
have helped in improving the net profits of Sainsbury (Alt, Berezvai and Agárdi, 2020). Tesco is
also required to take actions to improve the net profitability. It is essential for the business to
increase the return to shareholders and attracting new shareholders for the business
Gearing Ratio
6
⊘ This is a preview!⊘
Do you want full access?
Subscribe today to unlock all pages.
Trusted by 1+ million students worldwide
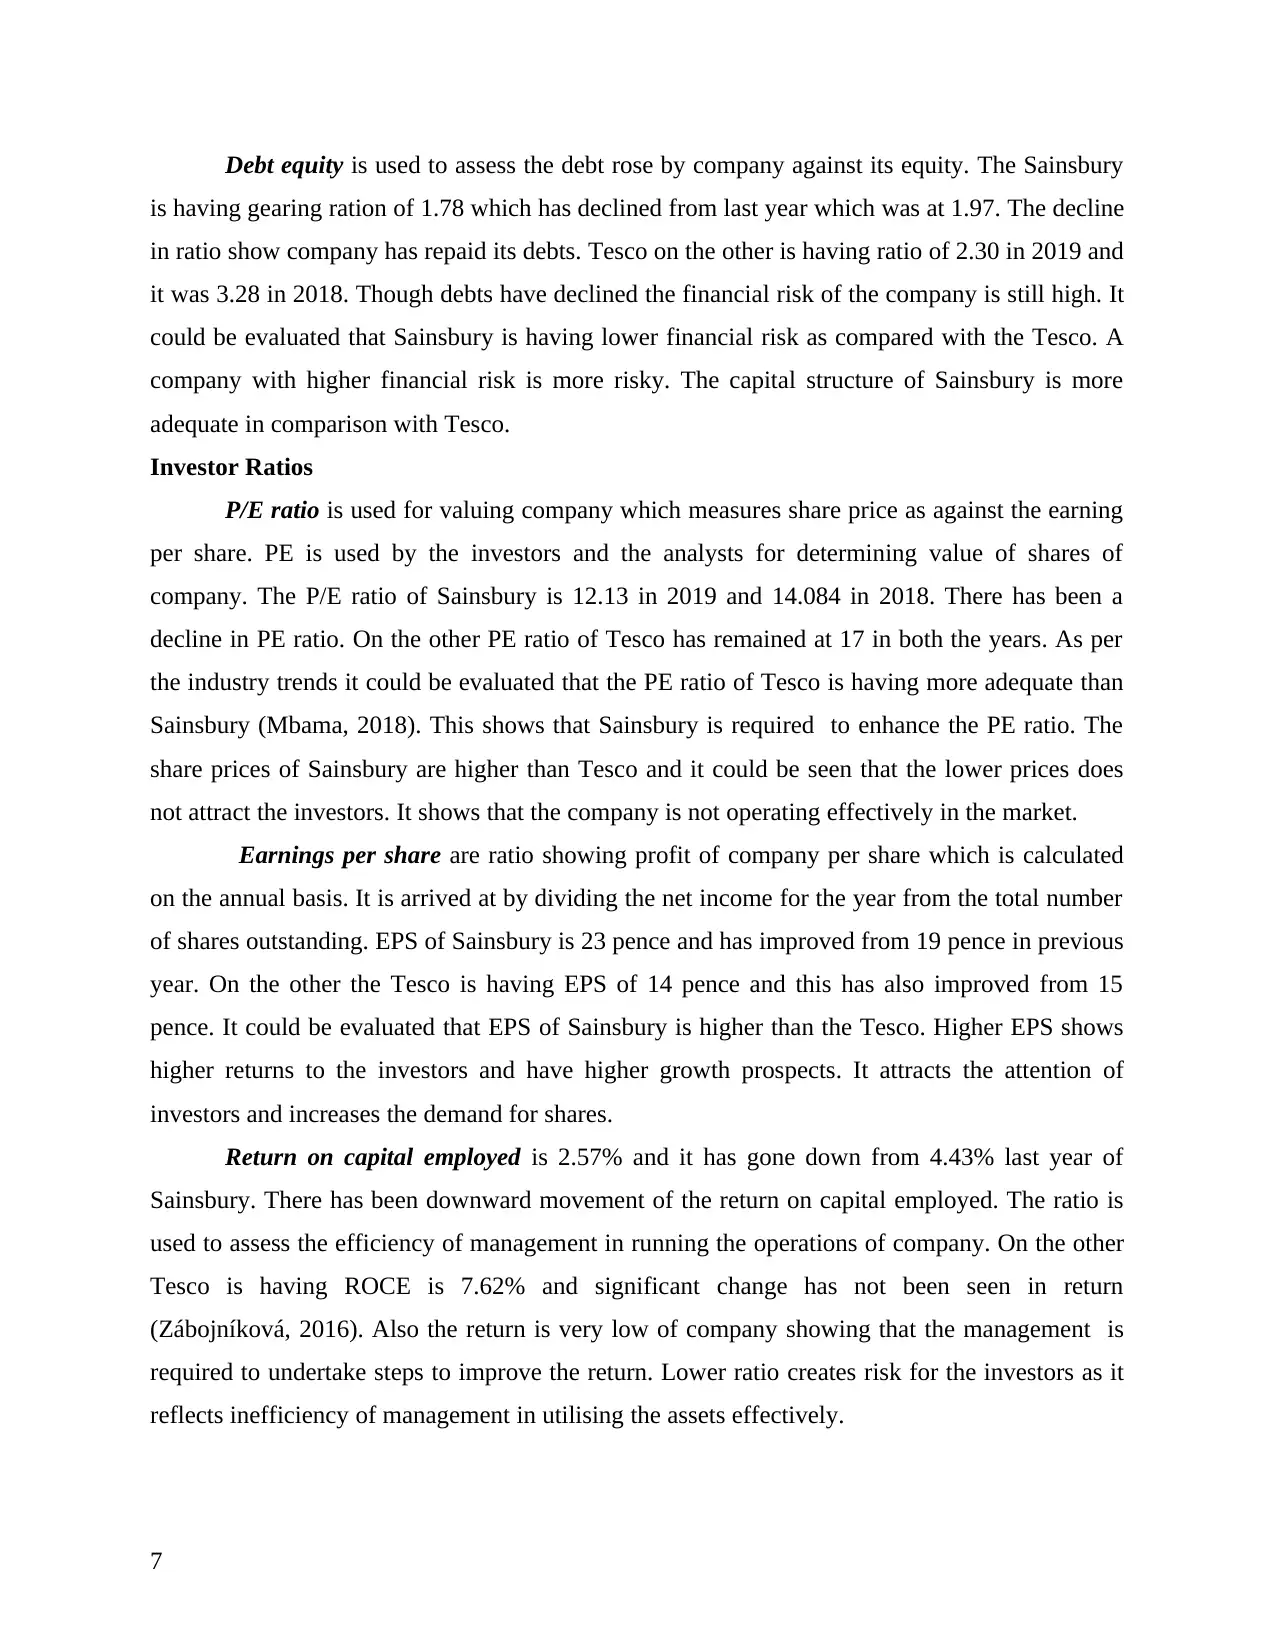
Debt equity is used to assess the debt rose by company against its equity. The Sainsbury
is having gearing ration of 1.78 which has declined from last year which was at 1.97. The decline
in ratio show company has repaid its debts. Tesco on the other is having ratio of 2.30 in 2019 and
it was 3.28 in 2018. Though debts have declined the financial risk of the company is still high. It
could be evaluated that Sainsbury is having lower financial risk as compared with the Tesco. A
company with higher financial risk is more risky. The capital structure of Sainsbury is more
adequate in comparison with Tesco.
Investor Ratios
P/E ratio is used for valuing company which measures share price as against the earning
per share. PE is used by the investors and the analysts for determining value of shares of
company. The P/E ratio of Sainsbury is 12.13 in 2019 and 14.084 in 2018. There has been a
decline in PE ratio. On the other PE ratio of Tesco has remained at 17 in both the years. As per
the industry trends it could be evaluated that the PE ratio of Tesco is having more adequate than
Sainsbury (Mbama, 2018). This shows that Sainsbury is required to enhance the PE ratio. The
share prices of Sainsbury are higher than Tesco and it could be seen that the lower prices does
not attract the investors. It shows that the company is not operating effectively in the market.
Earnings per share are ratio showing profit of company per share which is calculated
on the annual basis. It is arrived at by dividing the net income for the year from the total number
of shares outstanding. EPS of Sainsbury is 23 pence and has improved from 19 pence in previous
year. On the other the Tesco is having EPS of 14 pence and this has also improved from 15
pence. It could be evaluated that EPS of Sainsbury is higher than the Tesco. Higher EPS shows
higher returns to the investors and have higher growth prospects. It attracts the attention of
investors and increases the demand for shares.
Return on capital employed is 2.57% and it has gone down from 4.43% last year of
Sainsbury. There has been downward movement of the return on capital employed. The ratio is
used to assess the efficiency of management in running the operations of company. On the other
Tesco is having ROCE is 7.62% and significant change has not been seen in return
(Zábojníková, 2016). Also the return is very low of company showing that the management is
required to undertake steps to improve the return. Lower ratio creates risk for the investors as it
reflects inefficiency of management in utilising the assets effectively.
7
Paraphrase This Document
Need a fresh take? Get an instant paraphrase of this document with our AI Paraphraser
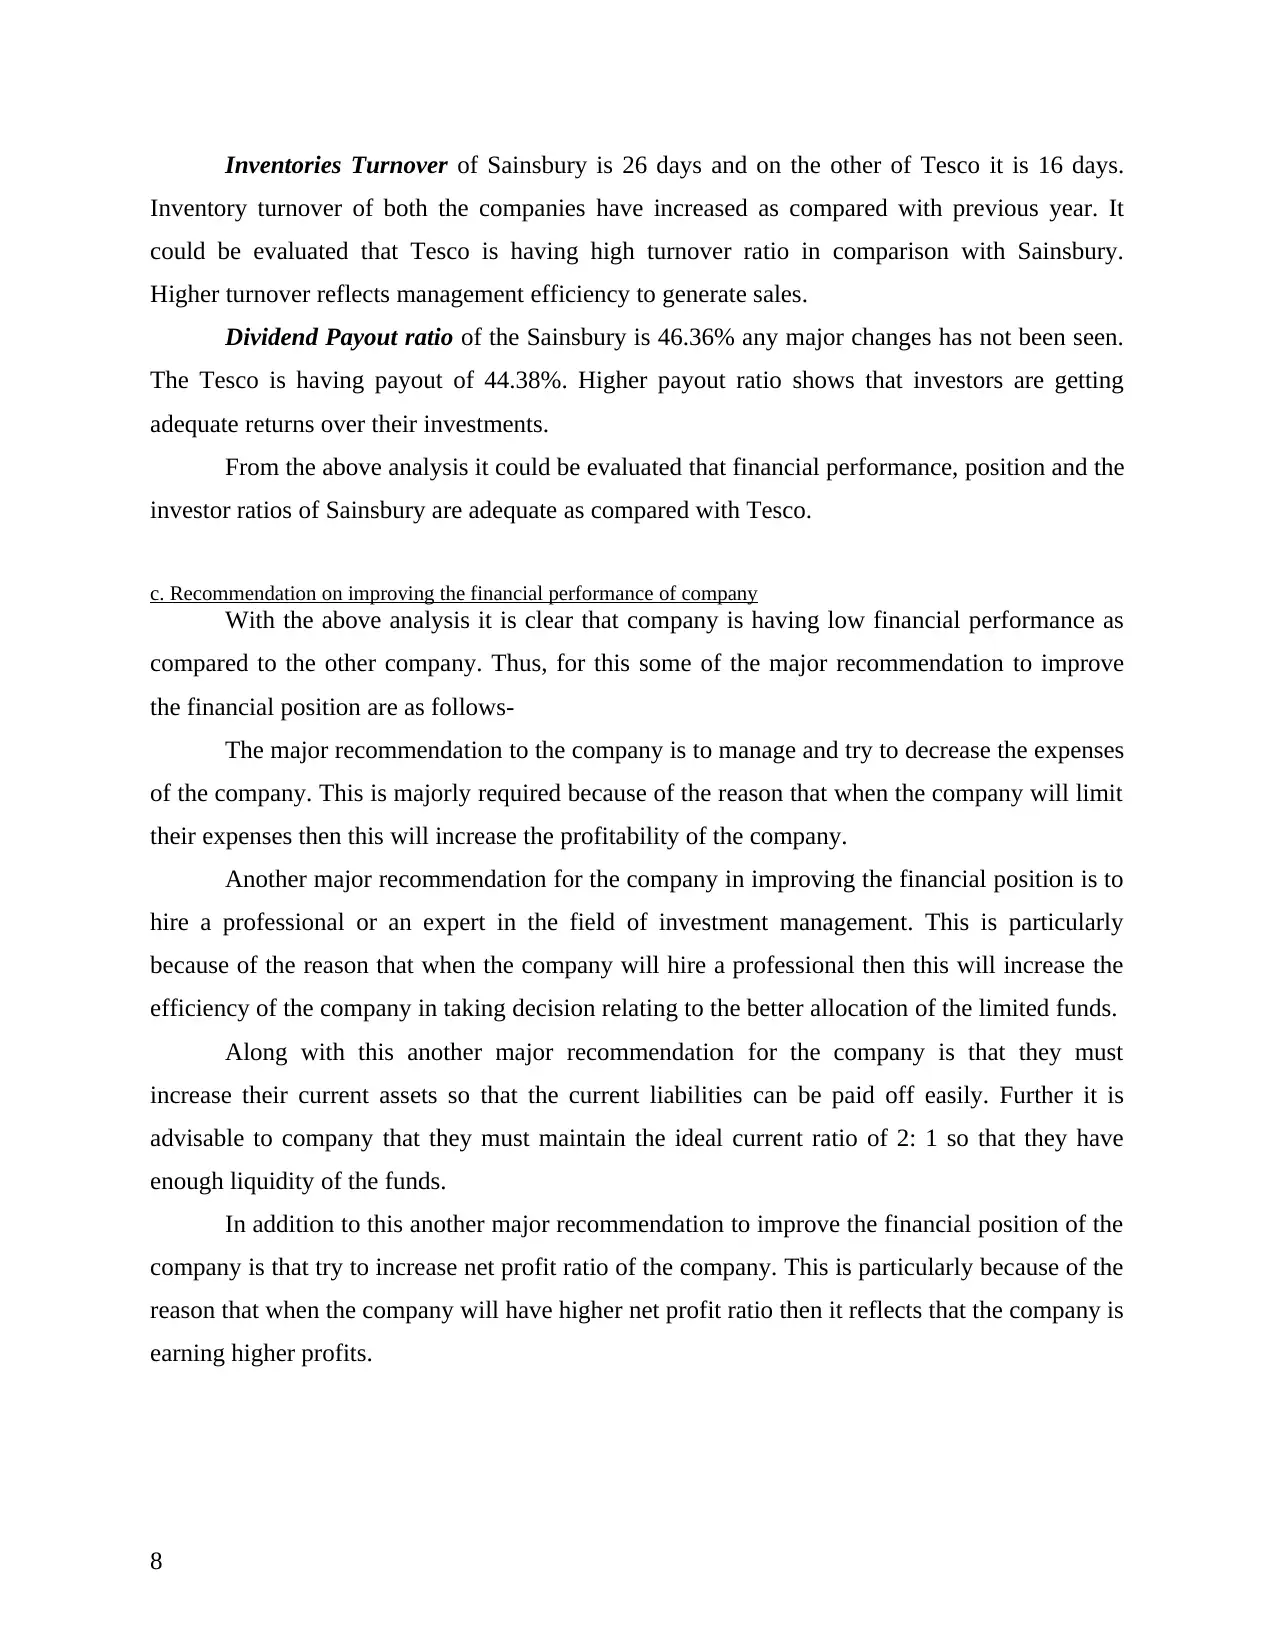
Inventories Turnover of Sainsbury is 26 days and on the other of Tesco it is 16 days.
Inventory turnover of both the companies have increased as compared with previous year. It
could be evaluated that Tesco is having high turnover ratio in comparison with Sainsbury.
Higher turnover reflects management efficiency to generate sales.
Dividend Payout ratio of the Sainsbury is 46.36% any major changes has not been seen.
The Tesco is having payout of 44.38%. Higher payout ratio shows that investors are getting
adequate returns over their investments.
From the above analysis it could be evaluated that financial performance, position and the
investor ratios of Sainsbury are adequate as compared with Tesco.
c. Recommendation on improving the financial performance of company
With the above analysis it is clear that company is having low financial performance as
compared to the other company. Thus, for this some of the major recommendation to improve
the financial position are as follows-
The major recommendation to the company is to manage and try to decrease the expenses
of the company. This is majorly required because of the reason that when the company will limit
their expenses then this will increase the profitability of the company.
Another major recommendation for the company in improving the financial position is to
hire a professional or an expert in the field of investment management. This is particularly
because of the reason that when the company will hire a professional then this will increase the
efficiency of the company in taking decision relating to the better allocation of the limited funds.
Along with this another major recommendation for the company is that they must
increase their current assets so that the current liabilities can be paid off easily. Further it is
advisable to company that they must maintain the ideal current ratio of 2: 1 so that they have
enough liquidity of the funds.
In addition to this another major recommendation to improve the financial position of the
company is that try to increase net profit ratio of the company. This is particularly because of the
reason that when the company will have higher net profit ratio then it reflects that the company is
earning higher profits.
8
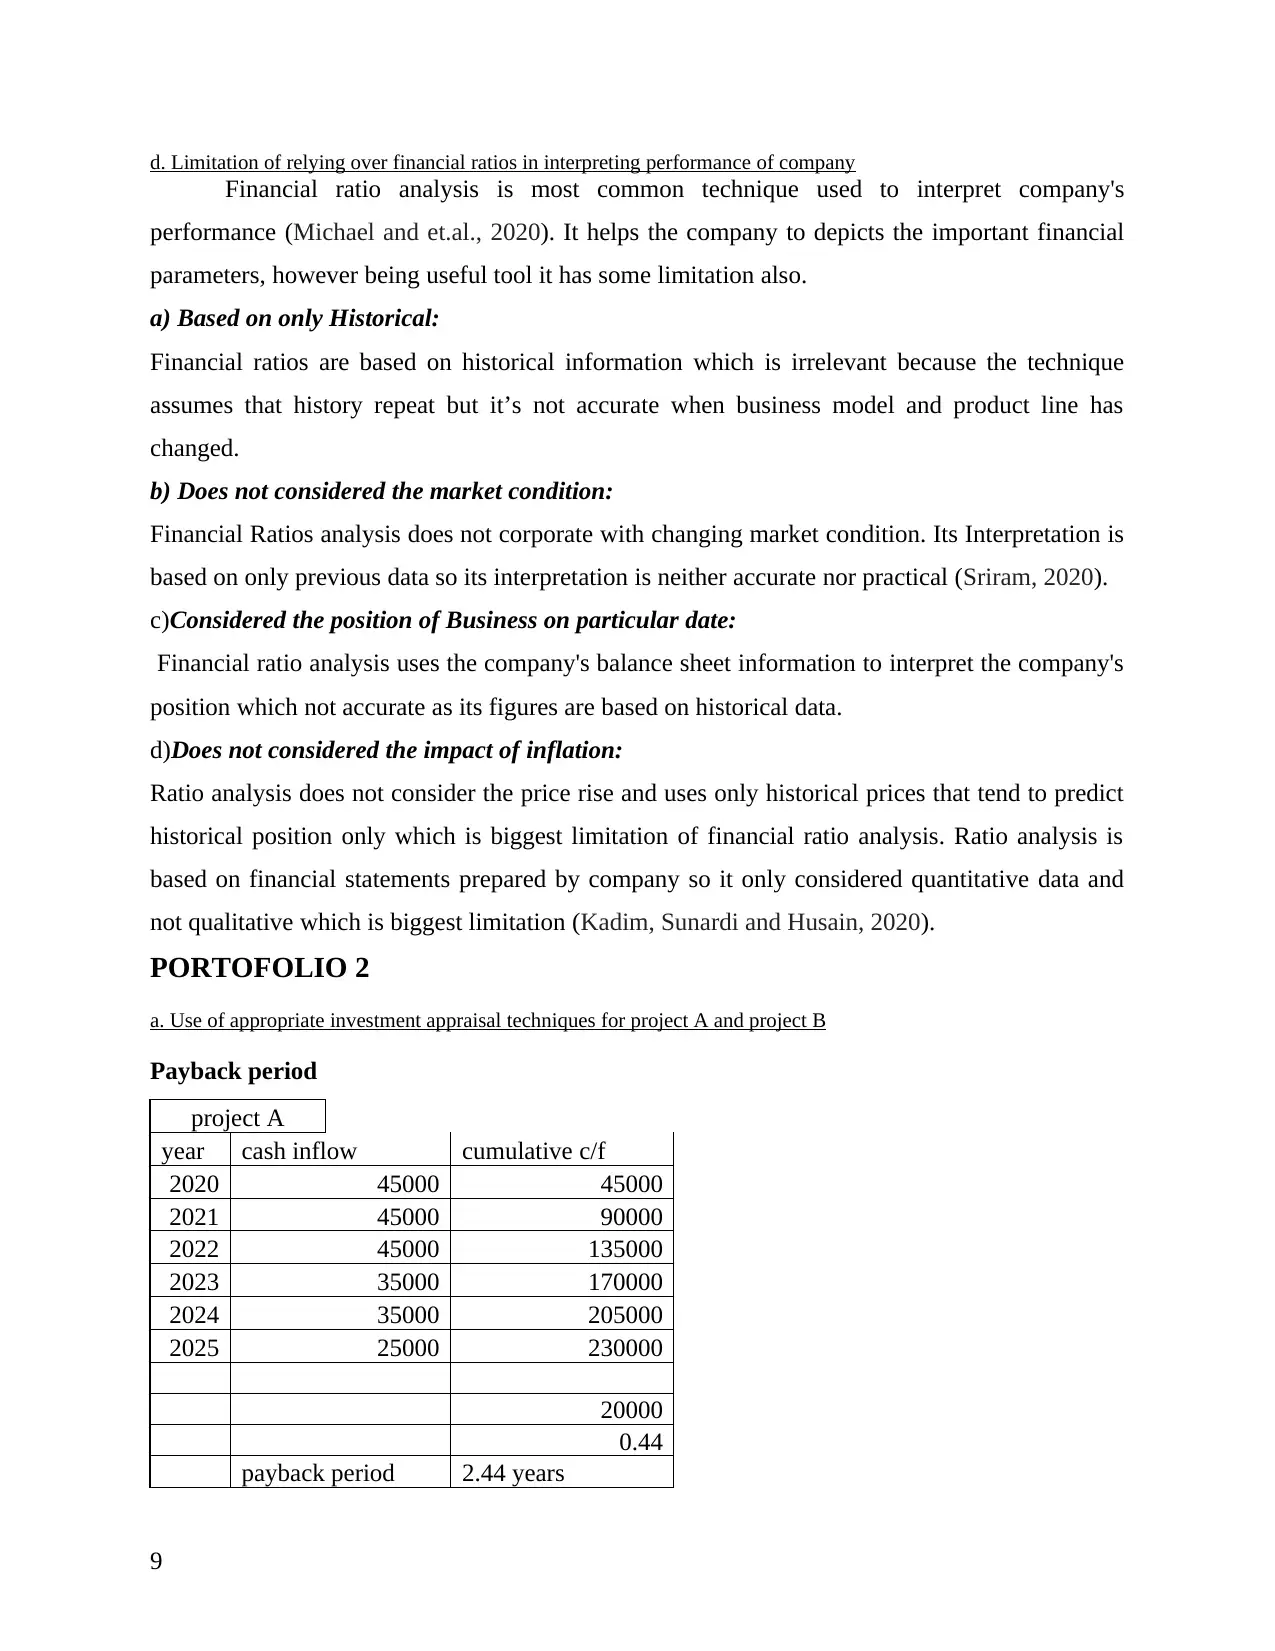
d. Limitation of relying over financial ratios in interpreting performance of company
Financial ratio analysis is most common technique used to interpret company's
performance (Michael and et.al., 2020). It helps the company to depicts the important financial
parameters, however being useful tool it has some limitation also.
a) Based on only Historical:
Financial ratios are based on historical information which is irrelevant because the technique
assumes that history repeat but it’s not accurate when business model and product line has
changed.
b) Does not considered the market condition:
Financial Ratios analysis does not corporate with changing market condition. Its Interpretation is
based on only previous data so its interpretation is neither accurate nor practical (Sriram, 2020).
c)Considered the position of Business on particular date:
Financial ratio analysis uses the company's balance sheet information to interpret the company's
position which not accurate as its figures are based on historical data.
d)Does not considered the impact of inflation:
Ratio analysis does not consider the price rise and uses only historical prices that tend to predict
historical position only which is biggest limitation of financial ratio analysis. Ratio analysis is
based on financial statements prepared by company so it only considered quantitative data and
not qualitative which is biggest limitation (Kadim, Sunardi and Husain, 2020).
PORTOFOLIO 2
a. Use of appropriate investment appraisal techniques for project A and project B
Payback period
project A
year cash inflow cumulative c/f
2020 45000 45000
2021 45000 90000
2022 45000 135000
2023 35000 170000
2024 35000 205000
2025 25000 230000
20000
0.44
payback period 2.44 years
9
⊘ This is a preview!⊘
Do you want full access?
Subscribe today to unlock all pages.
Trusted by 1+ million students worldwide
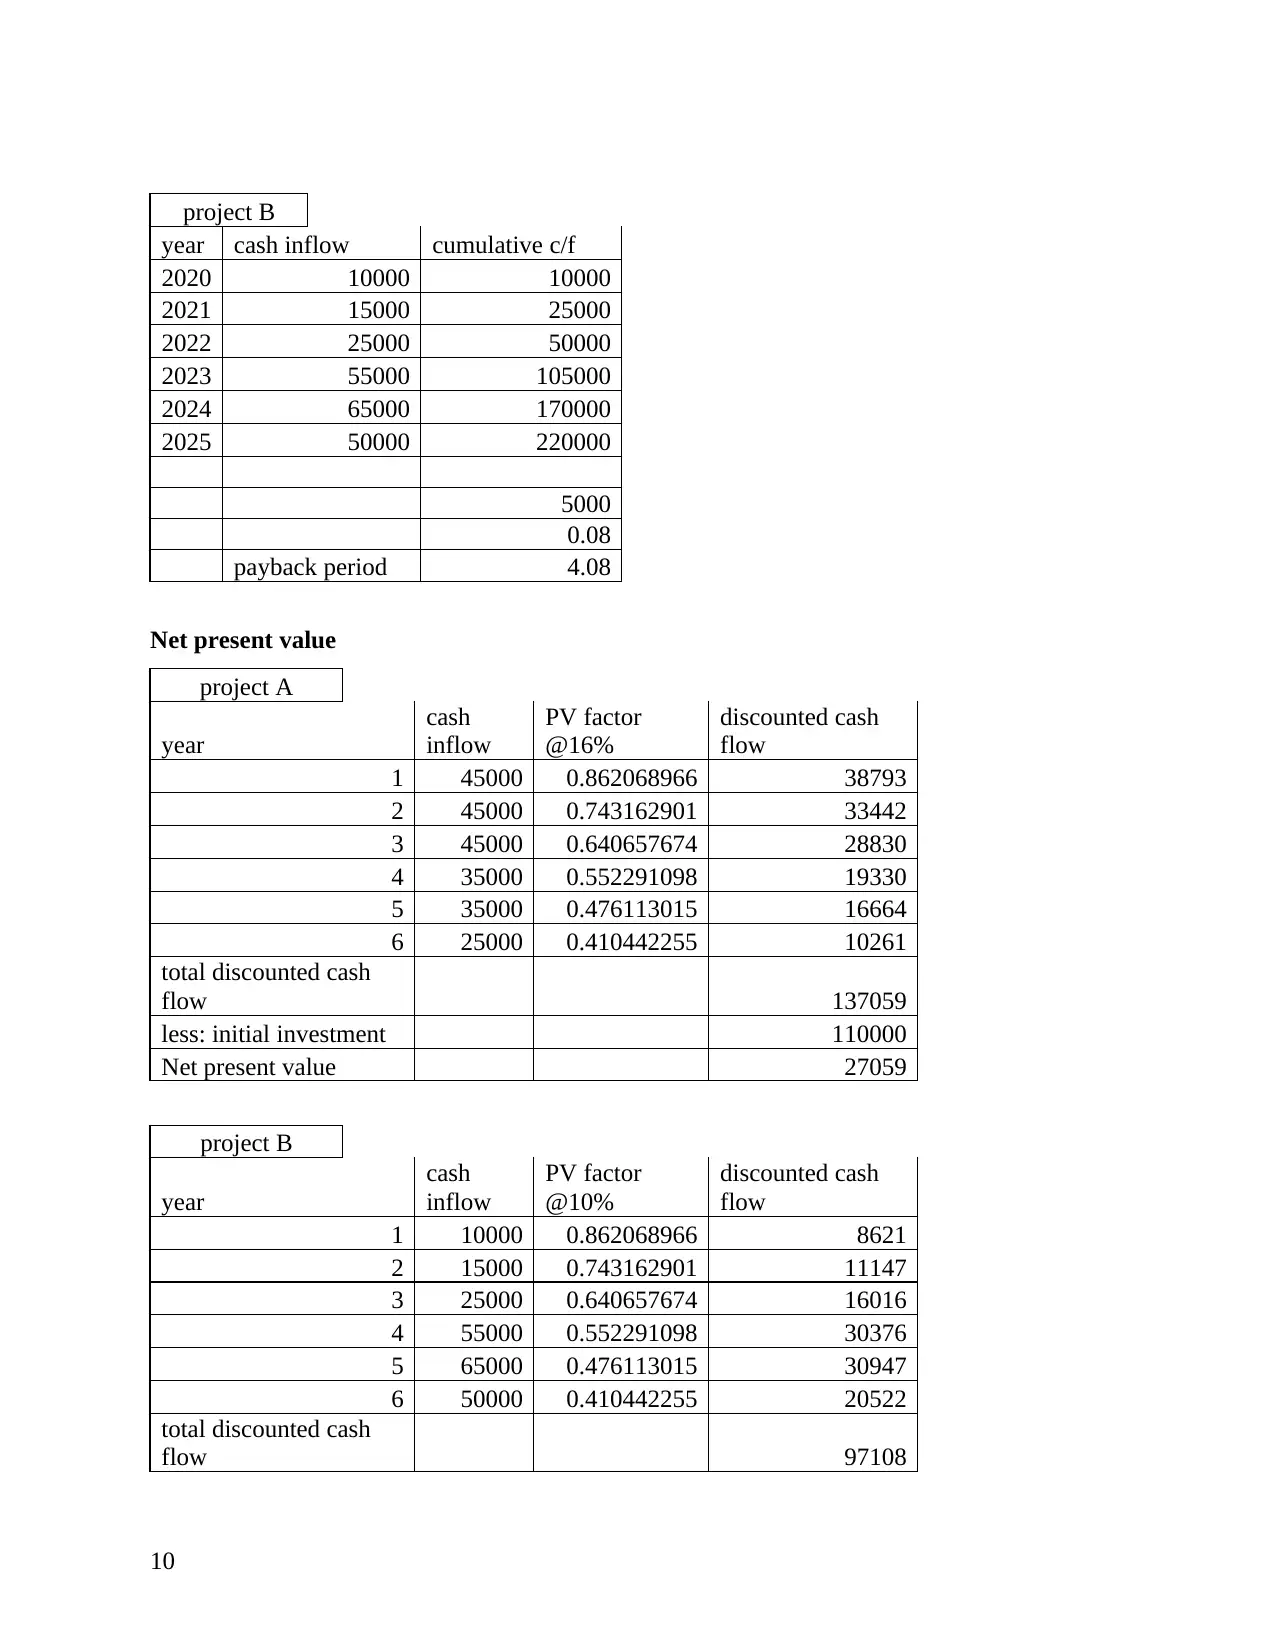
project B
year cash inflow cumulative c/f
2020 10000 10000
2021 15000 25000
2022 25000 50000
2023 55000 105000
2024 65000 170000
2025 50000 220000
5000
0.08
payback period 4.08
Net present value
project A
year
cash
inflow
PV factor
@16%
discounted cash
flow
1 45000 0.862068966 38793
2 45000 0.743162901 33442
3 45000 0.640657674 28830
4 35000 0.552291098 19330
5 35000 0.476113015 16664
6 25000 0.410442255 10261
total discounted cash
flow 137059
less: initial investment 110000
Net present value 27059
project B
year
cash
inflow
PV factor
@10%
discounted cash
flow
1 10000 0.862068966 8621
2 15000 0.743162901 11147
3 25000 0.640657674 16016
4 55000 0.552291098 30376
5 65000 0.476113015 30947
6 50000 0.410442255 20522
total discounted cash
flow 97108
10
Paraphrase This Document
Need a fresh take? Get an instant paraphrase of this document with our AI Paraphraser
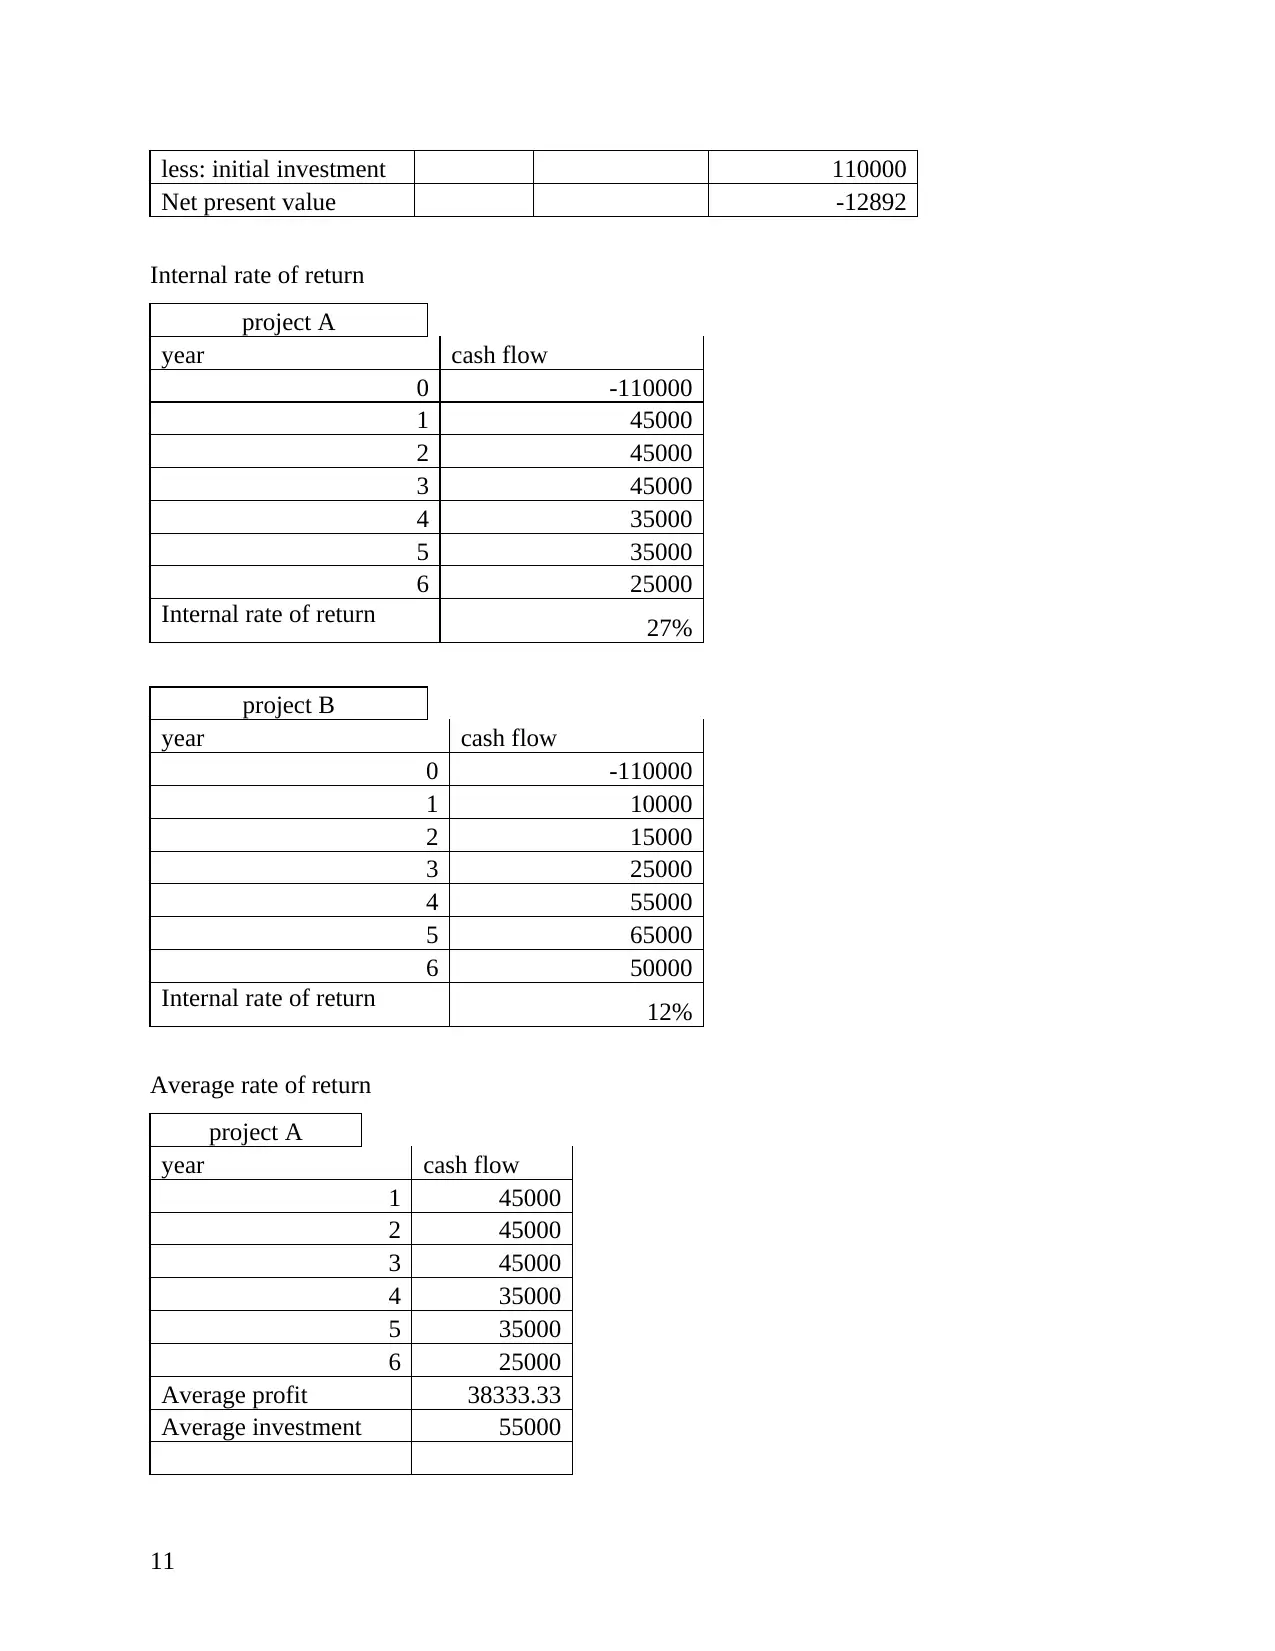
less: initial investment 110000
Net present value -12892
Internal rate of return
project A
year cash flow
0 -110000
1 45000
2 45000
3 45000
4 35000
5 35000
6 25000
Internal rate of return 27%
project B
year cash flow
0 -110000
1 10000
2 15000
3 25000
4 55000
5 65000
6 50000
Internal rate of return 12%
Average rate of return
project A
year cash flow
1 45000
2 45000
3 45000
4 35000
5 35000
6 25000
Average profit 38333.33
Average investment 55000
11
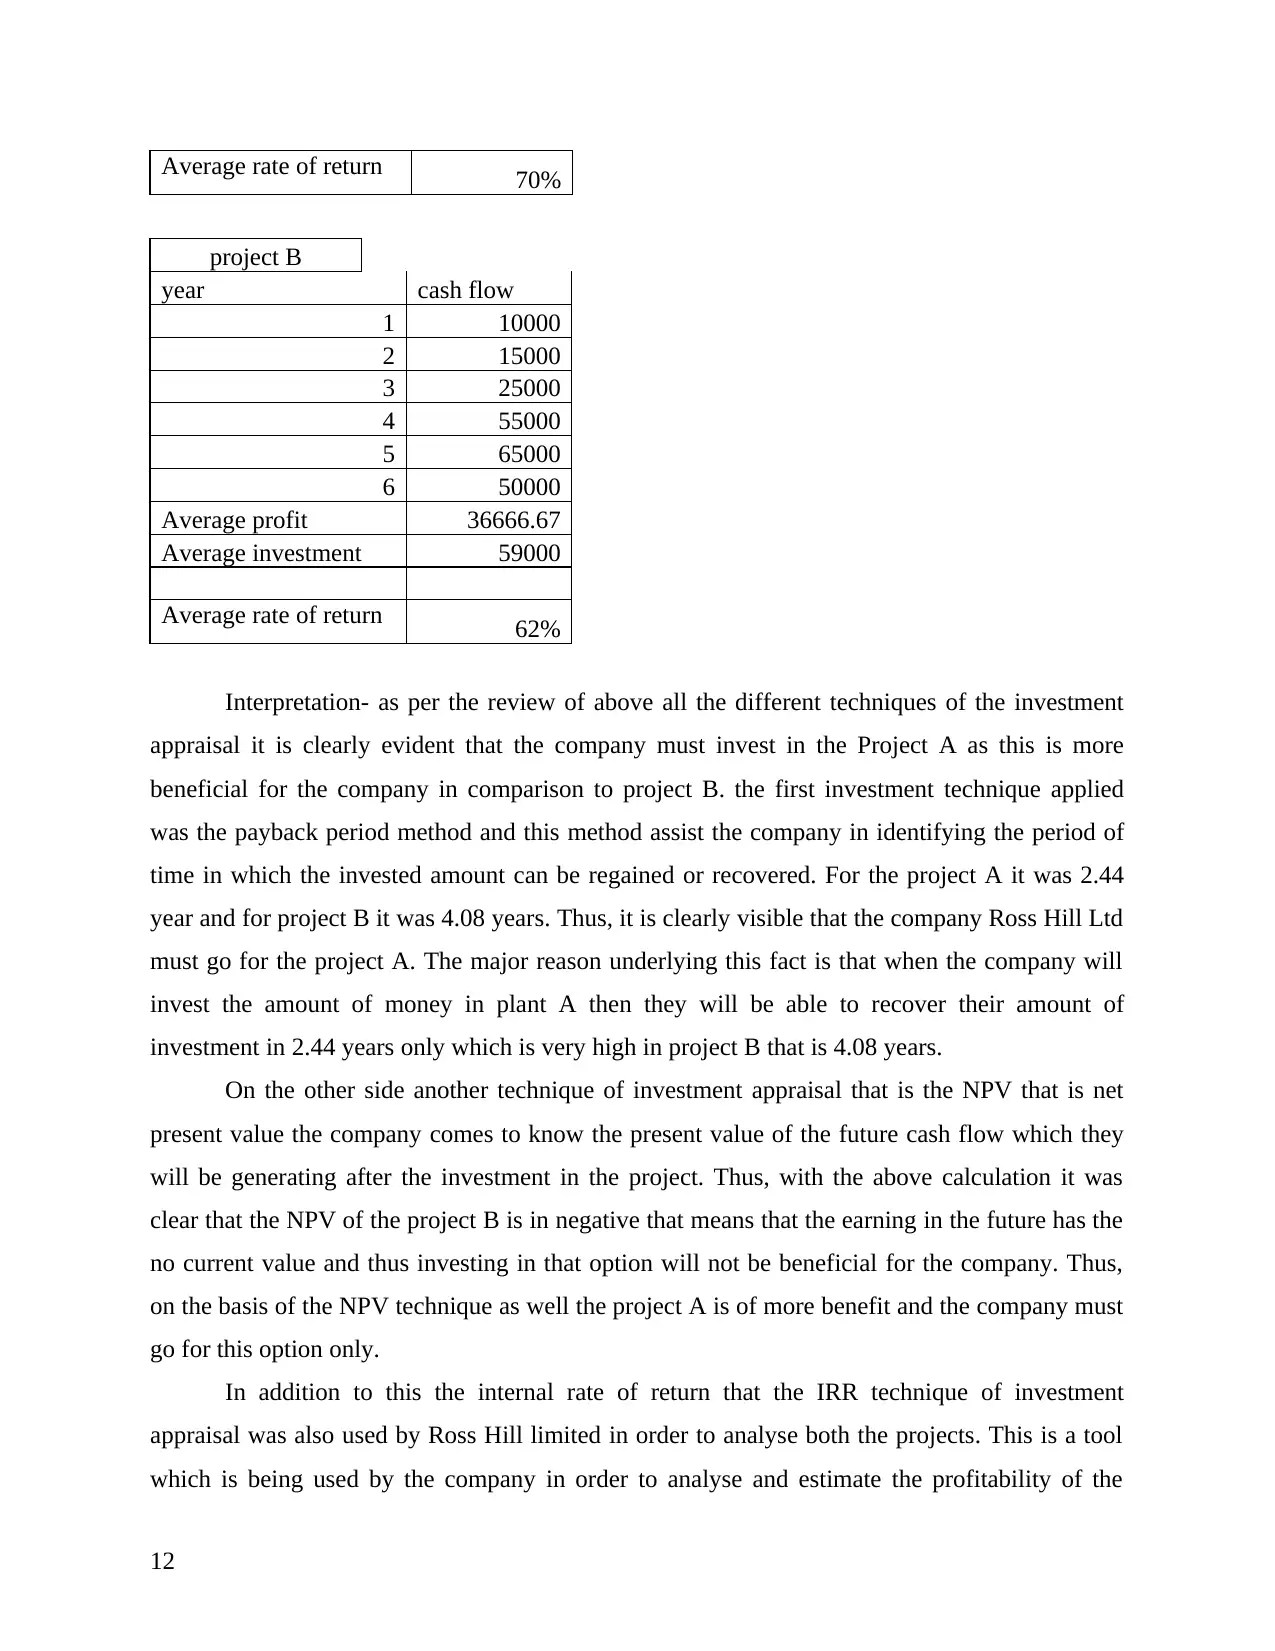
Average rate of return 70%
project B
year cash flow
1 10000
2 15000
3 25000
4 55000
5 65000
6 50000
Average profit 36666.67
Average investment 59000
Average rate of return 62%
Interpretation- as per the review of above all the different techniques of the investment
appraisal it is clearly evident that the company must invest in the Project A as this is more
beneficial for the company in comparison to project B. the first investment technique applied
was the payback period method and this method assist the company in identifying the period of
time in which the invested amount can be regained or recovered. For the project A it was 2.44
year and for project B it was 4.08 years. Thus, it is clearly visible that the company Ross Hill Ltd
must go for the project A. The major reason underlying this fact is that when the company will
invest the amount of money in plant A then they will be able to recover their amount of
investment in 2.44 years only which is very high in project B that is 4.08 years.
On the other side another technique of investment appraisal that is the NPV that is net
present value the company comes to know the present value of the future cash flow which they
will be generating after the investment in the project. Thus, with the above calculation it was
clear that the NPV of the project B is in negative that means that the earning in the future has the
no current value and thus investing in that option will not be beneficial for the company. Thus,
on the basis of the NPV technique as well the project A is of more benefit and the company must
go for this option only.
In addition to this the internal rate of return that the IRR technique of investment
appraisal was also used by Ross Hill limited in order to analyse both the projects. This is a tool
which is being used by the company in order to analyse and estimate the profitability of the
12
⊘ This is a preview!⊘
Do you want full access?
Subscribe today to unlock all pages.
Trusted by 1+ million students worldwide
1 out of 14
Related Documents


Your All-in-One AI-Powered Toolkit for Academic Success.
+13062052269
info@desklib.com
Available 24*7 on WhatsApp / Email
![[object Object]](/_next/static/media/star-bottom.7253800d.svg)
Unlock your academic potential
Copyright © 2020–2026 A2Z Services. All Rights Reserved. Developed and managed by ZUCOL.