Financial Analysis Report: Sainsbury and Tesco for Market Share

Verified

Added on  2021/02/20

|32
|5554
|53
Report
AI Summary
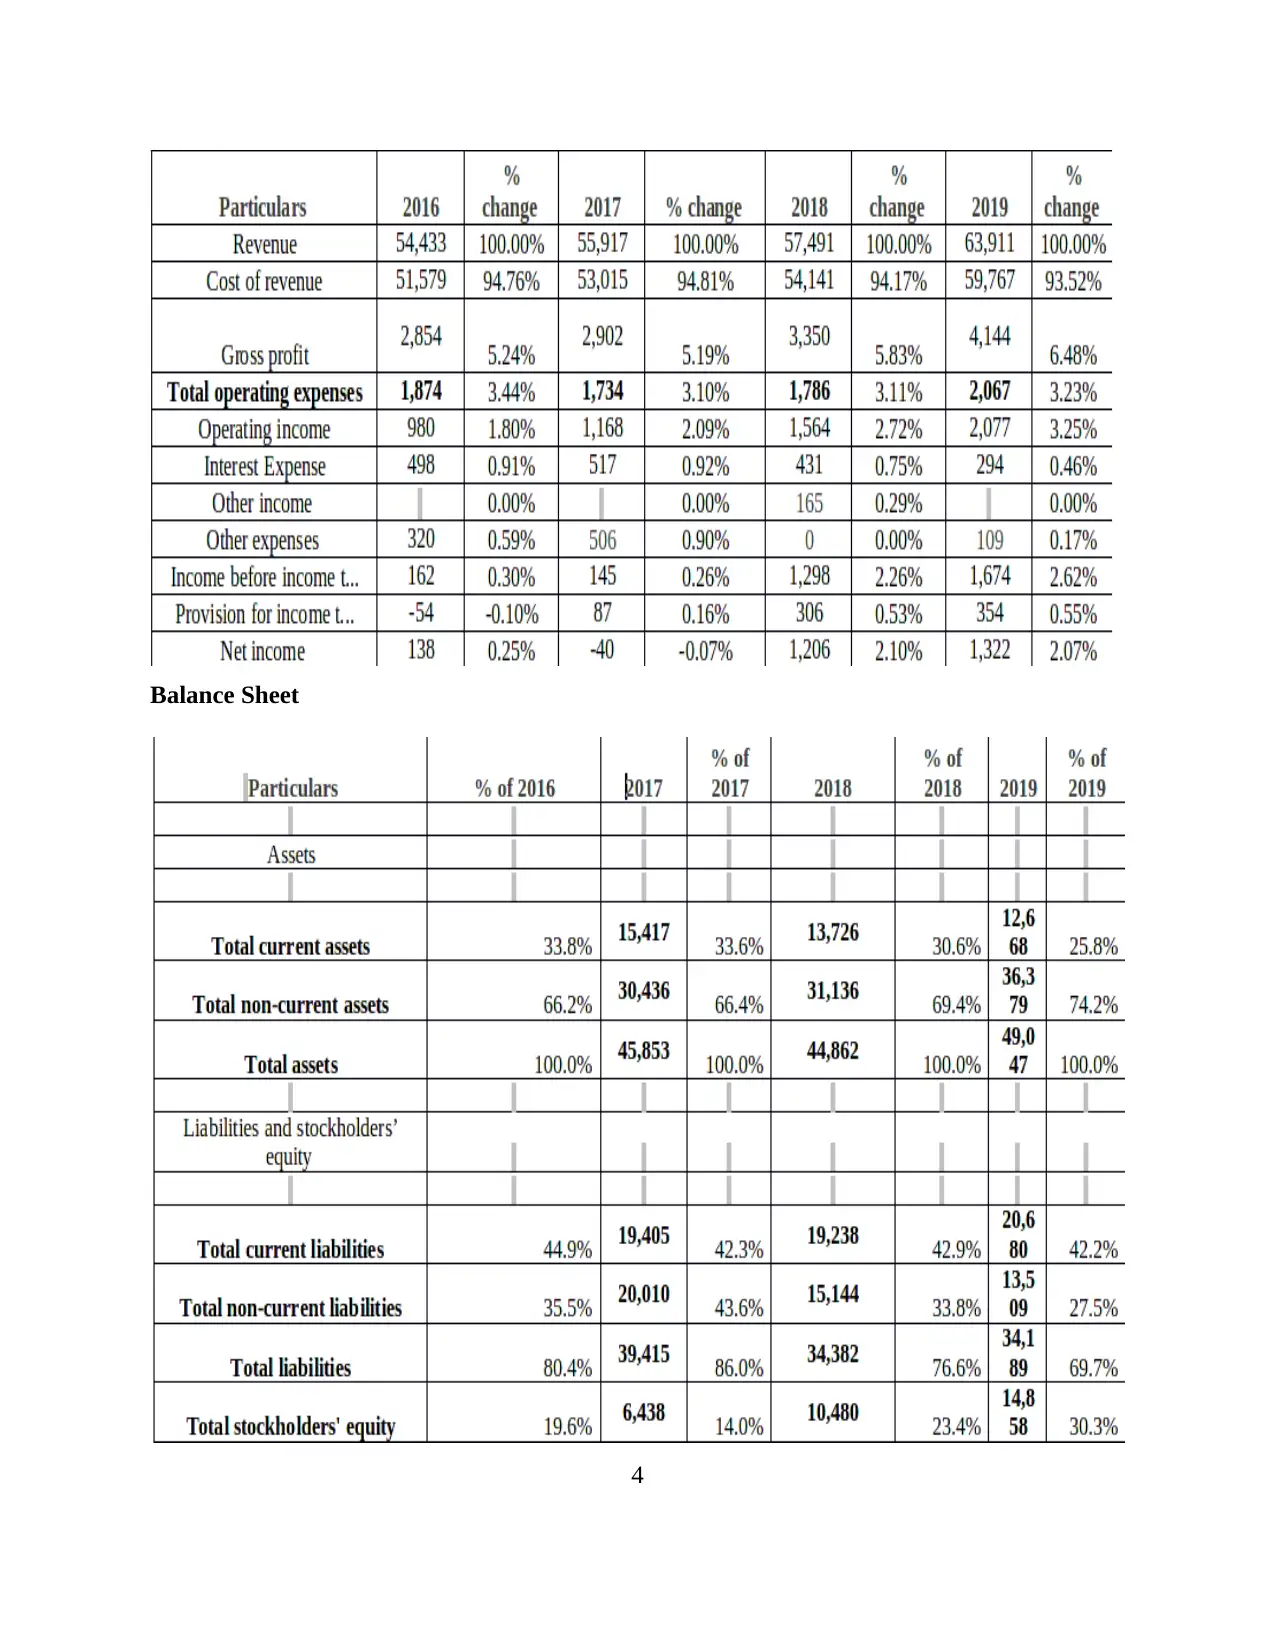
This report offers a comprehensive financial analysis of two major UK supermarket chains, Sainsbury and Tesco, aiming to assess their financial health and identify potential business opportunities. The analysis employs vertical, horizontal, and ratio analysis techniques to evaluate their income statements and balance sheets over several years. It delves into the importance of working capital analysis for informed decision-making and critically examines their cash flow statements. The report includes detailed calculations for ratio analysis, along with interpretations of key financial metrics like gross profit ratio, net profit ratio, current ratio, quick ratio, debt-equity ratio, and inventory turnover ratio. The findings are presented to assist an Asian food manufacturer in selecting the most suitable supermarket chain to expand its market share. The report emphasizes the financial performance, profitability, liquidity, and solvency of both companies to guide the manufacturer's strategic decision-making process. The report concludes by providing recommendations to the manufacturer based on the financial analysis of the two supermarkets.
Document Page
Financial Analysis Management &
Enterprise
tabler-icon-diamond-filled.svg

Paraphrase This Document

Need a fresh take? Get an instant paraphrase of this document with our AI Paraphraser
Document Page
Table of Contents
INTRODUCTION...........................................................................................................................1
MAIN BODY...................................................................................................................................1
1. Vertical, horizontal and ratio analysis of financial statements of Sainsbury and Tesco..........1
2. Importance of analysing the working capital prior to decision making.................................13
3. Critical analysis of Cash flow statements..............................................................................14
CONCLUSION .............................................................................................................................15
REFERENCES..............................................................................................................................17
APPENDIXES...............................................................................................................................19
Calculations of ratio analysis.....................................................................................................19
Balance sheets............................................................................................................................22
Cash Flow statements................................................................................................................24
Document Page
INTRODUCTION
Financial analysis can be defined as a systematic procedure of evaluating the budgets,
processes, projects and other financial aspects of a business enterprise for the purpose of
ascertaining the performance of business. In other words, financial analysis is exercised in order
to find out the stability, solvency, profitability and liquidity of a business for assessing that
company is in position to pay back the monetary investments of the investors. The present
project report is about financial analysis of two supermarket chains namely, Sainsbury and Tesco
for the purpose of assessing the financial position of these companies (Williams and Dobelman,
2017). Both the companies are large organisations in United Kingdom that offers consumer
products, personal care products, food and beverages.
The motive behind such analysis is that Asian food Manufacturer desires of increasing
their market share for which it is thinking of selling its products to one of these supermarket
chain. This analysis will help the manufacturer in knowing who could be its potential client.
Further, it will include analysis of cash flow statements of both the companies, importance of
analysing the working capital for making quality decisions and ratio analysis of both the
supermarket chains for finding out their profitability and stability.
MAIN BODY
1. Vertical, horizontal and ratio analysis of financial statements of Sainsbury and Tesco
Vertical analysis:
It is one of the technique of analysing the financial statements of a company wherein
each of the component of profit and loss statement and balance sheet are presented as % of base
amount within the financial statements. In P&L statement, component are listed as % of gross
sales while on the other hand, in Balance sheet, component can be presented as % of total assets
or total liabilities (Corbet and et.al., 2019). Below is vertical analysis of both Sainsbury and
Tesco's financial statements :
Sainsbury’s Income Statement
1
Document Page
Interpretation
It can be seen from the above analysis that each of the line item in the comparative table
is presented as % of gross sales. It can be observed that cost of revenue accounts for 93.3% of
gross sales while gross profit is 5.2% of the total sales. When it is compared with 2018, it can be
said that change in % is quite and the gross profits is even showing an increasing trend, however,
when net profits are compared it can be said that it is showing downward trends. This is because
operating costs of company is increasing year by year. This might have a negative impact on
decision making of Asian Food manufacturer for selecting this food chain as its preferred client.
Analysis of Balance Sheet
2
tabler-icon-diamond-filled.svg

Paraphrase This Document

Need a fresh take? Get an instant paraphrase of this document with our AI Paraphraser
Document Page
Interpretation:
It can be observed from the above calculations that percentage change in total current
assets over the years have been stable and has showed a increasing trend till 2018 until in the
year 2019 when it fell by 3.6%. While on the other hand, the current liabilities is showing
increasing trend and % change in increasing year by year that depicts that company's liabilities
are relatively increasing more as compared to current assets. This will impact the decision
making of Asian Food Manufacturer.
Vertical analysis of Tesco
Income statement
3
Document Page
Balance Sheet
4
Document Page
Interpretation:
From the above vertical analysis of Tesco's financial statements, it can be observed that
change in cost of revenue for the last four years has been quite stable. Also, gross profit as a
percentage of total sales is also showing increasing trend over the years since the figures are
increasing by year which is an impressive thing that could favour the decision of Asian food
manufacturer towards Tesco. Also, net profit after a significant dip in its earning in 2017, it
became stable in 2018 and 2019 which is also positive sign for the manufacturer for selling its
products to Tesco.
The balance sheet shows that percentage change in total current asset is dipping
continuously over the years which means that company has lesser liquidity as compared to
Sainsbury.
Horizontal analysis:
It is technique which compares the components of financial statements with the
corresponding components of company's financial statements. Financial statements for two or
more period are considered for this analysis and older figures are taken as base amounts against
percentage change in components of p&l and balance sheet is found out (Robinson and et.al.,
2015). Below is the vertical analysis of Sainsbury and Tesco:
Sainsbury’s Income Statement
5
tabler-icon-diamond-filled.svg

Paraphrase This Document

Need a fresh take? Get an instant paraphrase of this document with our AI Paraphraser
Document Page
Balance sheet
6
Document Page
Interpretation:
It can be analysed from the above calculations that there has been increase in revenue in
the year 2017 as compared to 2017 by 11.6% which tends to have decreased over the years like
in 2018, revenue increased by only 8.5% while in 2019 it increased by just 1%. This reflects that
company has not been to generate higher sales. Further, it can be observed that company has
made less profit in the year 2017 as compared to 2016 as it was 20% less than previous year. The
net profits are highly fluctuating for the company.
BY looking at the balance sheet of the company it can be said that total assets of the
company has increased to a satisfactory level which is 16.3% in the year 2017. However, total
assets increased in the year 2018 to only 11.47% which further went down in year 2019 wherein
it increased by only 7%. Total liabilities of the company is also showing decreasing trend which
7
Document Page
depicts good financial position of the company. This will encourage the Asian Food
manufacturer in selecting Sainsbury as its client.
Tesco's income statement
Balance sheet
8
tabler-icon-diamond-filled.svg

Paraphrase This Document

Need a fresh take? Get an instant paraphrase of this document with our AI Paraphraser
Document Page
Interpretation
It can be interpreted that change in the total assets of the company is highly fluctuating as
in year 2017, assets has been increased by 4.4% while in the year 2018, there has been a
decreased in the total assets by 2.2% which ten increased to 9.3% in the year 2019. This shows
the lack of stability in the assets of company. Further, total liabilities has decreased over the
years which is positive sign for the Asian Manufacturer since company has less liabilities and is
in a good position to repay its liabilities conveniently.
By observing the P&L of the company, it can be seen that Tesco's revenue is
continuously increasing year by year as in 2017 revenue increased by 2.73% which in 2019
increased to 11.17% . This shows that company is able to increase its sales volume over the years
and is generating good cash inflows for the business for meeting its requirements. However, due
to higher operating expenses and high taxes, the net profits of the company are fluctuating. Thus,
9
Document Page
it can be said that manufacturer shall go with the Tesco since it have better financial performance
over the last few years as compared to Sainsbury’s.
RATIO ANALYSIS
Ratio analysis refers to the tool of obtaining an in-depth knowledge about business's
efficiency, profitability, solvency and liquidity by the way of comparing the information which is
contained in the financial statements of the company (Demerjian and Owens, 2016).
Below is the ratio analysis of Sainsbury and Tesco's financial statements:
Gross profit ratio :
It is one of profitability ratio which displays the relationship between gross profit and
sales of a business (Laitinen, 2018).
companies/
Year
2016 2017 2018 2019
Sainsbury 6.19% 6.23% 6.61% 6.92%
Tesco 5.24% 5.19% 5.83% 6.48%
Interpretation:
It can be interpreted from the above table that, gross profit ratio of Sainsbury is highly
stable over the last four years. This is a great indication of company's financial prosperity. While
on the other hand, Tesco's GP ratio is reflecting an increasing trend and showing great potential
of expansion and growth. Thus, manufacturer must go with the Tesco since it is growing in the
industry.
10
chevron_up_icon
1 out of 32
circle_padding
hide_on_mobile
zoom_out_icon
[object Object]