Portfolio Management and Financial Analysis of Sainsbury and Tesco
VerifiedAdded on 2023/01/04
|20
|4221
|83
Report
AI Summary
This report delves into portfolio management, focusing on the financial performance of Sainsbury and Tesco. It begins with an introduction to portfolio management and then proceeds to a detailed financial ratio analysis, including current ratio, quick ratio, net profit margin, gearing ratio, and others, for both companies over two years. The analysis evaluates their performance, financial positions, and investment potential, followed by recommendations based on the financial data. The report also explores capital investment appraisal techniques, discusses their limitations in long-term decision-making, and concludes with a summary of the findings. The analysis uses data from 2018 and 2019 to compare the financial health and investment prospects of the two major retail companies. The report provides insights into the companies' efficiency, profitability, and financial stability, offering a comprehensive view of their performance in the market.

Portfolio Managerial
Finance
Finance
Paraphrase This Document
Need a fresh take? Get an instant paraphrase of this document with our AI Paraphraser
Table of Contents
INTRODUCTION...........................................................................................................................3
PORTOFOLIO 1..............................................................................................................................3
a. Financial ratio analysis of Sainsbury as well as Tesco: ..........................................................3
b. Analysis of performance, financial position as well as investment potential in relevance to
both companies: ..........................................................................................................................5
c. Recommendations on the basis of financial performance of business:..................................12
d. Limitations of reliability of financial ratios in context to performance of company:............12
PORTOFOLIO 2............................................................................................................................13
a. Evaluating capital investment appraisals for identifying suitable project:............................13
b. Discussing limitations associated with investment appraisal techniques for the purpose of
decision-making in long run:.....................................................................................................16
CONCLUSION..............................................................................................................................16
REFERENCES..............................................................................................................................17
INTRODUCTION
Portfolio management refers to a technique of analysing or overviewing various
investment options that company attains and selecting group of profitable investment alternatives
(Chen and Demirer, 2018). This report is based on evaluation of portfolio management in
Sainsbury and Tesco. Former organization was founded in 1869 by John James Sainsbury and is
based in London. While, later company is situated in England and was founded by Jack Cohen in
1919.
This repost consist ratio analysis of both the companies along with its interpretation.
Further, recommendations are provided on the basis of financial performance along with it
limitations of financial ratios are also discussed. Additionally, investment appraisal techniques
are studied and its results are interpreted with the intention of choosing appropriate project for
investment. Further, limitations of techniques regarding investment appraisal is discussed on the
basis of its result of long term decision-making.
PORTOFOLIO 1
a. Financial ratio analysis of Sainsbury as well as Tesco:
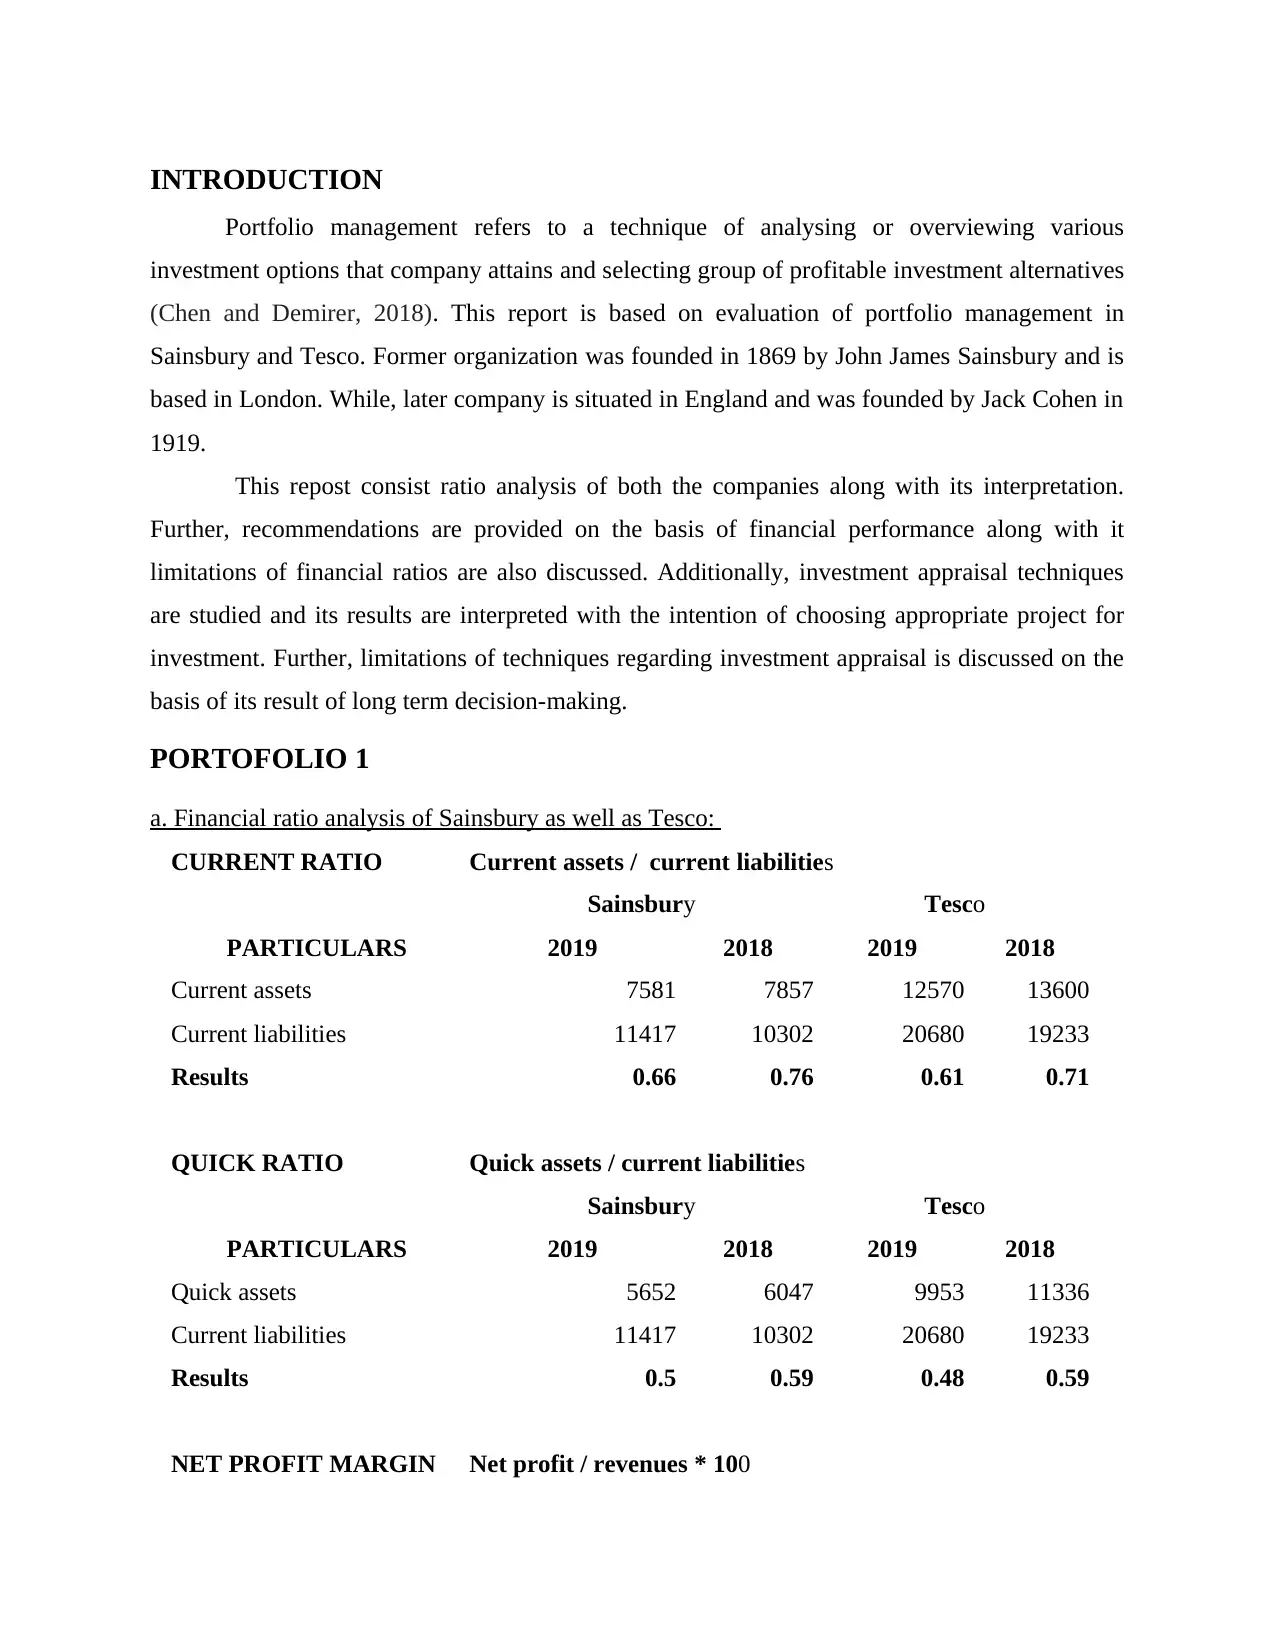
CURRENT RATIO Current assets / current liabilities
Sainsbury Tesco
PARTICULARS 2019 2018 2019 2018
Current assets 7581 7857 12570 13600
Current liabilities 11417 10302 20680 19233
Results 0.66 0.76 0.61 0.71
QUICK RATIO Quick assets / current liabilities
Sainsbury Tesco
PARTICULARS 2019 2018 2019 2018
Quick assets 5652 6047 9953 11336
Current liabilities 11417 10302 20680 19233
Results 0.5 0.59 0.48 0.59
NET PROFIT MARGIN Net profit / revenues * 100
Portfolio management refers to a technique of analysing or overviewing various
investment options that company attains and selecting group of profitable investment alternatives
(Chen and Demirer, 2018). This report is based on evaluation of portfolio management in
Sainsbury and Tesco. Former organization was founded in 1869 by John James Sainsbury and is
based in London. While, later company is situated in England and was founded by Jack Cohen in
1919.
This repost consist ratio analysis of both the companies along with its interpretation.
Further, recommendations are provided on the basis of financial performance along with it
limitations of financial ratios are also discussed. Additionally, investment appraisal techniques
are studied and its results are interpreted with the intention of choosing appropriate project for
investment. Further, limitations of techniques regarding investment appraisal is discussed on the
basis of its result of long term decision-making.
PORTOFOLIO 1
a. Financial ratio analysis of Sainsbury as well as Tesco:
CURRENT RATIO Current assets / current liabilities
Sainsbury Tesco
PARTICULARS 2019 2018 2019 2018
Current assets 7581 7857 12570 13600
Current liabilities 11417 10302 20680 19233
Results 0.66 0.76 0.61 0.71
QUICK RATIO Quick assets / current liabilities
Sainsbury Tesco
PARTICULARS 2019 2018 2019 2018
Quick assets 5652 6047 9953 11336
Current liabilities 11417 10302 20680 19233
Results 0.5 0.59 0.48 0.59
NET PROFIT MARGIN Net profit / revenues * 100
⊘ This is a preview!⊘
Do you want full access?
Subscribe today to unlock all pages.
Trusted by 1+ million students worldwide
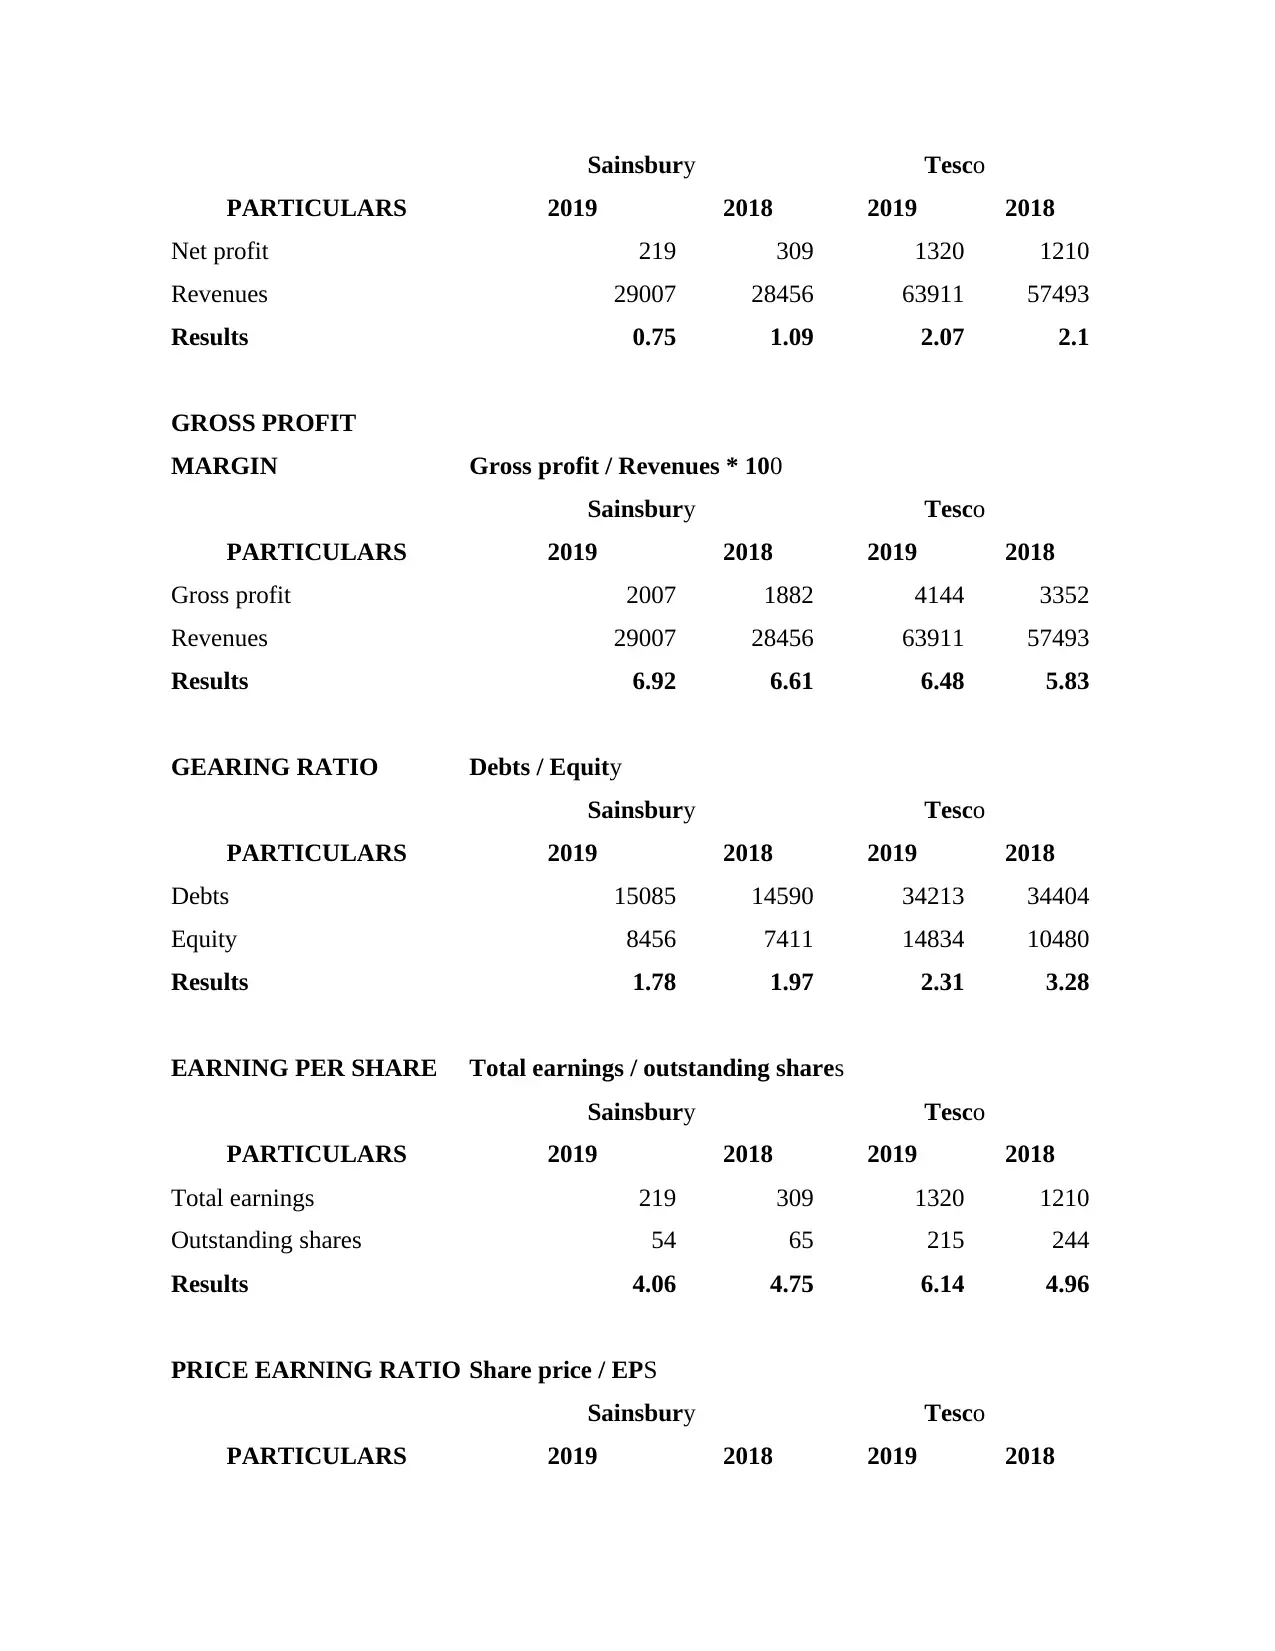
Sainsbury Tesco
PARTICULARS 2019 2018 2019 2018
Net profit 219 309 1320 1210
Revenues 29007 28456 63911 57493
Results 0.75 1.09 2.07 2.1
GROSS PROFIT
MARGIN Gross profit / Revenues * 100
Sainsbury Tesco
PARTICULARS 2019 2018 2019 2018
Gross profit 2007 1882 4144 3352
Revenues 29007 28456 63911 57493
Results 6.92 6.61 6.48 5.83
GEARING RATIO Debts / Equity
Sainsbury Tesco
PARTICULARS 2019 2018 2019 2018
Debts 15085 14590 34213 34404
Equity 8456 7411 14834 10480
Results 1.78 1.97 2.31 3.28
EARNING PER SHARE Total earnings / outstanding shares
Sainsbury Tesco
PARTICULARS 2019 2018 2019 2018
Total earnings 219 309 1320 1210
Outstanding shares 54 65 215 244
Results 4.06 4.75 6.14 4.96
PRICE EARNING RATIO Share price / EPS
Sainsbury Tesco
PARTICULARS 2019 2018 2019 2018
PARTICULARS 2019 2018 2019 2018
Net profit 219 309 1320 1210
Revenues 29007 28456 63911 57493
Results 0.75 1.09 2.07 2.1
GROSS PROFIT
MARGIN Gross profit / Revenues * 100
Sainsbury Tesco
PARTICULARS 2019 2018 2019 2018
Gross profit 2007 1882 4144 3352
Revenues 29007 28456 63911 57493
Results 6.92 6.61 6.48 5.83
GEARING RATIO Debts / Equity
Sainsbury Tesco
PARTICULARS 2019 2018 2019 2018
Debts 15085 14590 34213 34404
Equity 8456 7411 14834 10480
Results 1.78 1.97 2.31 3.28
EARNING PER SHARE Total earnings / outstanding shares
Sainsbury Tesco
PARTICULARS 2019 2018 2019 2018
Total earnings 219 309 1320 1210
Outstanding shares 54 65 215 244
Results 4.06 4.75 6.14 4.96
PRICE EARNING RATIO Share price / EPS
Sainsbury Tesco
PARTICULARS 2019 2018 2019 2018
Paraphrase This Document
Need a fresh take? Get an instant paraphrase of this document with our AI Paraphraser
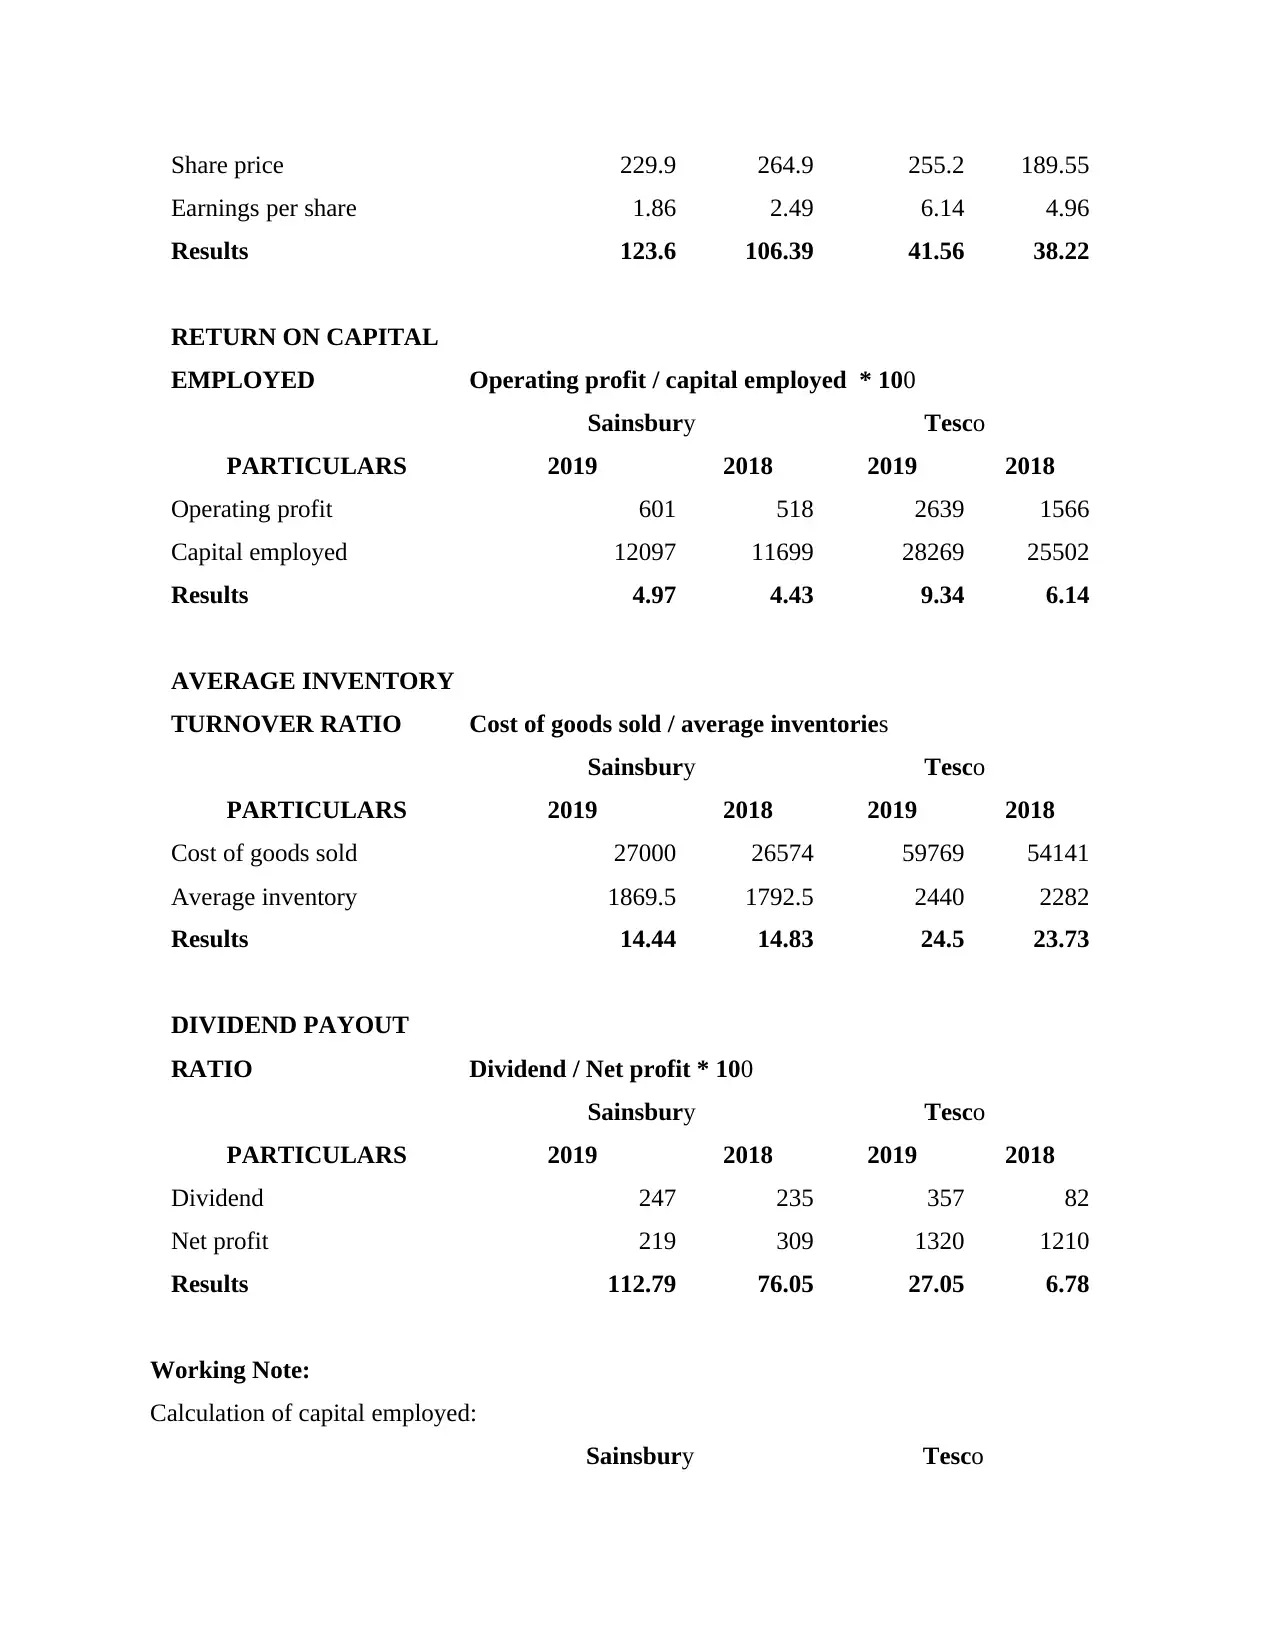
Share price 229.9 264.9 255.2 189.55
Earnings per share 1.86 2.49 6.14 4.96
Results 123.6 106.39 41.56 38.22
RETURN ON CAPITAL
EMPLOYED Operating profit / capital employed * 100
Sainsbury Tesco
PARTICULARS 2019 2018 2019 2018
Operating profit 601 518 2639 1566
Capital employed 12097 11699 28269 25502
Results 4.97 4.43 9.34 6.14
AVERAGE INVENTORY
TURNOVER RATIO Cost of goods sold / average inventories
Sainsbury Tesco
PARTICULARS 2019 2018 2019 2018
Cost of goods sold 27000 26574 59769 54141
Average inventory 1869.5 1792.5 2440 2282
Results 14.44 14.83 24.5 23.73
DIVIDEND PAYOUT
RATIO Dividend / Net profit * 100
Sainsbury Tesco
PARTICULARS 2019 2018 2019 2018
Dividend 247 235 357 82
Net profit 219 309 1320 1210
Results 112.79 76.05 27.05 6.78
Working Note:
Calculation of capital employed:
Sainsbury Tesco
PARTICULARS 2019 2018 2019 2018
Total assets 23514 22001 48949 44735
Less: Current liabilities 11417 10302 20680 19233
Capital employed 12097 11699 28269 25502
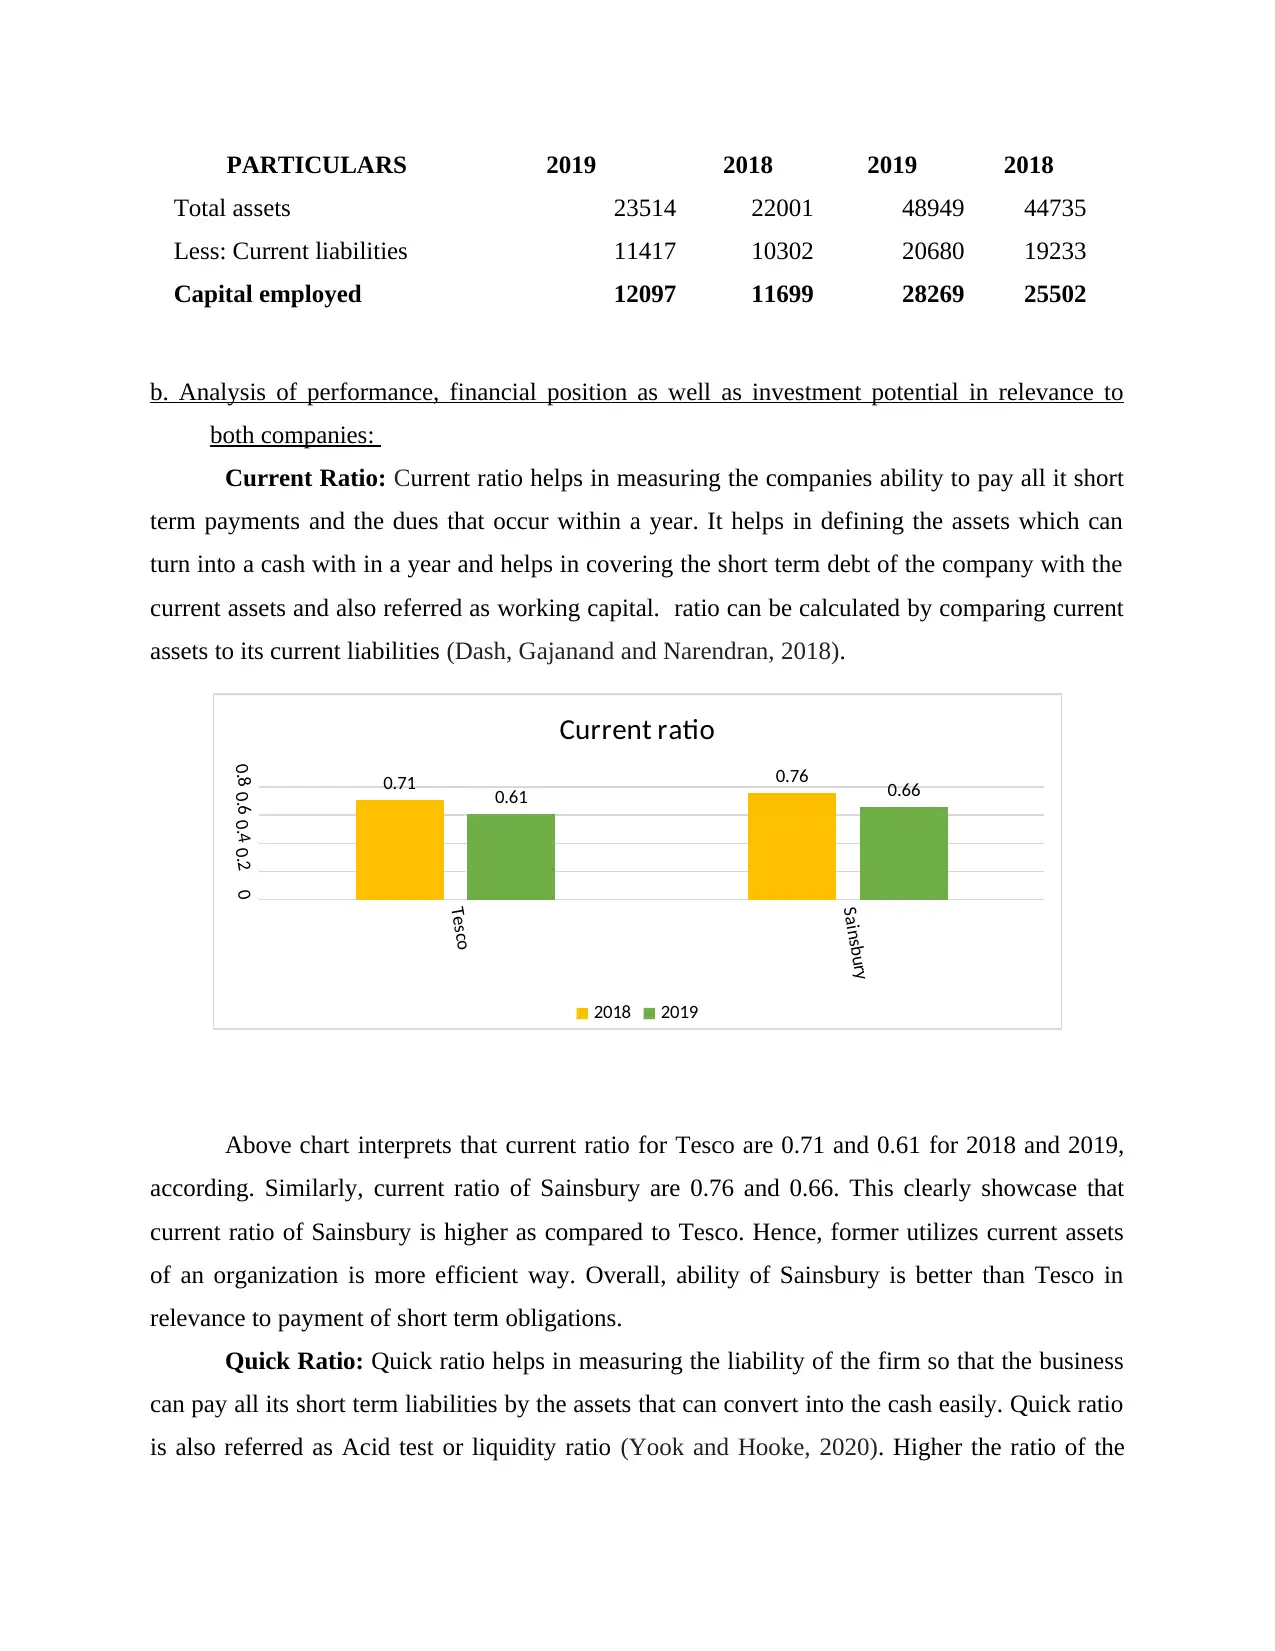
b. Analysis of performance, financial position as well as investment potential in relevance to
both companies:
Current Ratio: Current ratio helps in measuring the companies ability to pay all it short
term payments and the dues that occur within a year. It helps in defining the assets which can
turn into a cash with in a year and helps in covering the short term debt of the company with the
current assets and also referred as working capital. ratio can be calculated by comparing current
assets to its current liabilities (Dash, Gajanand and Narendran, 2018).
Above chart interprets that current ratio for Tesco are 0.71 and 0.61 for 2018 and 2019,
according. Similarly, current ratio of Sainsbury are 0.76 and 0.66. This clearly showcase that
current ratio of Sainsbury is higher as compared to Tesco. Hence, former utilizes current assets
of an organization is more efficient way. Overall, ability of Sainsbury is better than Tesco in
relevance to payment of short term obligations.
Quick Ratio: Quick ratio helps in measuring the liability of the firm so that the business
can pay all its short term liabilities by the assets that can convert into the cash easily. Quick ratio
is also referred as Acid test or liquidity ratio (Yook and Hooke, 2020). Higher the ratio of the
Tesco
Sainsbury
00.20.40.60.8 0.71 0.76
0.61 0.66
Current ratio
2018 2019
Total assets 23514 22001 48949 44735
Less: Current liabilities 11417 10302 20680 19233
Capital employed 12097 11699 28269 25502
b. Analysis of performance, financial position as well as investment potential in relevance to
both companies:
Current Ratio: Current ratio helps in measuring the companies ability to pay all it short
term payments and the dues that occur within a year. It helps in defining the assets which can
turn into a cash with in a year and helps in covering the short term debt of the company with the
current assets and also referred as working capital. ratio can be calculated by comparing current
assets to its current liabilities (Dash, Gajanand and Narendran, 2018).
Above chart interprets that current ratio for Tesco are 0.71 and 0.61 for 2018 and 2019,
according. Similarly, current ratio of Sainsbury are 0.76 and 0.66. This clearly showcase that
current ratio of Sainsbury is higher as compared to Tesco. Hence, former utilizes current assets
of an organization is more efficient way. Overall, ability of Sainsbury is better than Tesco in
relevance to payment of short term obligations.
Quick Ratio: Quick ratio helps in measuring the liability of the firm so that the business
can pay all its short term liabilities by the assets that can convert into the cash easily. Quick ratio
is also referred as Acid test or liquidity ratio (Yook and Hooke, 2020). Higher the ratio of the
Tesco
Sainsbury
00.20.40.60.8 0.71 0.76
0.61 0.66
Current ratio
2018 2019
⊘ This is a preview!⊘
Do you want full access?
Subscribe today to unlock all pages.
Trusted by 1+ million students worldwide
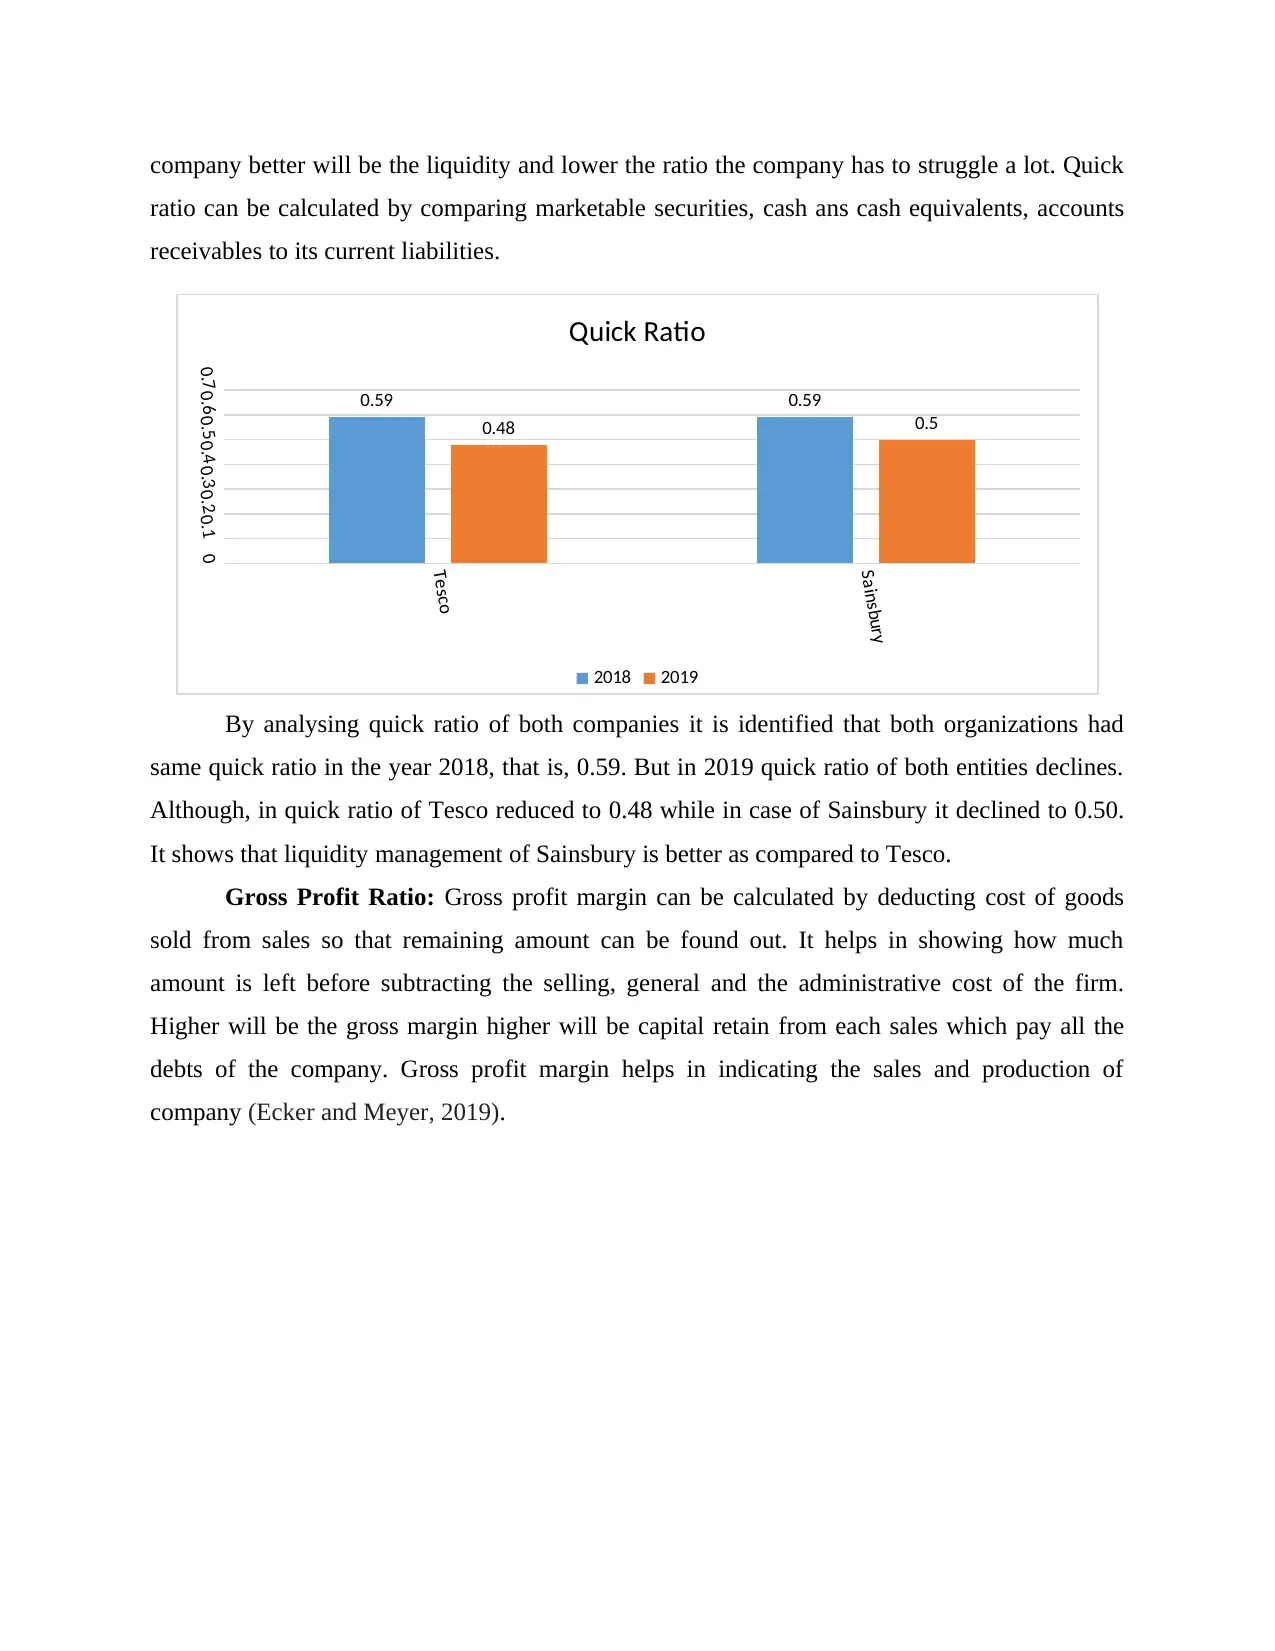
company better will be the liquidity and lower the ratio the company has to struggle a lot. Quick
ratio can be calculated by comparing marketable securities, cash ans cash equivalents, accounts
receivables to its current liabilities.
By analysing quick ratio of both companies it is identified that both organizations had
same quick ratio in the year 2018, that is, 0.59. But in 2019 quick ratio of both entities declines.
Although, in quick ratio of Tesco reduced to 0.48 while in case of Sainsbury it declined to 0.50.
It shows that liquidity management of Sainsbury is better as compared to Tesco.
Gross Profit Ratio: Gross profit margin can be calculated by deducting cost of goods
sold from sales so that remaining amount can be found out. It helps in showing how much
amount is left before subtracting the selling, general and the administrative cost of the firm.
Higher will be the gross margin higher will be capital retain from each sales which pay all the
debts of the company. Gross profit margin helps in indicating the sales and production of
company (Ecker and Meyer, 2019).
Tesco
Sainsbury
00.10.20.30.40.50.60.7 0.59 0.59
0.48 0.5
Quick Ratio
2018 2019
Paraphrase This Document
Need a fresh take? Get an instant paraphrase of this document with our AI Paraphraser
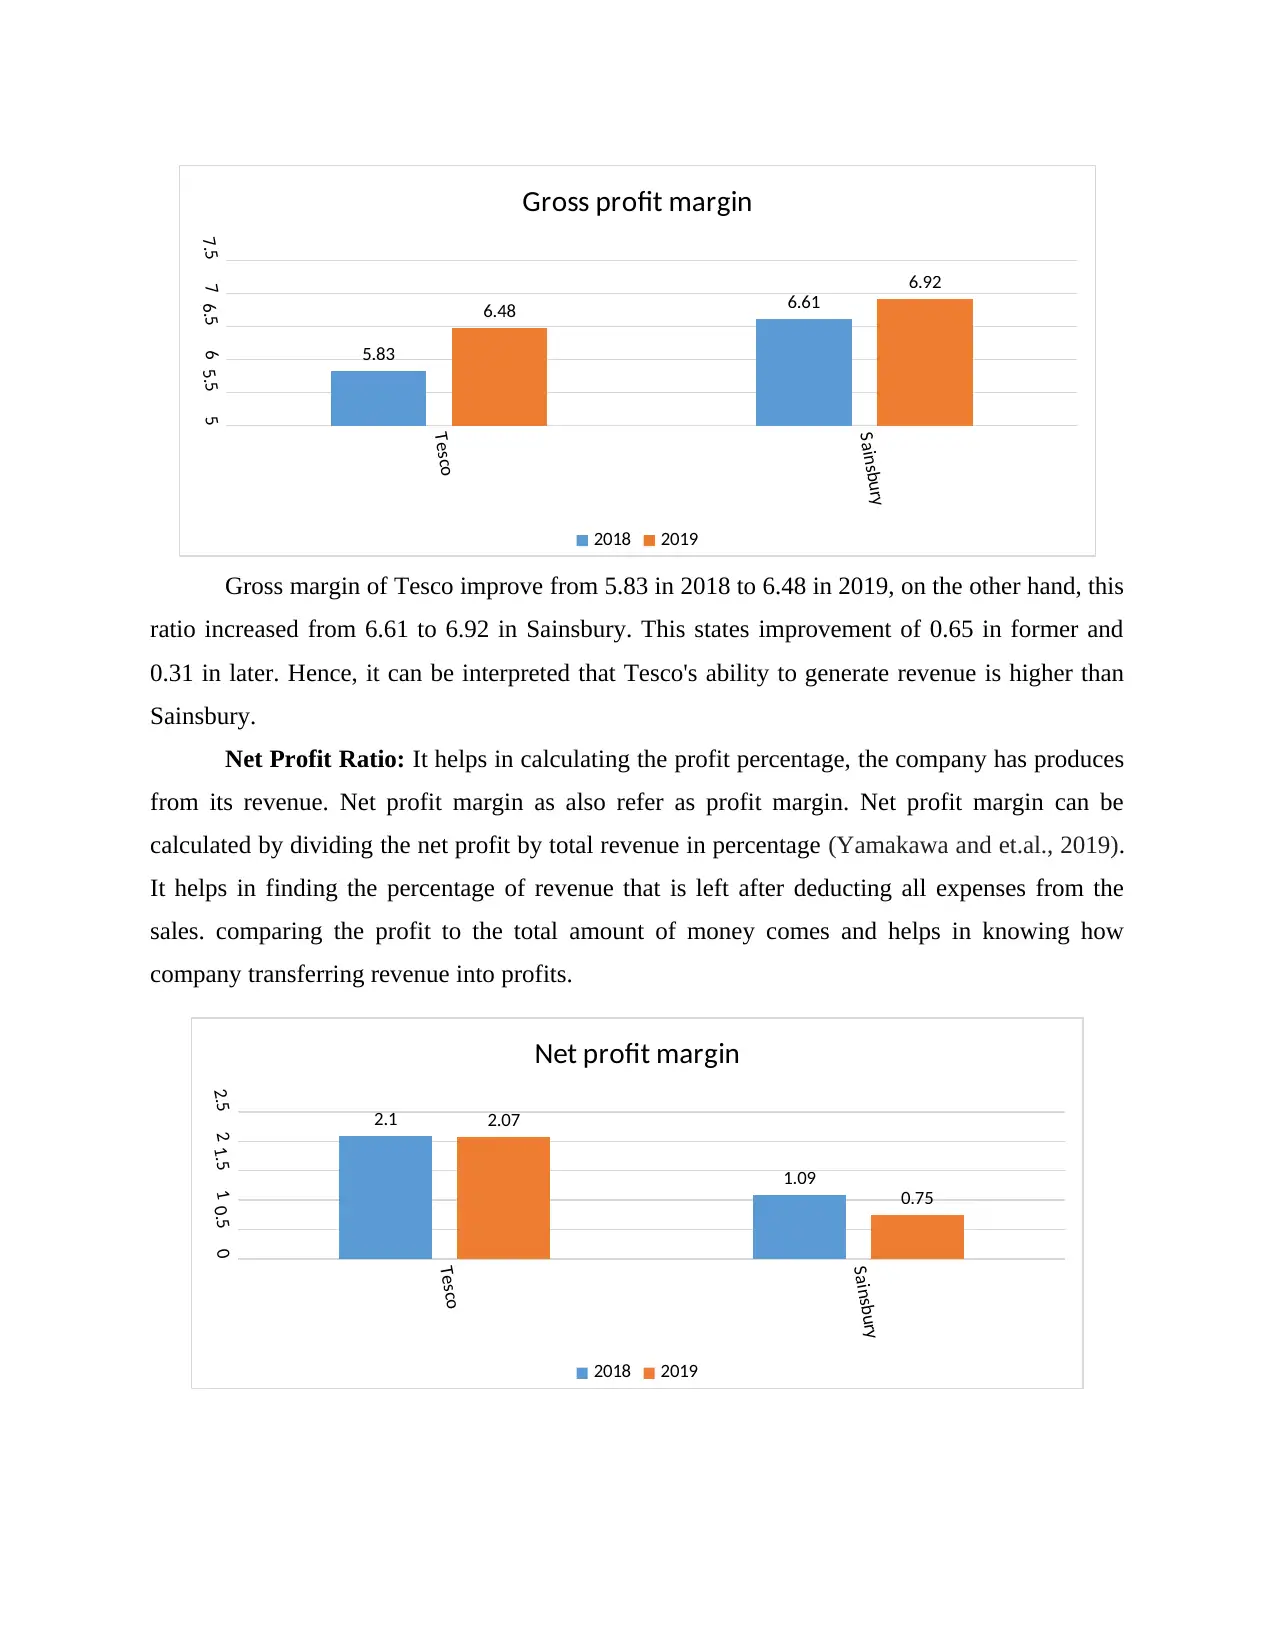
Gross margin of Tesco improve from 5.83 in 2018 to 6.48 in 2019, on the other hand, this
ratio increased from 6.61 to 6.92 in Sainsbury. This states improvement of 0.65 in former and
0.31 in later. Hence, it can be interpreted that Tesco's ability to generate revenue is higher than
Sainsbury.
Net Profit Ratio: It helps in calculating the profit percentage, the company has produces
from its revenue. Net profit margin as also refer as profit margin. Net profit margin can be
calculated by dividing the net profit by total revenue in percentage (Yamakawa and et.al., 2019).
It helps in finding the percentage of revenue that is left after deducting all expenses from the
sales. comparing the profit to the total amount of money comes and helps in knowing how
company transferring revenue into profits.
Tesco
Sainsbury
55.566.577.5
5.83
6.616.48
6.92
Gross profit margin
2018 2019
Tesco
Sainsbury
00.511.522.5 2.1
1.09
2.07
0.75
Net profit margin
2018 2019
From the graph that is mentioned above, it can be analysed that net profit margin of
Tesco is greater as compared to Sainsbury. Additionally, profit margin of Tesco have increased
from 2018 to 2019, on the other hand, it decreased in case of Sainsbury. Hence, earning capacity
of former is higher.
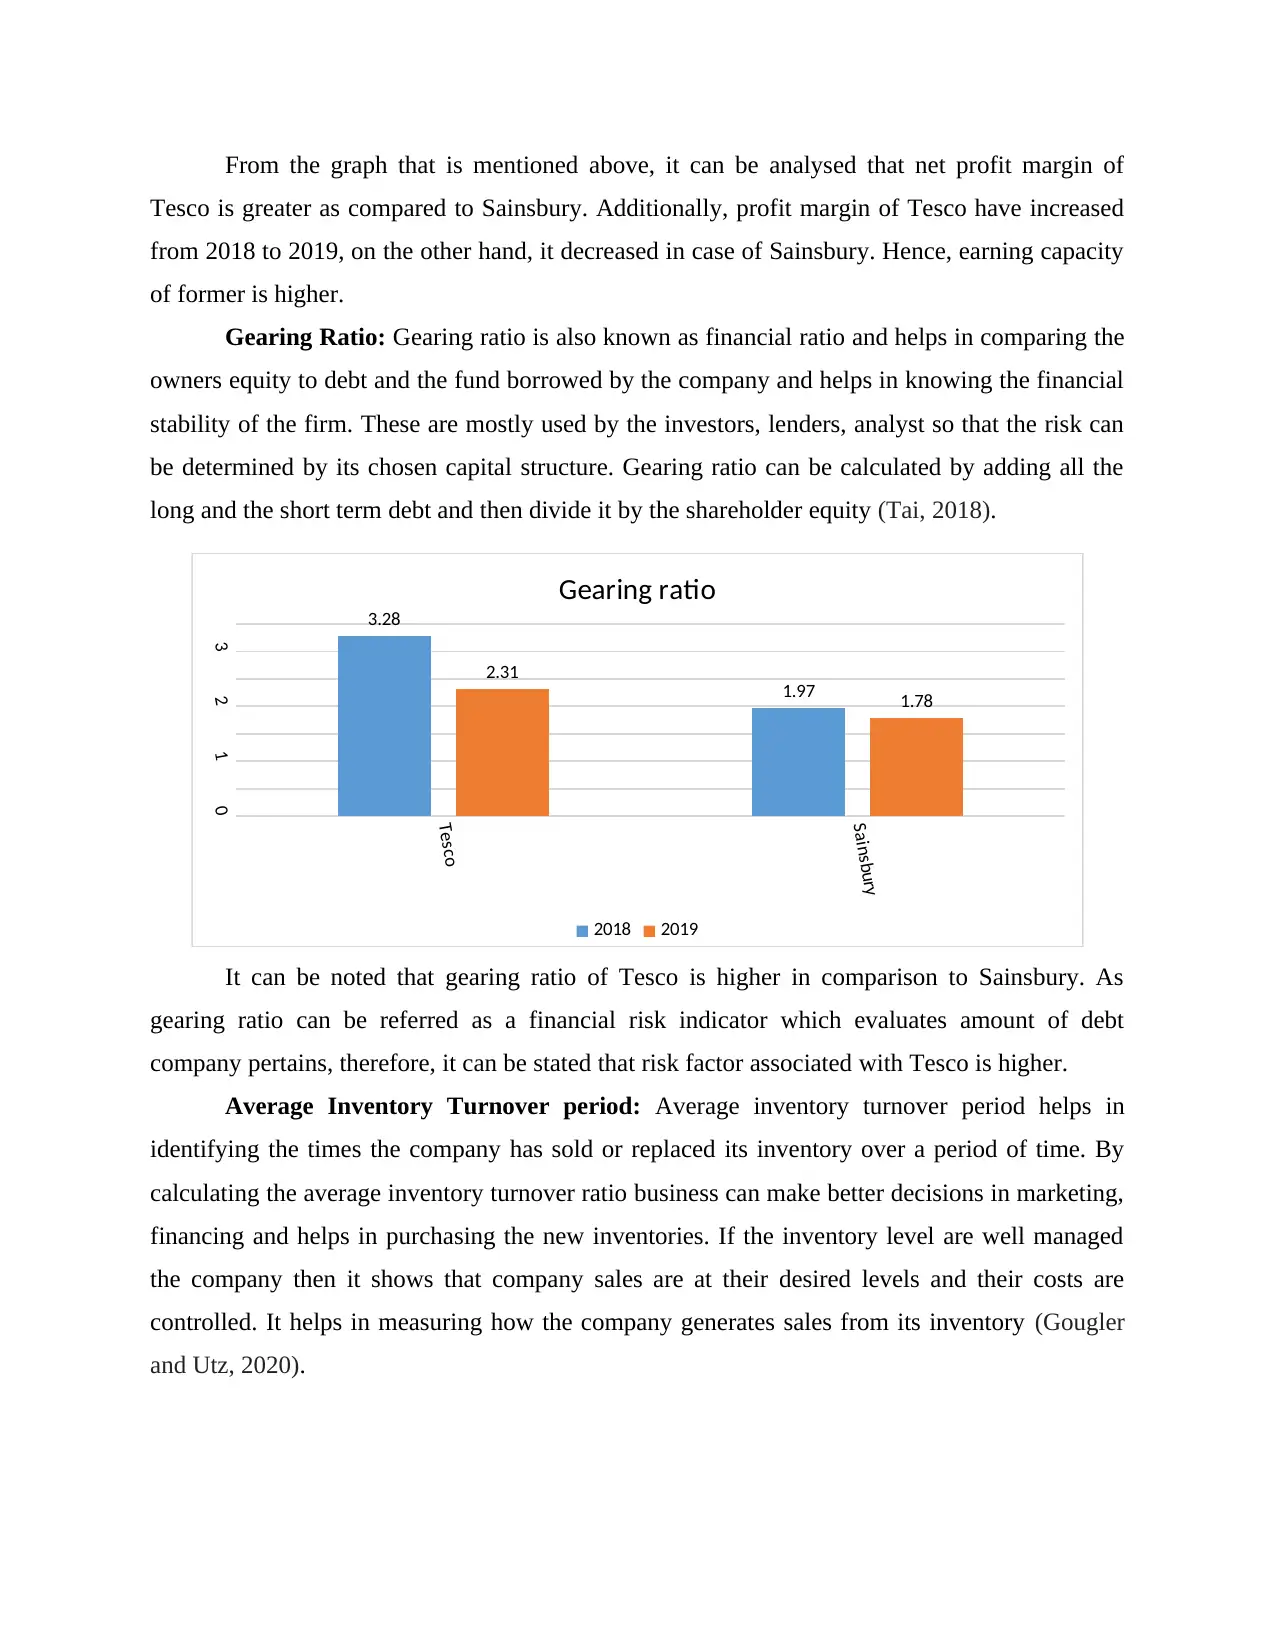
Gearing Ratio: Gearing ratio is also known as financial ratio and helps in comparing the
owners equity to debt and the fund borrowed by the company and helps in knowing the financial
stability of the firm. These are mostly used by the investors, lenders, analyst so that the risk can
be determined by its chosen capital structure. Gearing ratio can be calculated by adding all the
long and the short term debt and then divide it by the shareholder equity (Tai, 2018).
It can be noted that gearing ratio of Tesco is higher in comparison to Sainsbury. As
gearing ratio can be referred as a financial risk indicator which evaluates amount of debt
company pertains, therefore, it can be stated that risk factor associated with Tesco is higher.
Average Inventory Turnover period: Average inventory turnover period helps in
identifying the times the company has sold or replaced its inventory over a period of time. By
calculating the average inventory turnover ratio business can make better decisions in marketing,
financing and helps in purchasing the new inventories. If the inventory level are well managed
the company then it shows that company sales are at their desired levels and their costs are
controlled. It helps in measuring how the company generates sales from its inventory (Gougler
and Utz, 2020).
Tesco
Sainsbury
0
1
2
3
3.28
1.97
2.31
1.78
Gearing ratio
2018 2019
Tesco is greater as compared to Sainsbury. Additionally, profit margin of Tesco have increased
from 2018 to 2019, on the other hand, it decreased in case of Sainsbury. Hence, earning capacity
of former is higher.
Gearing Ratio: Gearing ratio is also known as financial ratio and helps in comparing the
owners equity to debt and the fund borrowed by the company and helps in knowing the financial
stability of the firm. These are mostly used by the investors, lenders, analyst so that the risk can
be determined by its chosen capital structure. Gearing ratio can be calculated by adding all the
long and the short term debt and then divide it by the shareholder equity (Tai, 2018).
It can be noted that gearing ratio of Tesco is higher in comparison to Sainsbury. As
gearing ratio can be referred as a financial risk indicator which evaluates amount of debt
company pertains, therefore, it can be stated that risk factor associated with Tesco is higher.
Average Inventory Turnover period: Average inventory turnover period helps in
identifying the times the company has sold or replaced its inventory over a period of time. By
calculating the average inventory turnover ratio business can make better decisions in marketing,
financing and helps in purchasing the new inventories. If the inventory level are well managed
the company then it shows that company sales are at their desired levels and their costs are
controlled. It helps in measuring how the company generates sales from its inventory (Gougler
and Utz, 2020).
Tesco
Sainsbury
0
1
2
3
3.28
1.97
2.31
1.78
Gearing ratio
2018 2019
⊘ This is a preview!⊘
Do you want full access?
Subscribe today to unlock all pages.
Trusted by 1+ million students worldwide
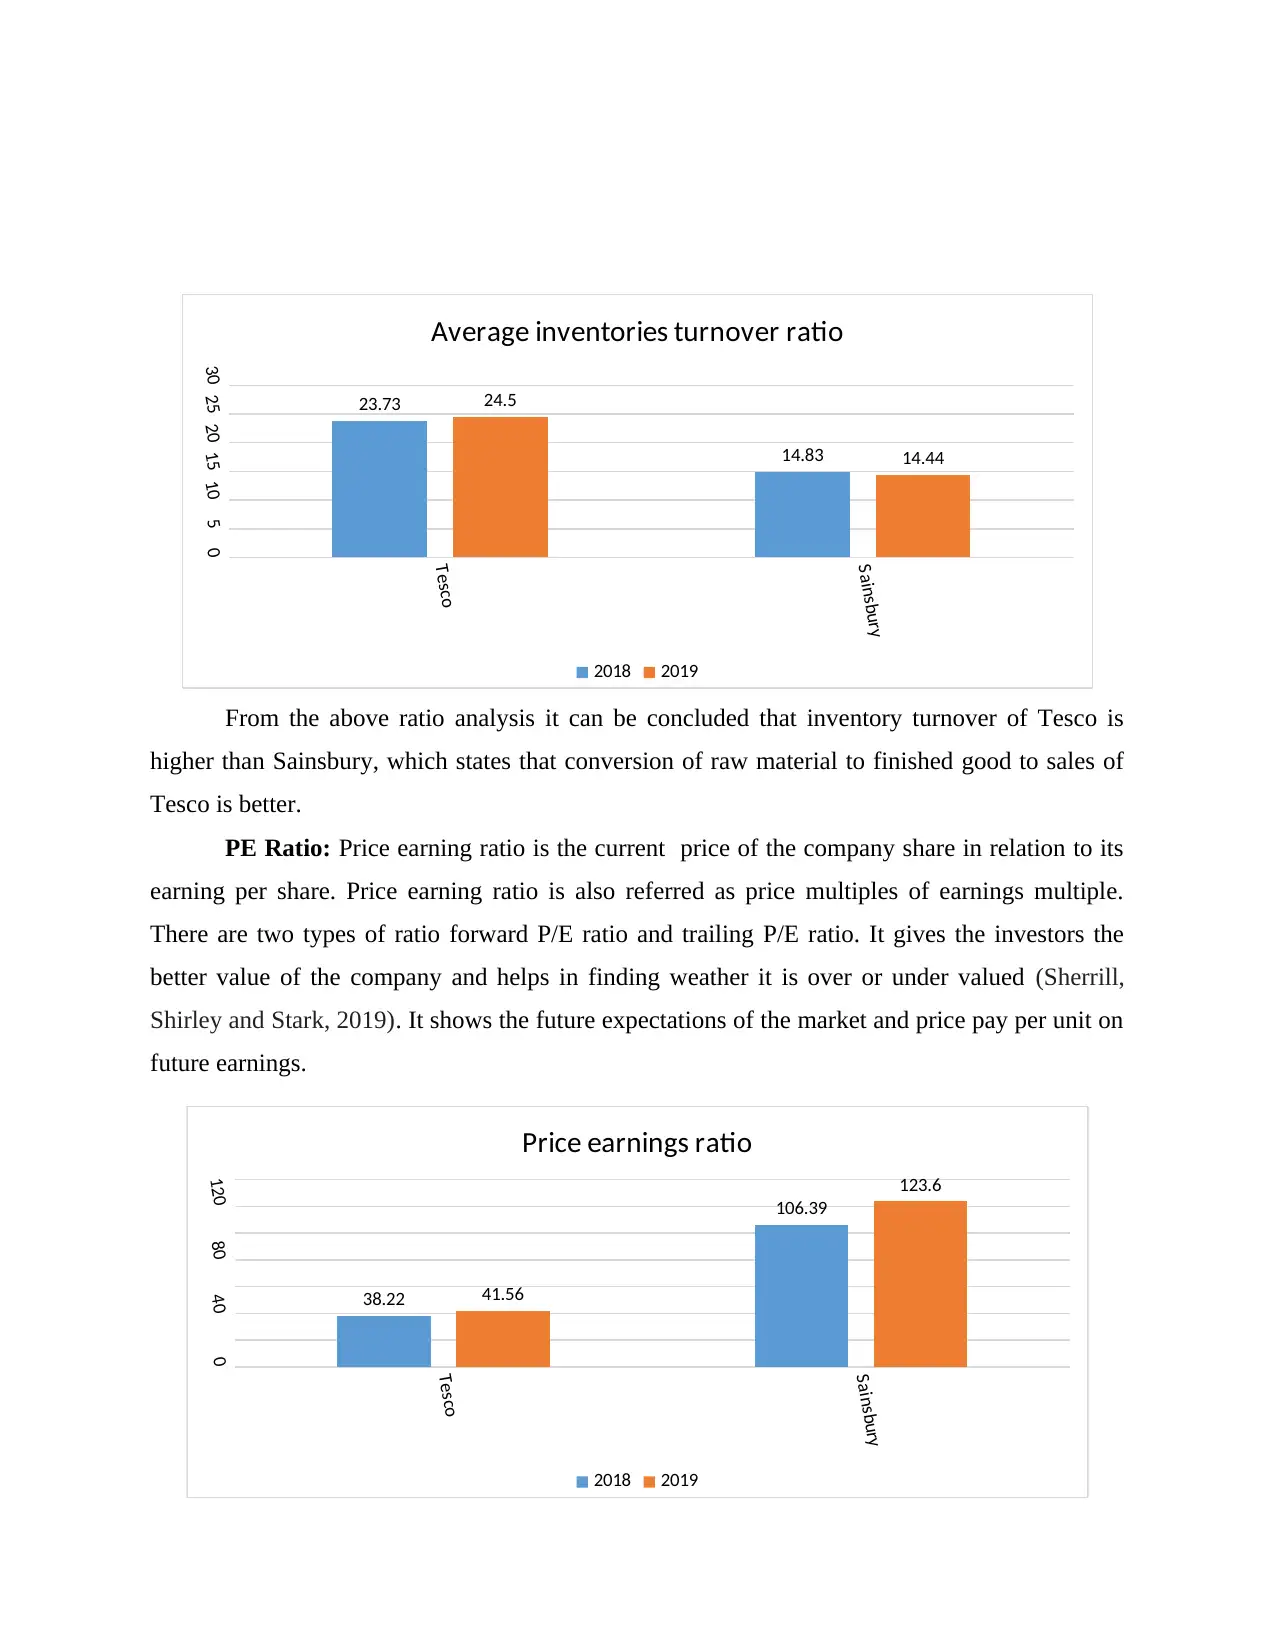
From the above ratio analysis it can be concluded that inventory turnover of Tesco is
higher than Sainsbury, which states that conversion of raw material to finished good to sales of
Tesco is better.
PE Ratio: Price earning ratio is the current price of the company share in relation to its
earning per share. Price earning ratio is also referred as price multiples of earnings multiple.
There are two types of ratio forward P/E ratio and trailing P/E ratio. It gives the investors the
better value of the company and helps in finding weather it is over or under valued (Sherrill,
Shirley and Stark, 2019). It shows the future expectations of the market and price pay per unit on
future earnings.
Tesco
Sainsbury
051015202530
23.73
14.83
24.5
14.44
Average inventories turnover ratio
2018 2019
Tesco
Sainsbury
0
40
80
120
38.22
106.39
41.56
123.6
Price earnings ratio
2018 2019
Paraphrase This Document
Need a fresh take? Get an instant paraphrase of this document with our AI Paraphraser
Higher price earning ratio denotes higher amount is paid by investors in context to their
earnings. As, PE ratio of Sainsbury if higher than Tesco in both years it can be said that
investors of Sainsbury are paying excessive price as compared to their earnings.
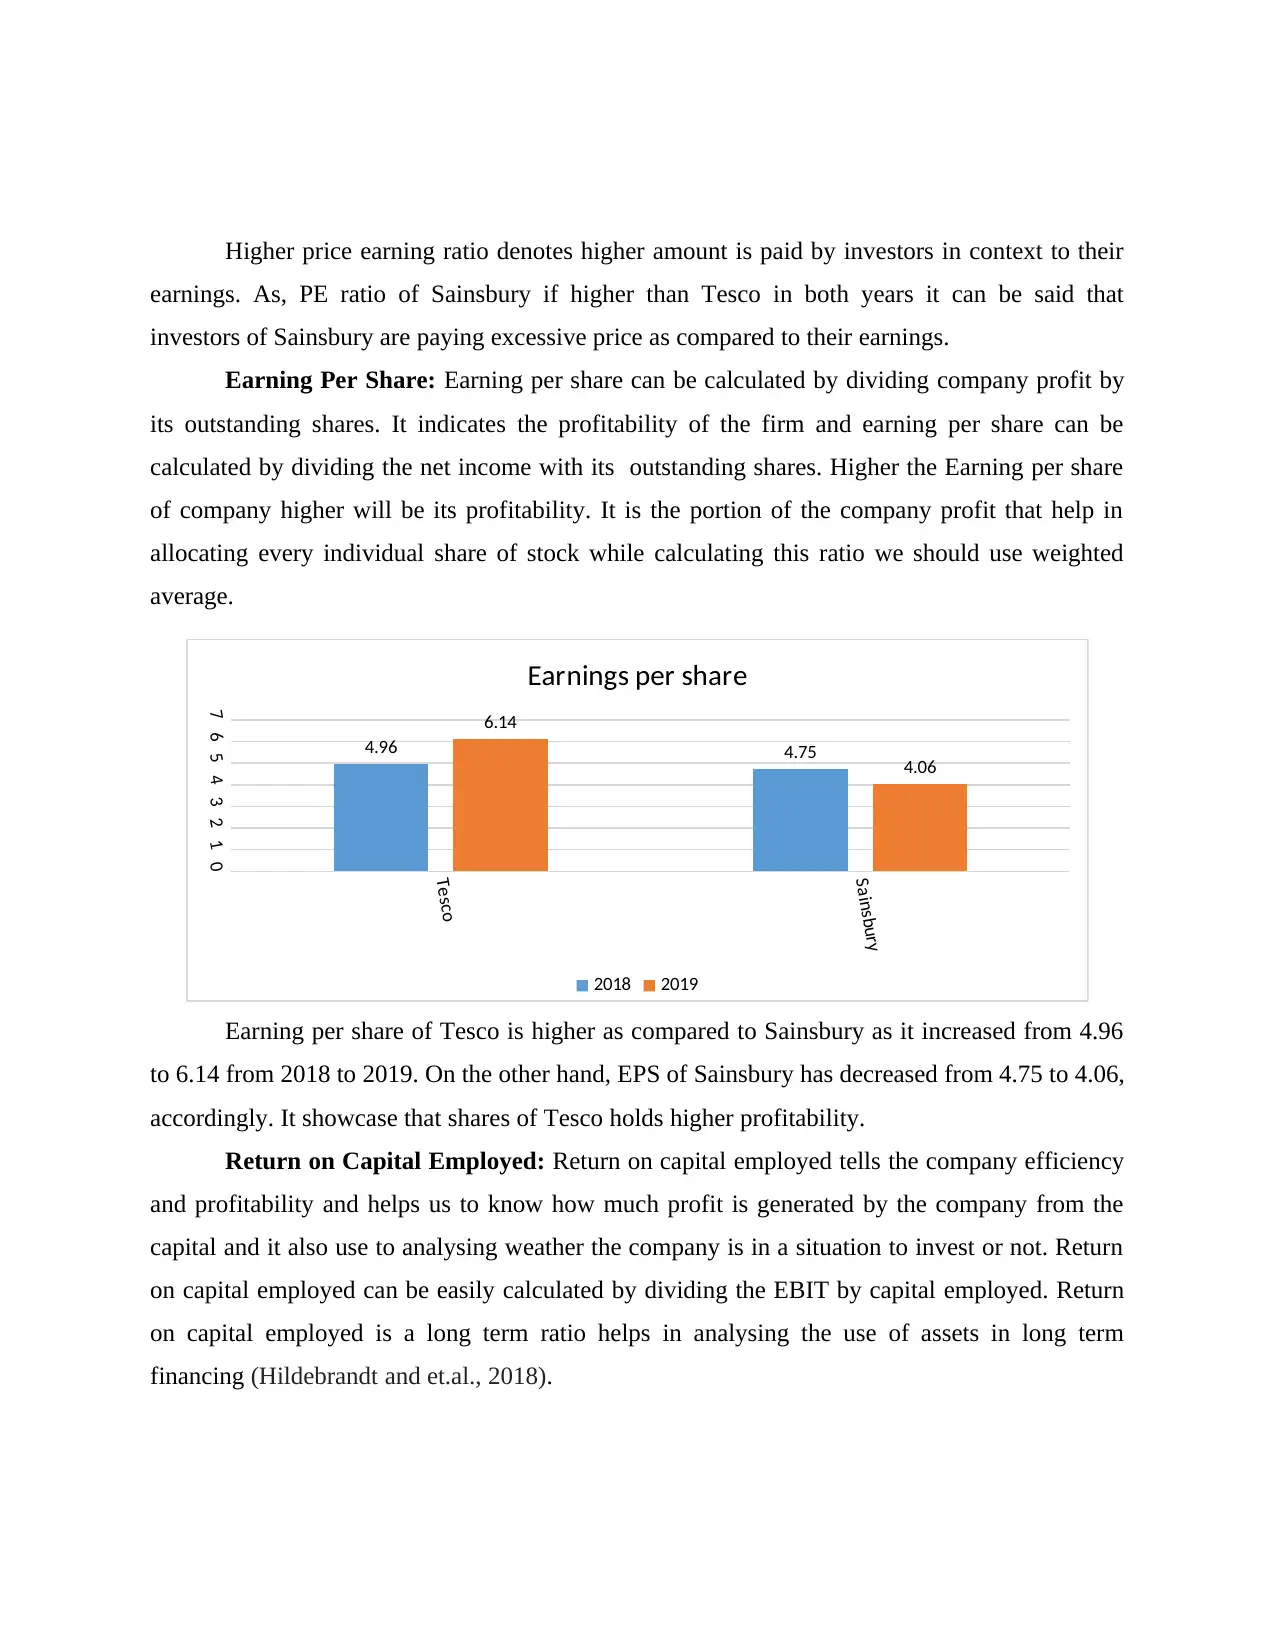
Earning Per Share: Earning per share can be calculated by dividing company profit by
its outstanding shares. It indicates the profitability of the firm and earning per share can be
calculated by dividing the net income with its outstanding shares. Higher the Earning per share
of company higher will be its profitability. It is the portion of the company profit that help in
allocating every individual share of stock while calculating this ratio we should use weighted
average.
Earning per share of Tesco is higher as compared to Sainsbury as it increased from 4.96
to 6.14 from 2018 to 2019. On the other hand, EPS of Sainsbury has decreased from 4.75 to 4.06,
accordingly. It showcase that shares of Tesco holds higher profitability.
Return on Capital Employed: Return on capital employed tells the company efficiency
and profitability and helps us to know how much profit is generated by the company from the
capital and it also use to analysing weather the company is in a situation to invest or not. Return
on capital employed can be easily calculated by dividing the EBIT by capital employed. Return
on capital employed is a long term ratio helps in analysing the use of assets in long term
financing (Hildebrandt and et.al., 2018).
Tesco
Sainsbury
01234567
4.96 4.75
6.14
4.06
Earnings per share
2018 2019
earnings. As, PE ratio of Sainsbury if higher than Tesco in both years it can be said that
investors of Sainsbury are paying excessive price as compared to their earnings.
Earning Per Share: Earning per share can be calculated by dividing company profit by
its outstanding shares. It indicates the profitability of the firm and earning per share can be
calculated by dividing the net income with its outstanding shares. Higher the Earning per share
of company higher will be its profitability. It is the portion of the company profit that help in
allocating every individual share of stock while calculating this ratio we should use weighted
average.
Earning per share of Tesco is higher as compared to Sainsbury as it increased from 4.96
to 6.14 from 2018 to 2019. On the other hand, EPS of Sainsbury has decreased from 4.75 to 4.06,
accordingly. It showcase that shares of Tesco holds higher profitability.
Return on Capital Employed: Return on capital employed tells the company efficiency
and profitability and helps us to know how much profit is generated by the company from the
capital and it also use to analysing weather the company is in a situation to invest or not. Return
on capital employed can be easily calculated by dividing the EBIT by capital employed. Return
on capital employed is a long term ratio helps in analysing the use of assets in long term
financing (Hildebrandt and et.al., 2018).
Tesco
Sainsbury
01234567
4.96 4.75
6.14
4.06
Earnings per share
2018 2019
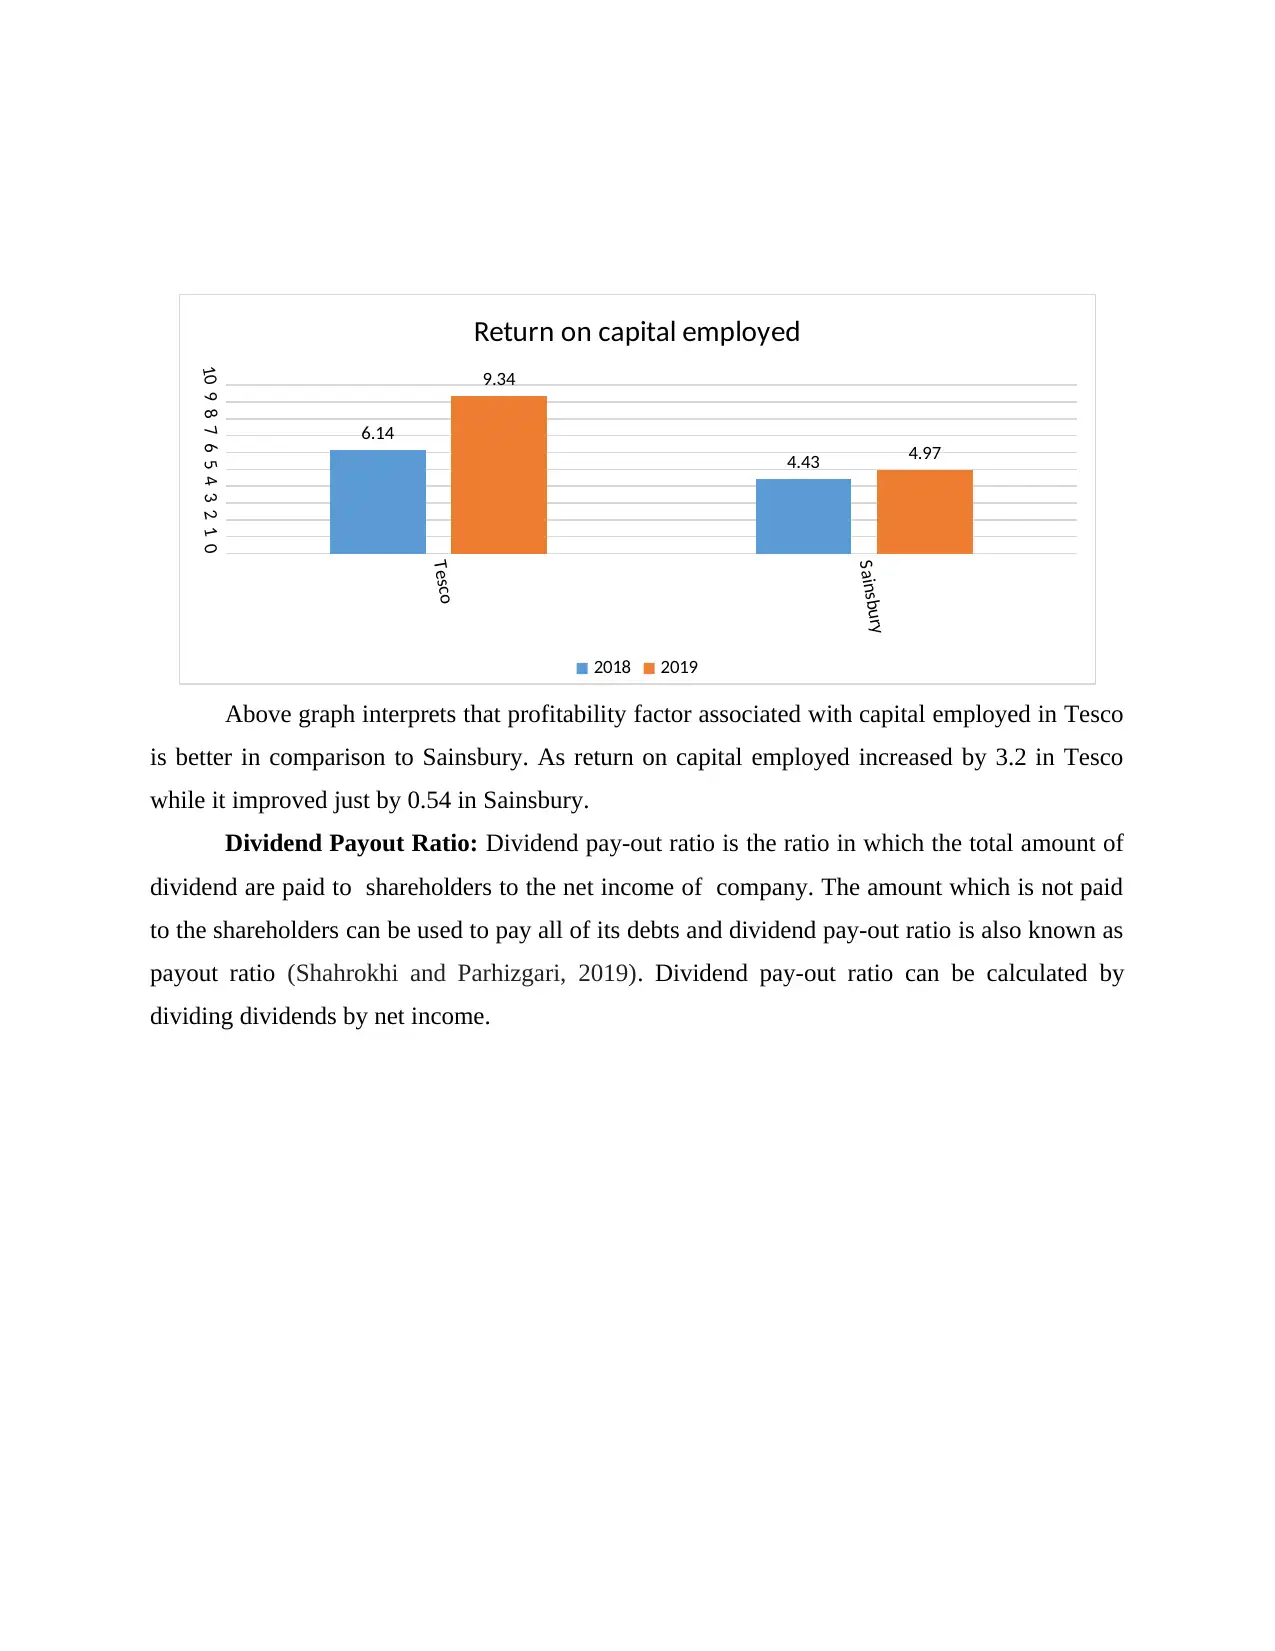
Above graph interprets that profitability factor associated with capital employed in Tesco
is better in comparison to Sainsbury. As return on capital employed increased by 3.2 in Tesco
while it improved just by 0.54 in Sainsbury.
Dividend Payout Ratio: Dividend pay-out ratio is the ratio in which the total amount of
dividend are paid to shareholders to the net income of company. The amount which is not paid
to the shareholders can be used to pay all of its debts and dividend pay-out ratio is also known as
payout ratio (Shahrokhi and Parhizgari, 2019). Dividend pay-out ratio can be calculated by
dividing dividends by net income.Tesco
Sainsbury
012345678910
6.14
4.43
9.34
4.97
Return on capital employed
2018 2019
⊘ This is a preview!⊘
Do you want full access?
Subscribe today to unlock all pages.
Trusted by 1+ million students worldwide
1 out of 20
Related Documents


Your All-in-One AI-Powered Toolkit for Academic Success.
+13062052269
info@desklib.com
Available 24*7 on WhatsApp / Email
![[object Object]](/_next/static/media/star-bottom.7253800d.svg)
Unlock your academic potential
Copyright © 2020–2026 A2Z Services. All Rights Reserved. Developed and managed by ZUCOL.