Comprehensive Analysis of Sainsbury's Performance and Market Position

Verified

Added on  2023/04/22

|14
|461
|70
Report
AI Summary
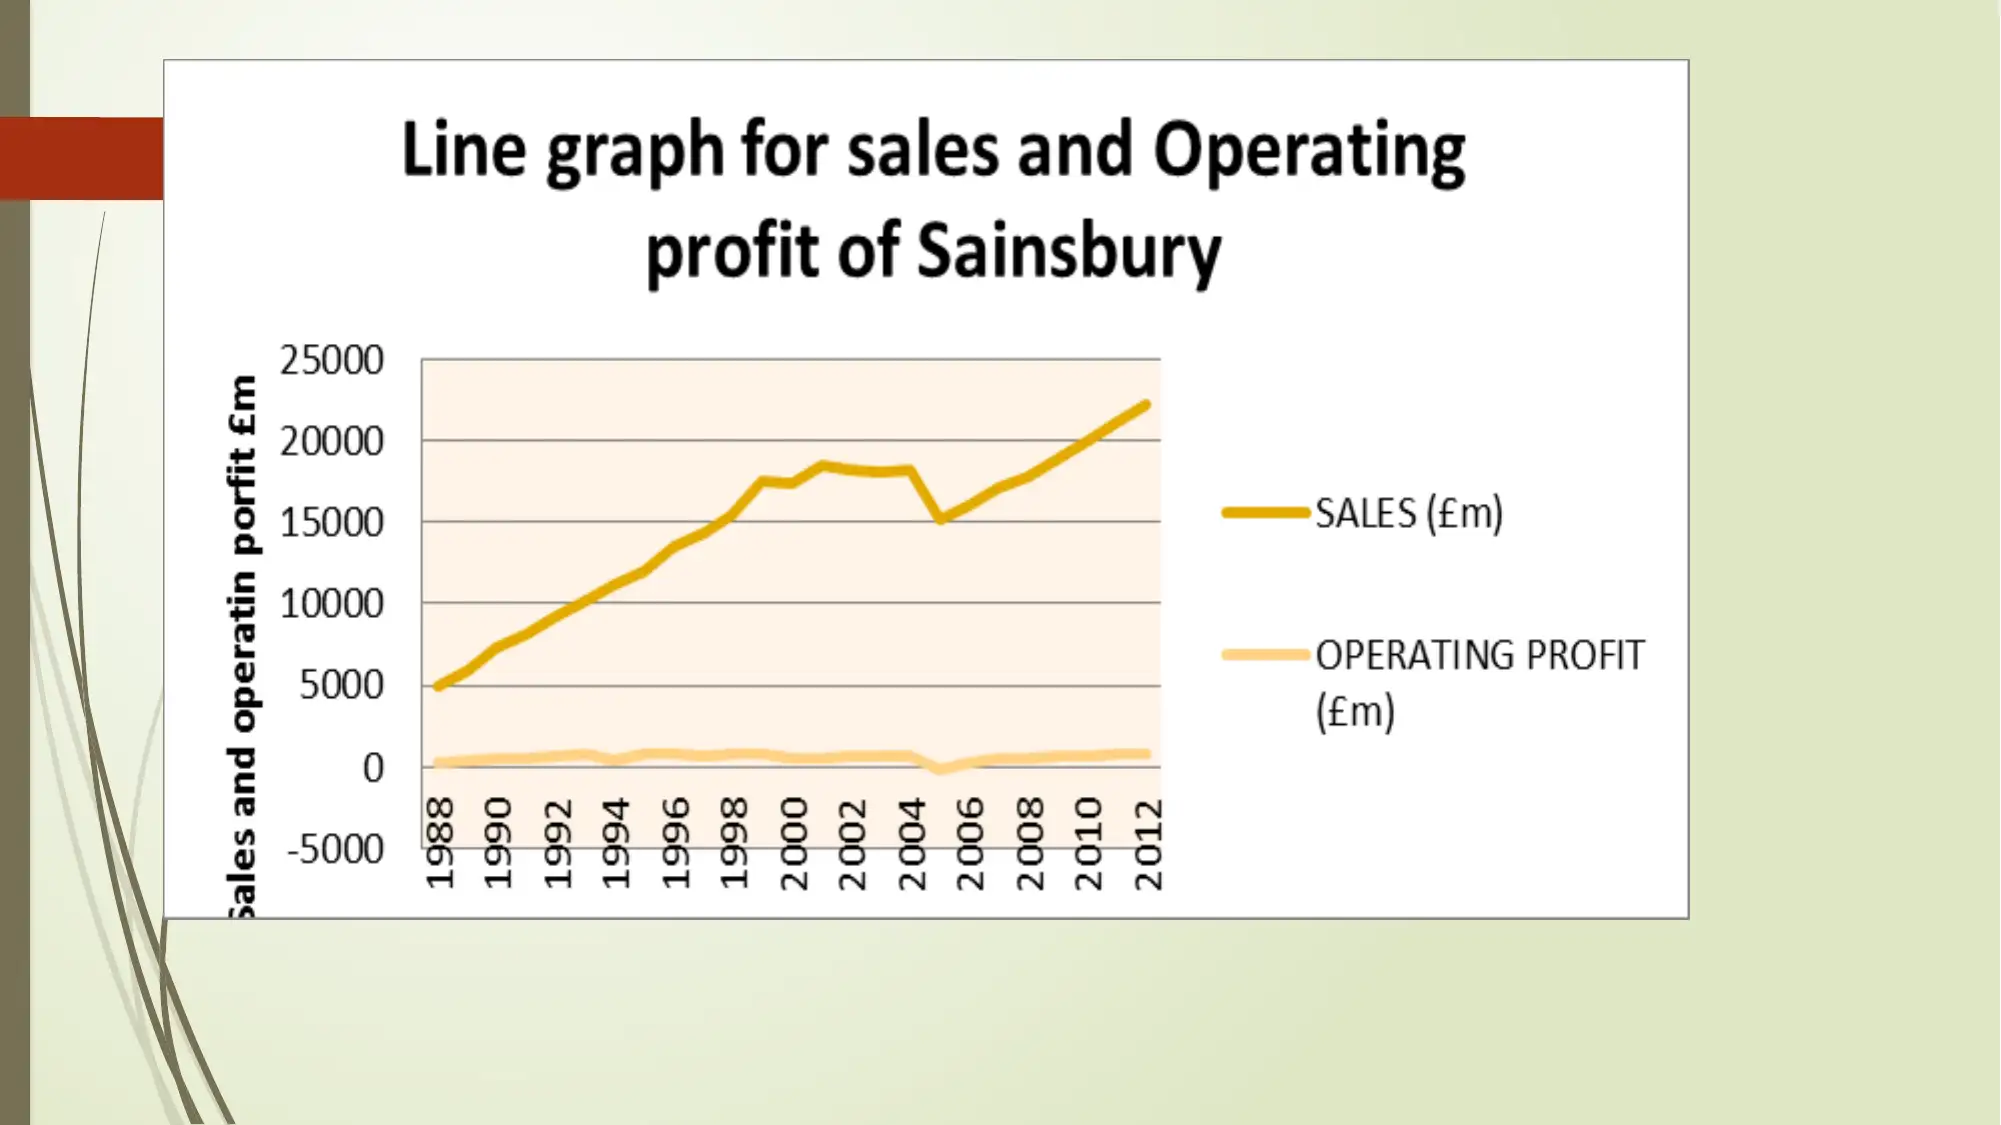
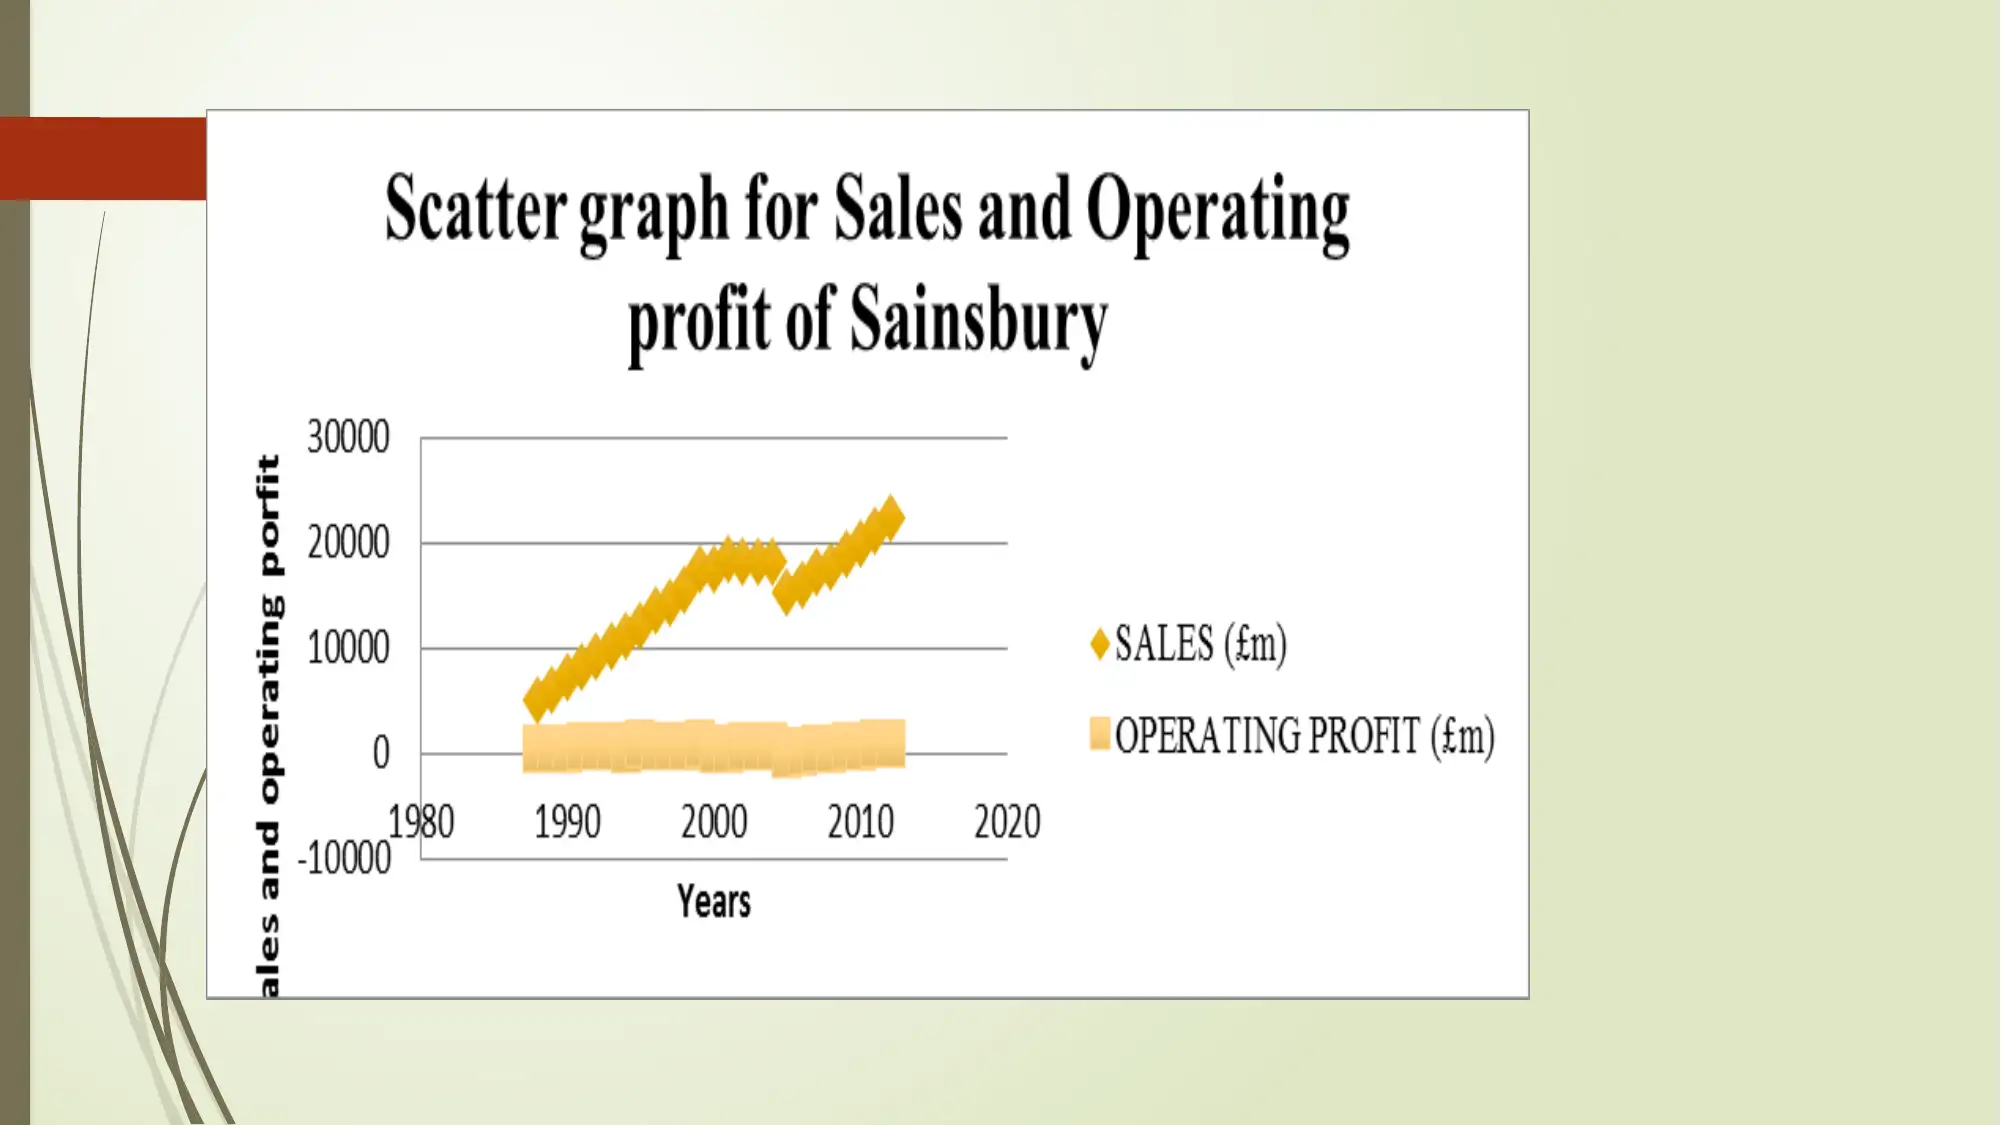
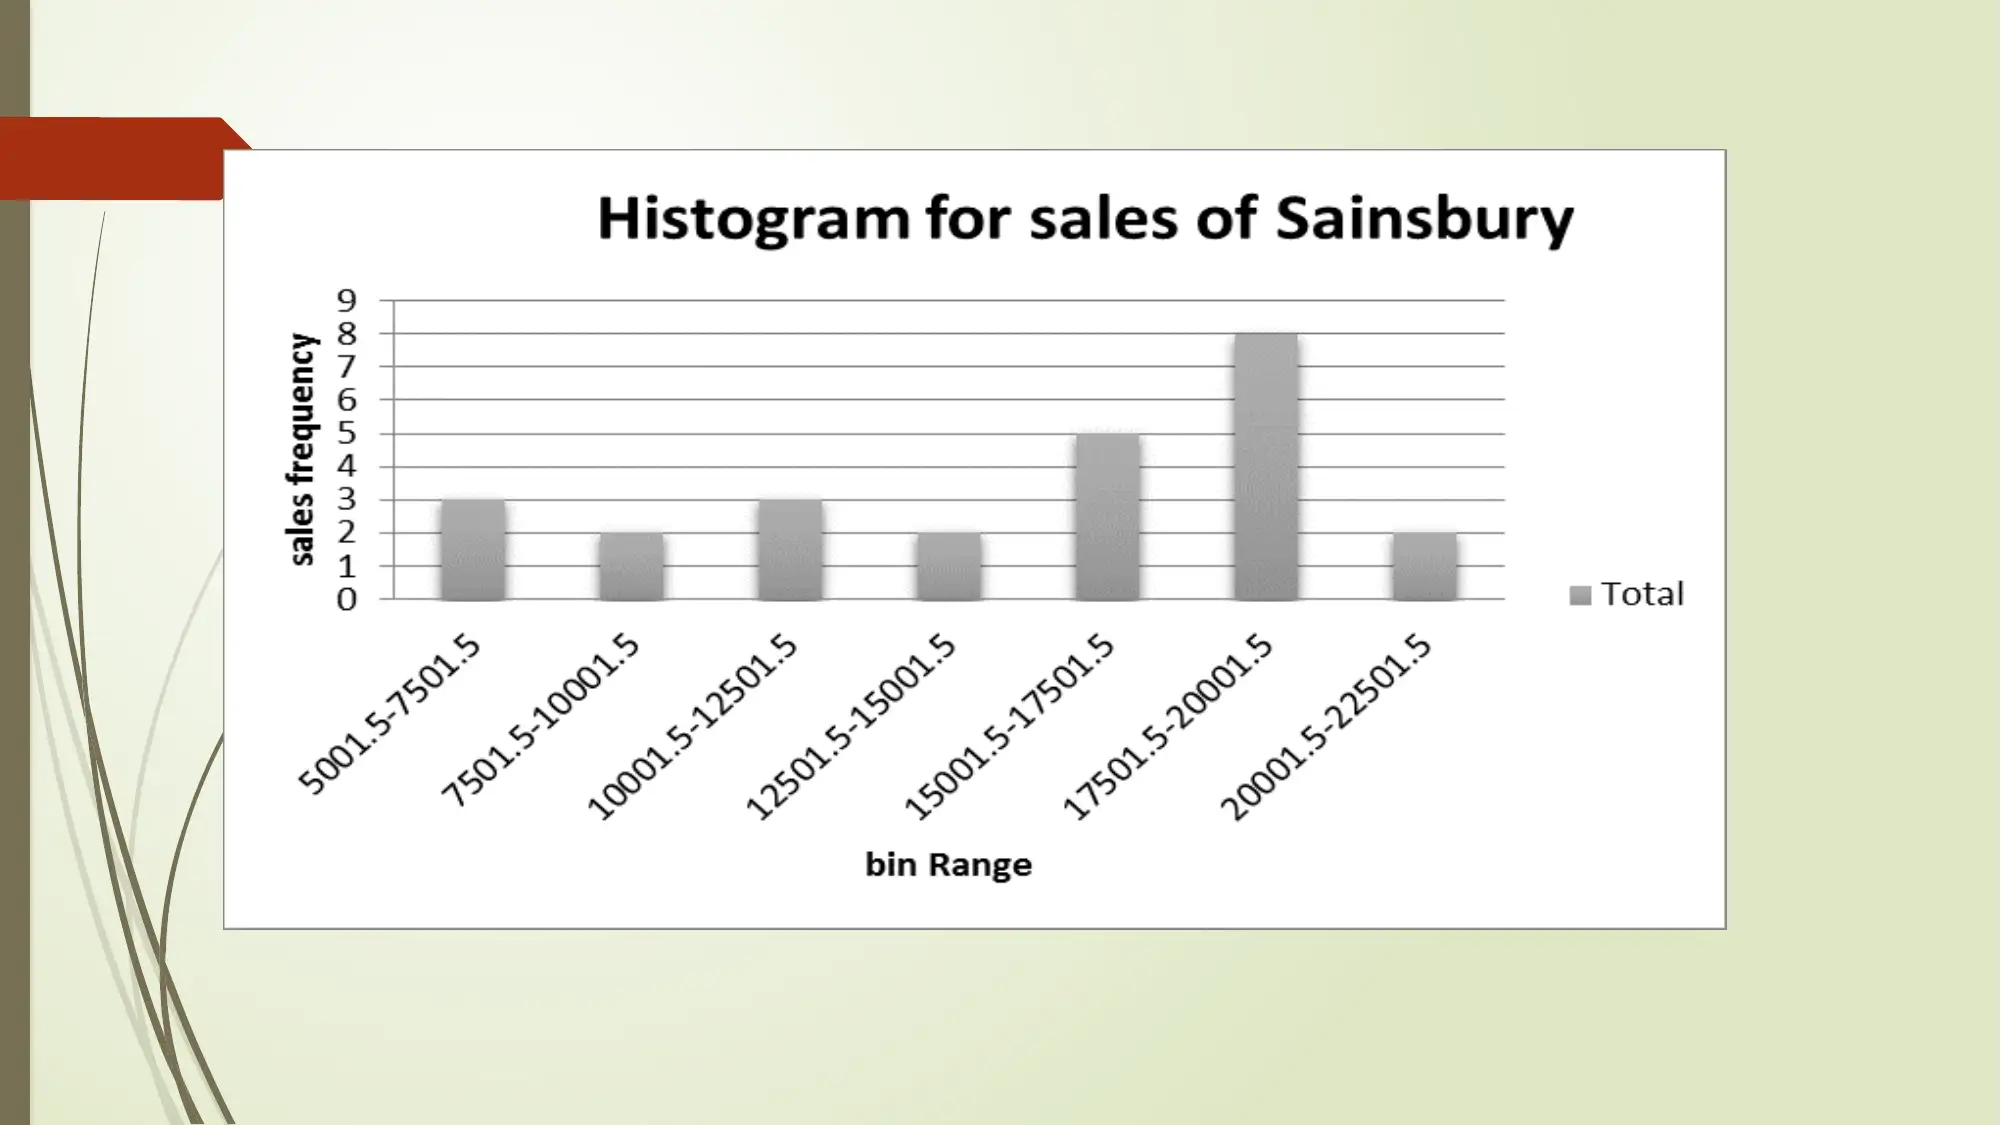
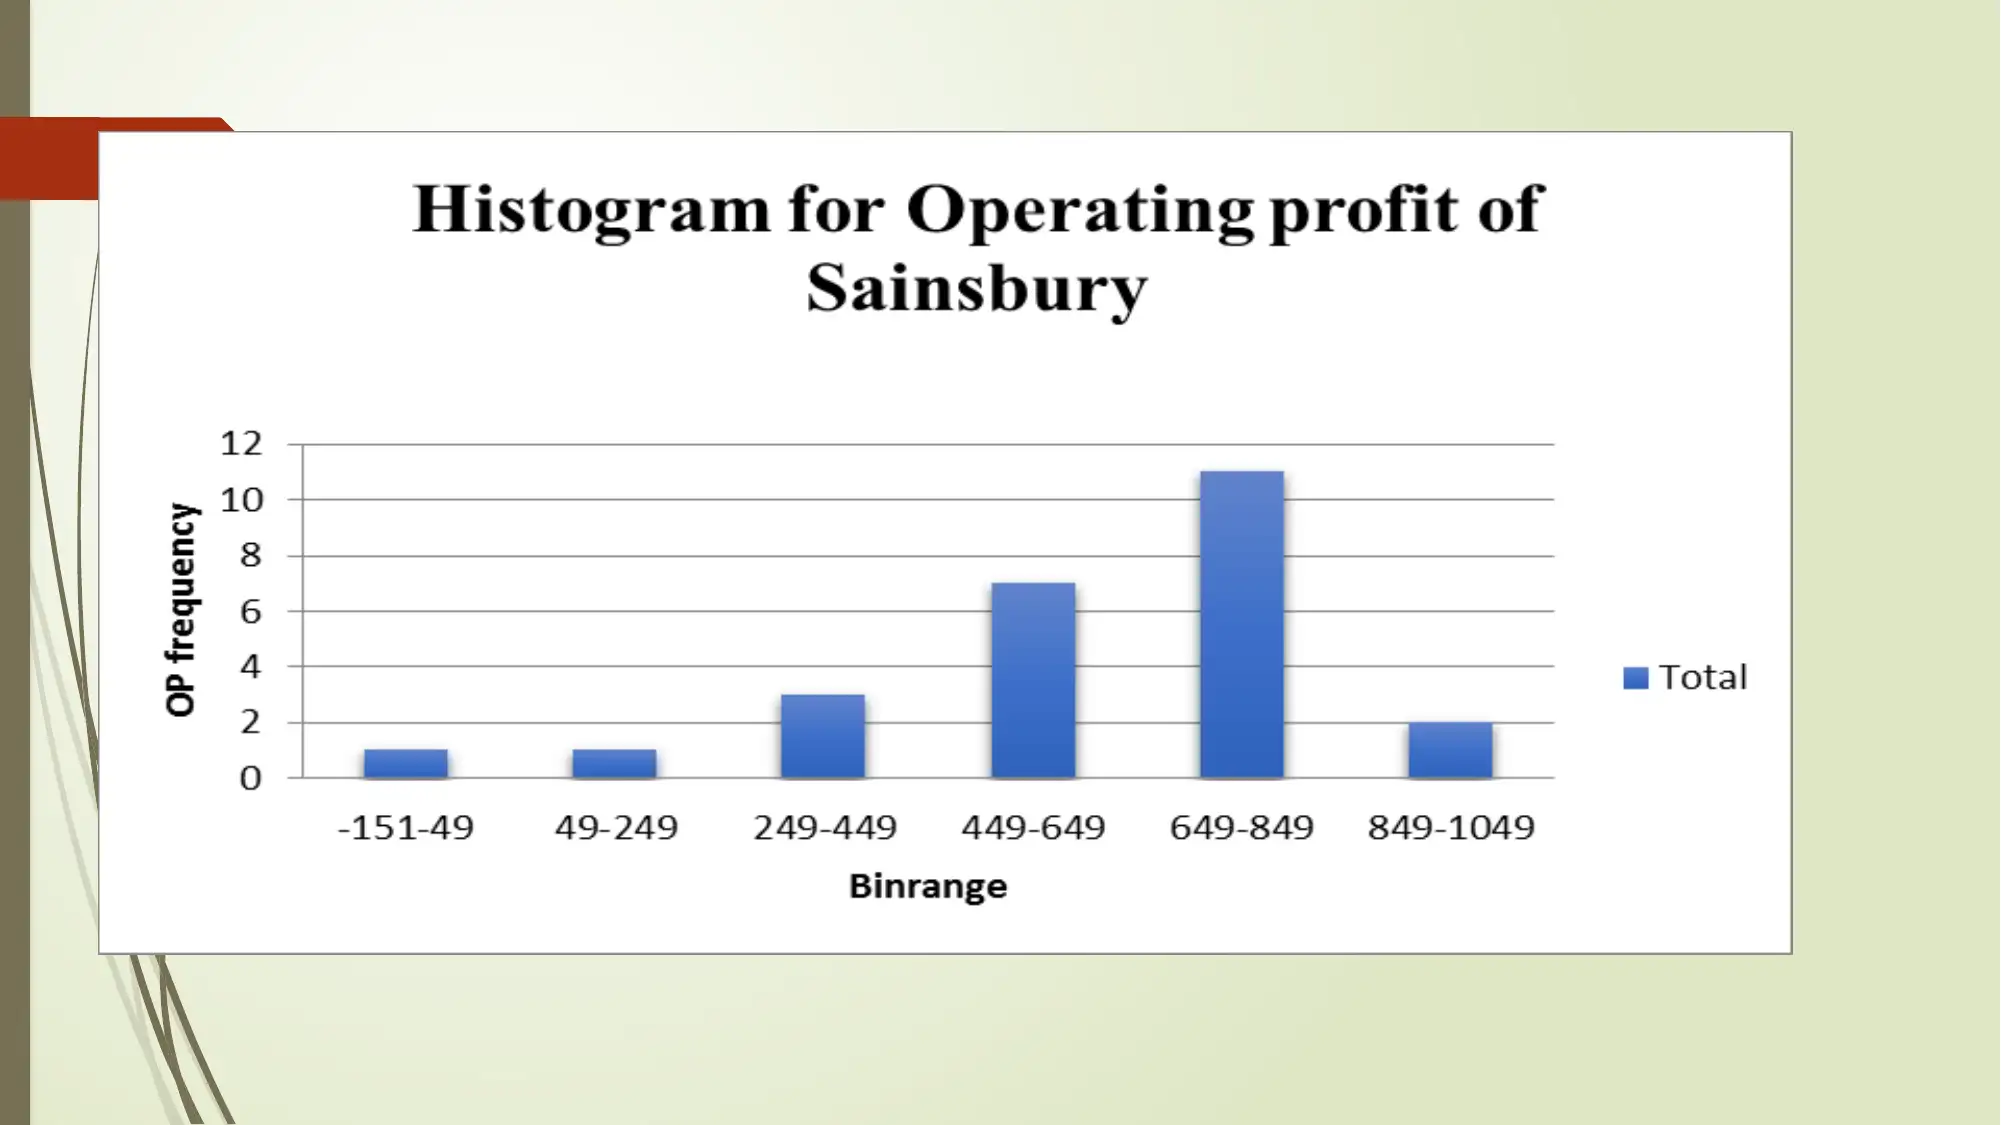
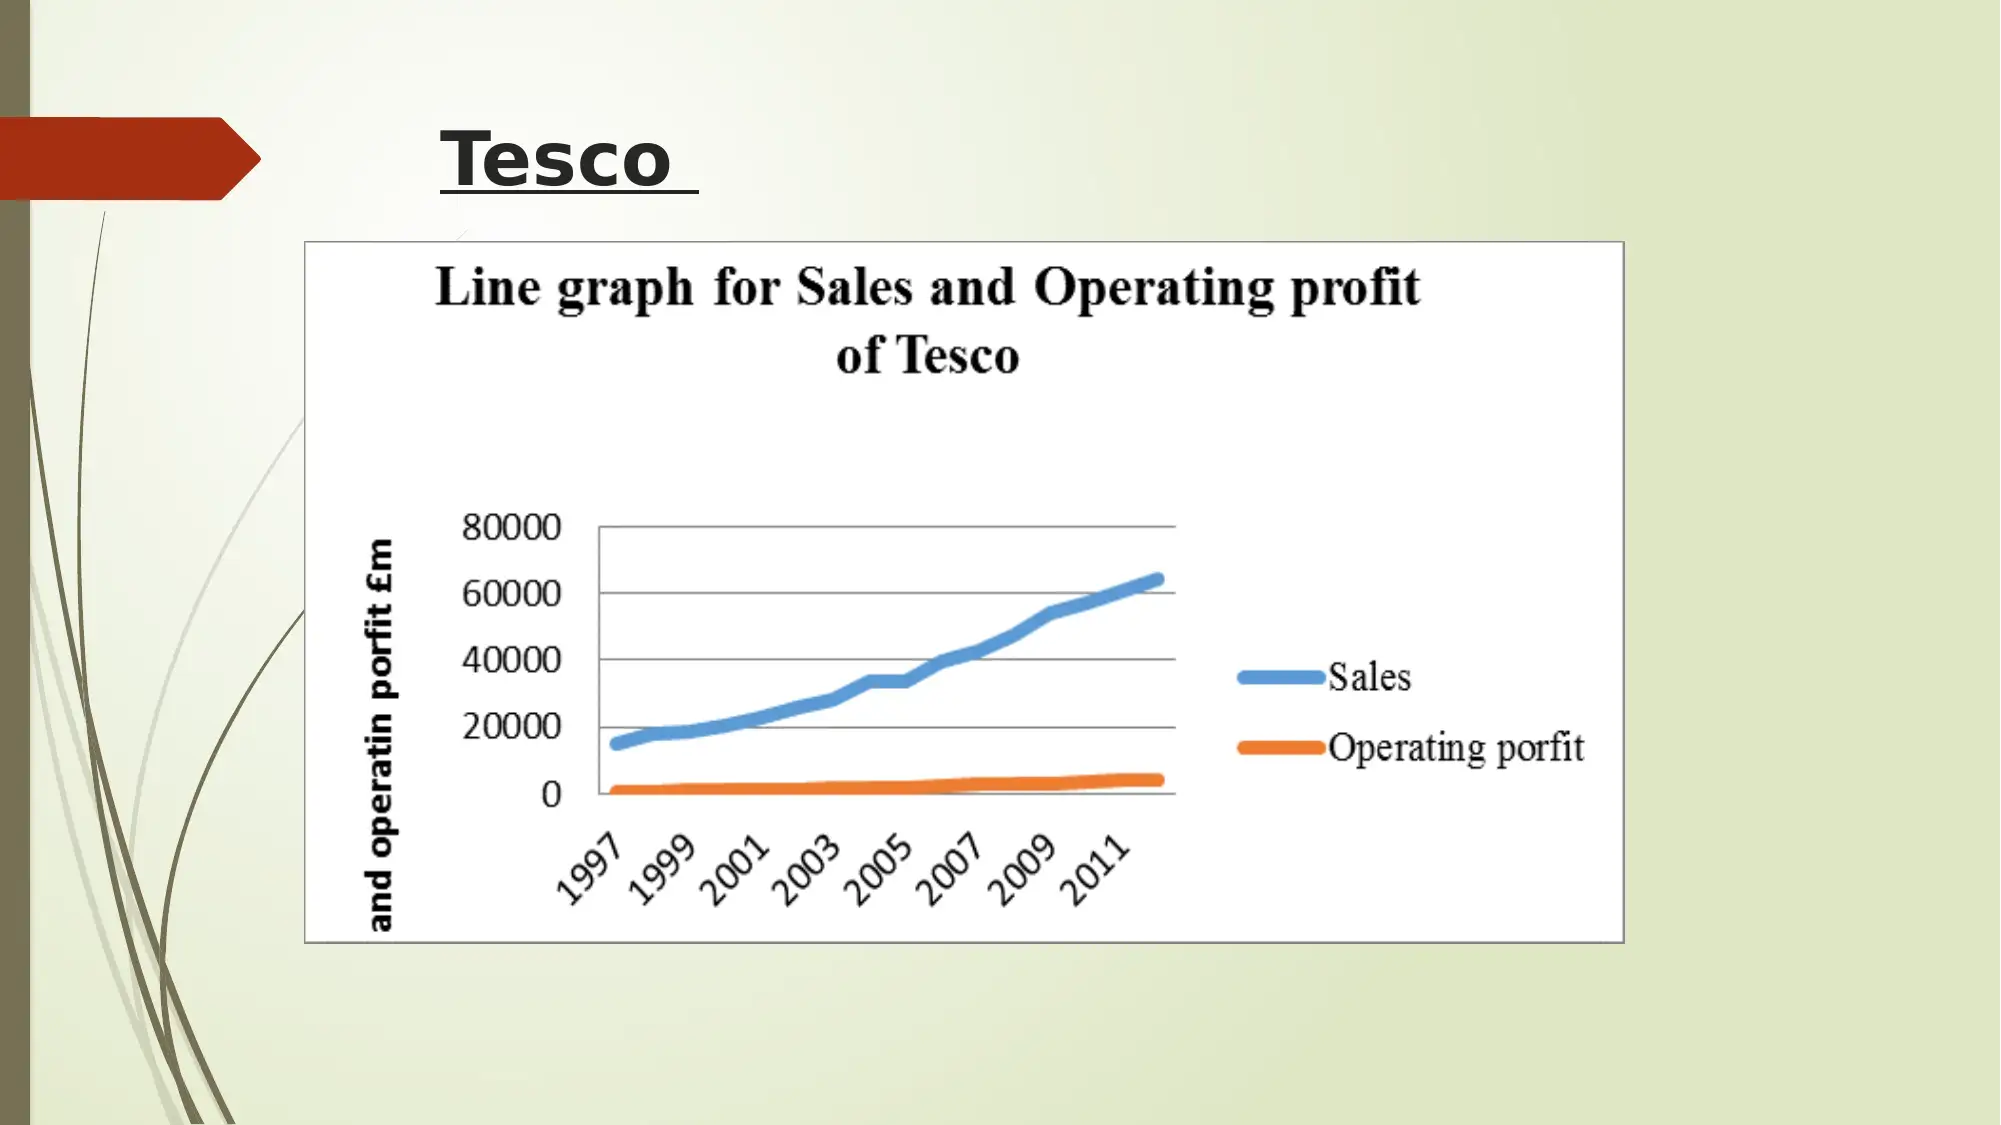
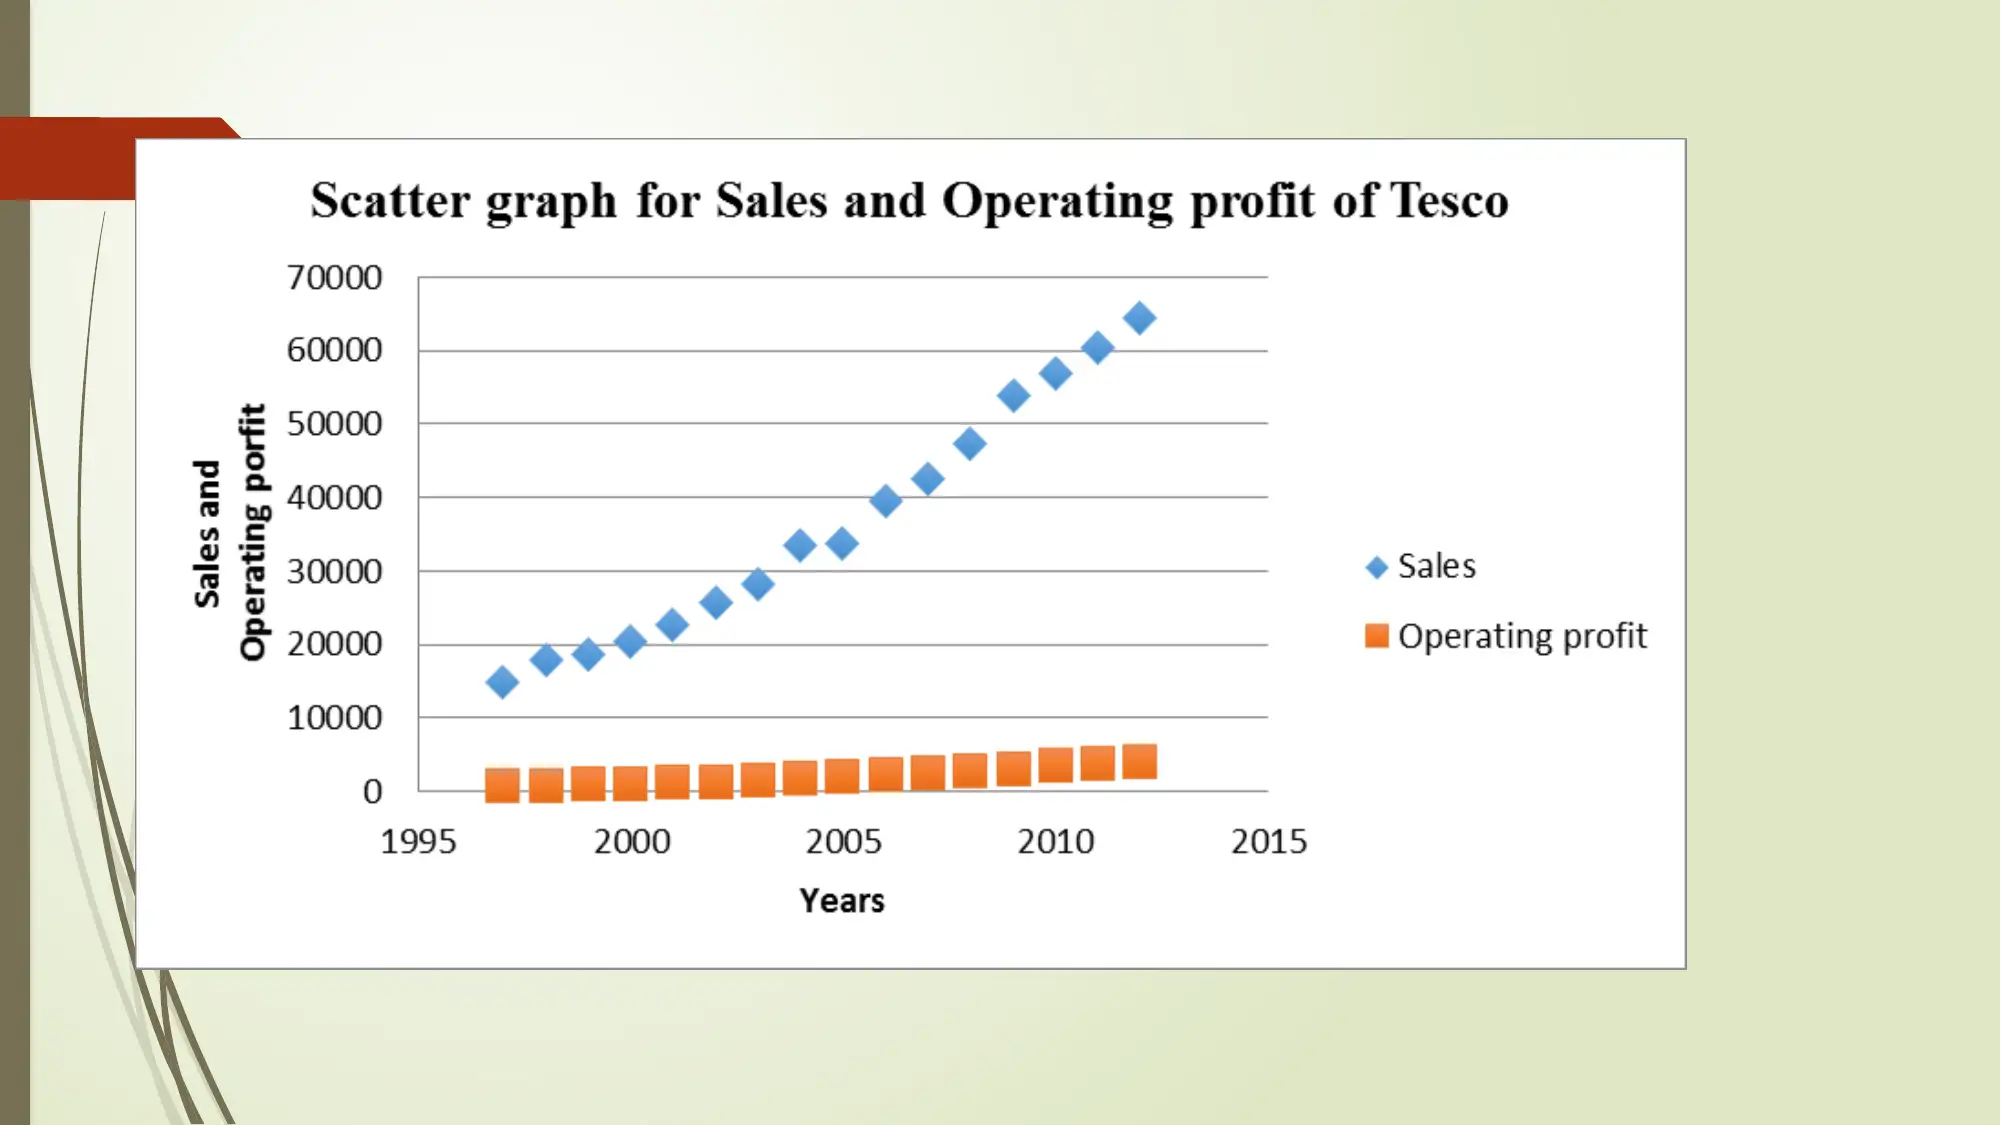
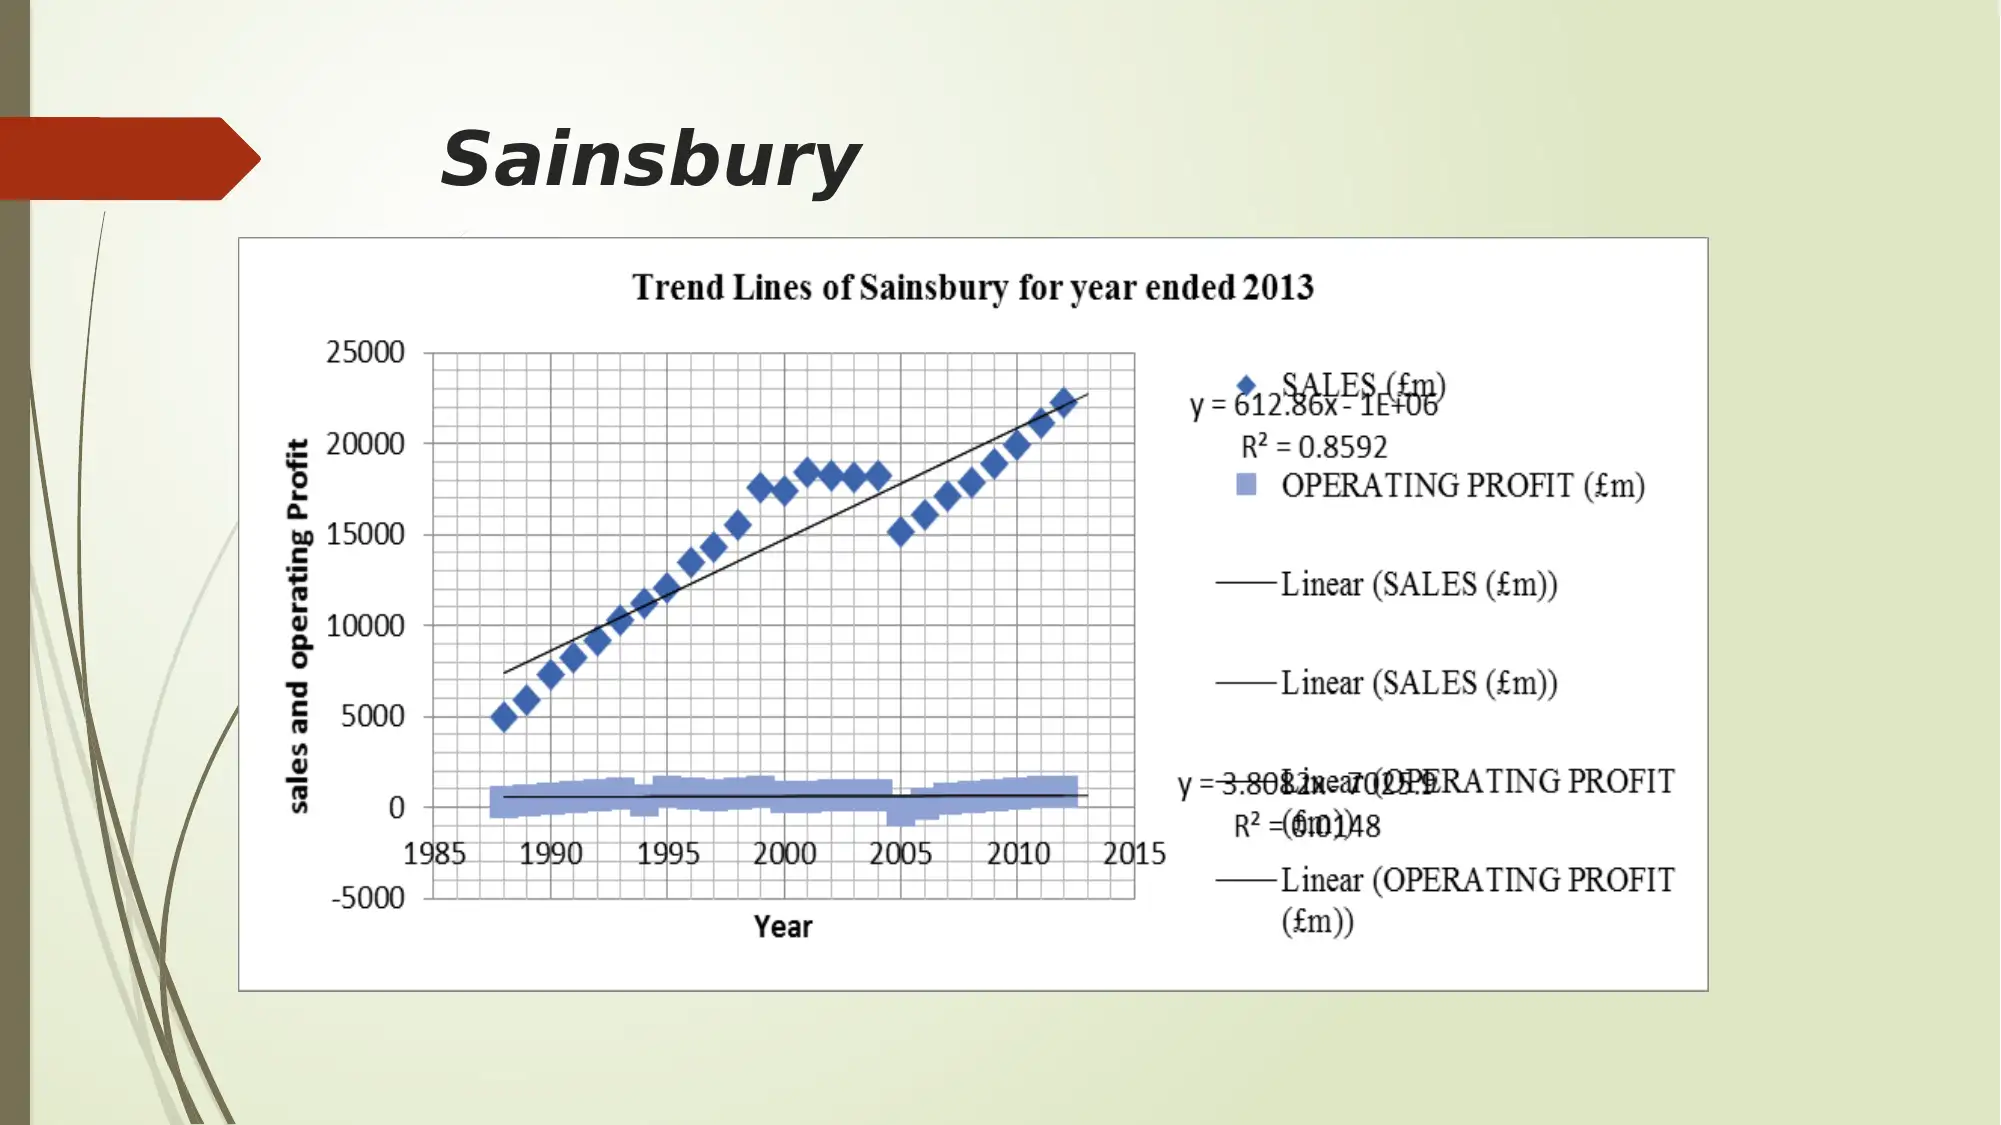
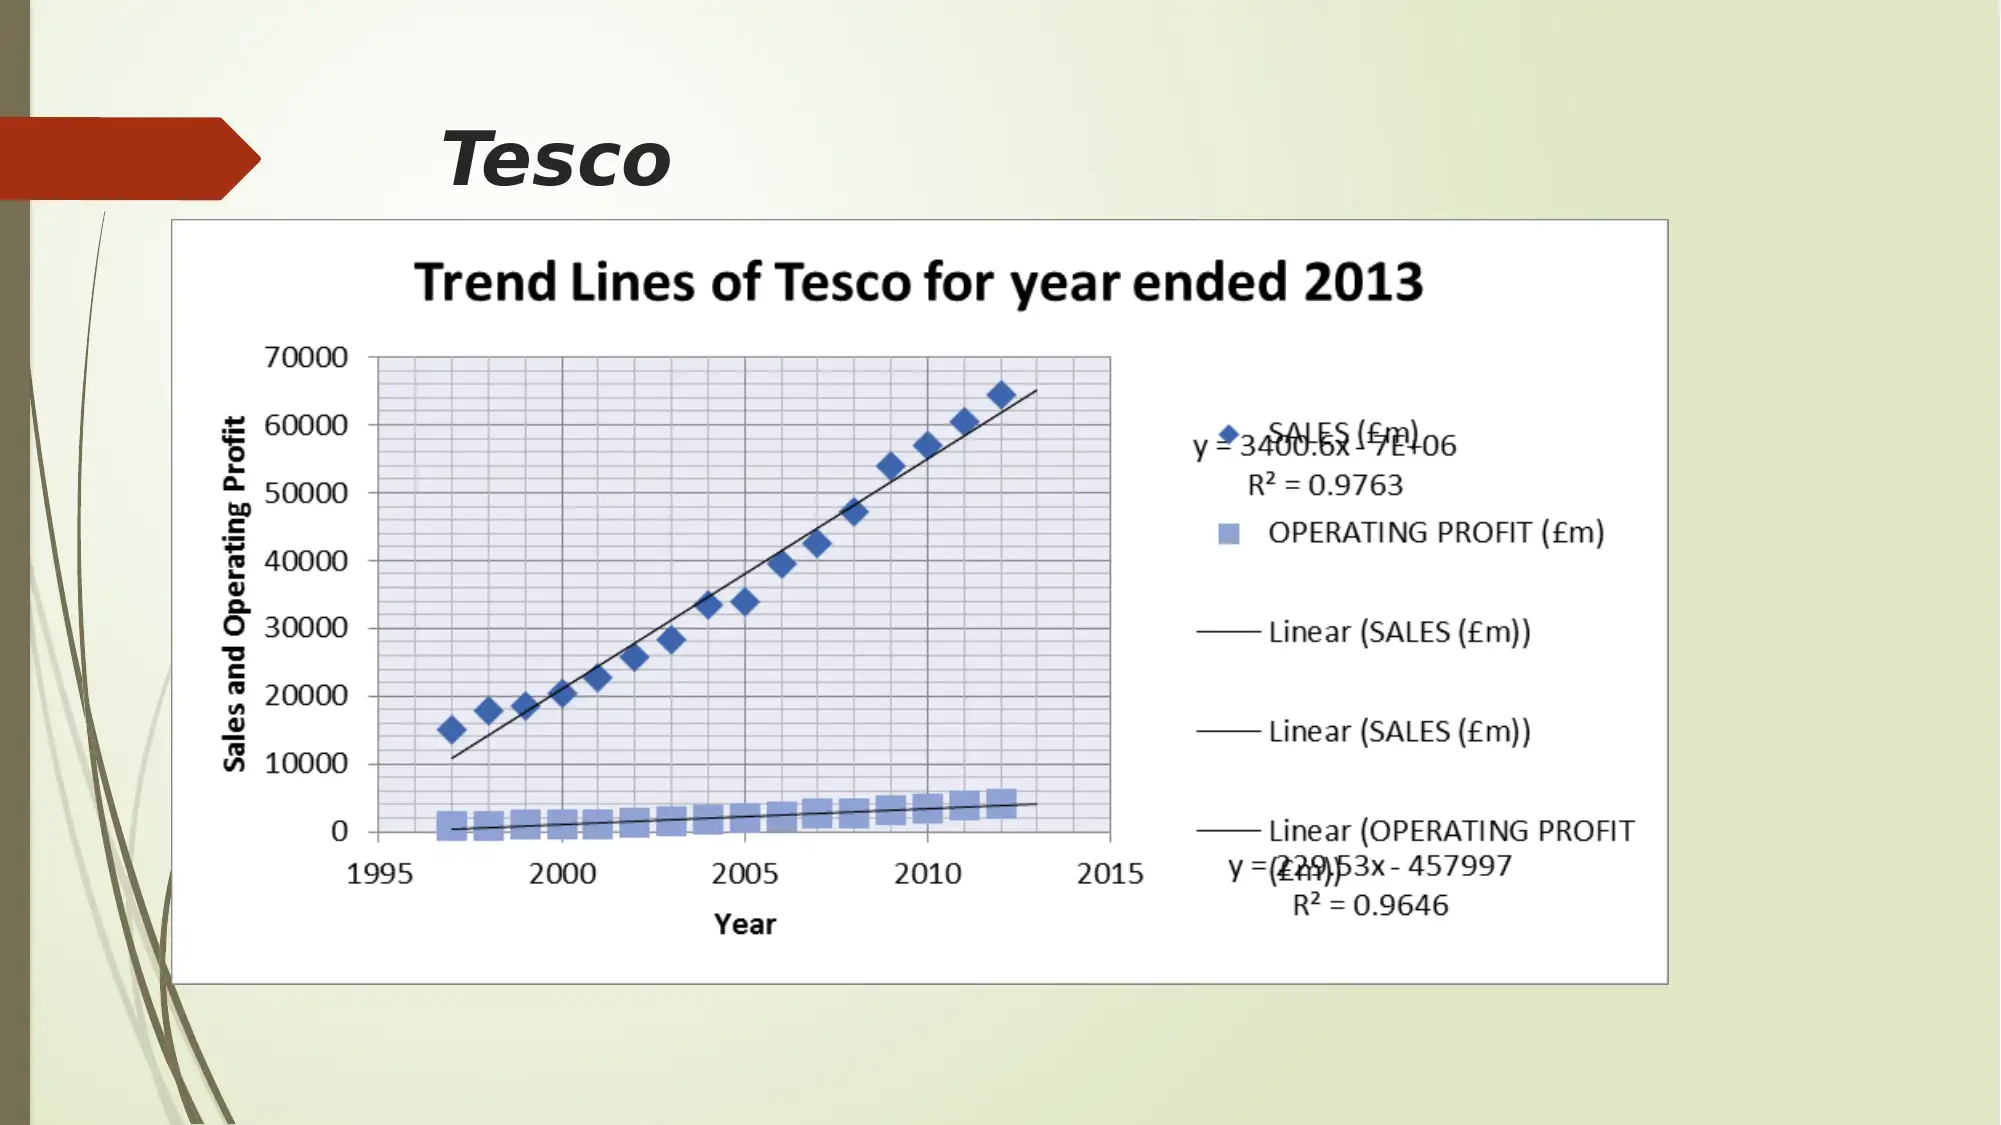
This report presents an analysis of Sainsbury's performance over a period of time, focusing on customer satisfaction, financial data, and market position. The report utilizes both primary and secondary data, including customer feedback and financial statements. Statistical tools such as means of central tendency, measures of dispersion, and correlation coefficients are employed to analyze the data and draw conclusions. The findings indicate that Sainsbury may not have a satisfactory image among customers, and while both Sainsbury and Tesco are experiencing growth, Tesco is outperforming Sainsbury in terms of sales and profits. Despite the high standard deviation suggesting uncertainty in future sales and profits, the report concludes that Sainsbury has the potential to improve its performance by focusing on its products and services. The report also includes references to relevant academic sources.
tabler-icon-diamond-filled.svg

Contribute Materials

Your contribution can guide someone’s learning journey. Share your documents today.
Document Page
TASK 3.3 PPT
tabler-icon-diamond-filled.svg

Secure Best Marks with AI Grader

Need help grading? Try our AI Grader for instant feedback on your assignments.
Document Page
Introduction
This report outlines the performances and accomplishments of
Sainsbury in past 16 years using graphs and tables. This report is meant
to check the reliability of the statements made by the company
regarding its hold over market. The main aim is to find out the answers
for the following research questions:
Whether customers are satisfied from the Sainsbury’s products and
services or not?
What is the relationship between sales and operating in case of
Sainsbury?
Document Page
Methodology
Primary data is collected through the questionnaire prepared to get the
feedback from customers.
Secondary data is collected from the market reports, financial
statements and the Annual report of the organisation (Nowduri, 2015).
The statistical tools used are Means of Central tendency, measures of
dispersion and correlation coefficient.
The obtained results are depicted through Graph, tables and Charts.
Document Page
tabler-icon-diamond-filled.svg

Secure Best Marks with AI Grader

Need help grading? Try our AI Grader for instant feedback on your assignments.
Document Page
Document Page
Document Page
tabler-icon-diamond-filled.svg

Paraphrase This Document

Need a fresh take? Get an instant paraphrase of this document with our AI Paraphraser
Document Page
Tesco
Document Page
Document Page
Sainsbury
tabler-icon-diamond-filled.svg

Secure Best Marks with AI Grader

Need help grading? Try our AI Grader for instant feedback on your assignments.
Document Page
Tesco
Document Page
Findings
With the above analysis it can be inferred that Sainsbury does not have
satisfactory image on customers.
Customers in the retail industry are more price conscious and sensitive
Data analysis of Sainsbury and Tesco depicts that though both the
companies are experiencing profits and growth, Tesco is outperforming
Sainsbury with good margin.
Due to high value of standard deviation of both the cited organizations
future sales and profit cannot be predicted.
Sainsbury have good possibility of performing well in future.
Document Page
Conclusion
It can be concluded that Sainsbury need to work on it products and
services. Tesco is surpassing the company in terms of sales and profits.
tabler-icon-diamond-filled.svg

Paraphrase This Document

Need a fresh take? Get an instant paraphrase of this document with our AI Paraphraser
Document Page
References
Ferrell, C. O., Fraedrich, J. and Ferrell. 2014. Business Ethics: Ethical Decision Making &
Cases.10th ED. Cengage Learning.
Kimmel, D. P., Weygandt, J. J. and Kieso, E. D., 2010. Accounting: Tools for Business Decision
Makers. 4th ED. John Wiley & Sons.
Beynon-Davies, P., 2009. Business Information Systems. Palgrave Macmillan.
Christiansen, K. J. and Varnes, C., 2008. From models to practice: decision making at
portfolio meetings. International Journal of Quality & Reliability Management. 25(1).pp.87 –
101.
Cohen, J. and et. al., 2013. Applied Multiple Regression/ Correlation Analysis for the
Behavioral Sciences. Routledge.
Popovich, S., 2014. 6 Secrets to Making Business Decisions That Get Results [ONLINE].
Available through: <http://www.entrepreneur.com/article/237562>. [Accessed on 6th Feb
2016].
chevron_up_icon
1 out of 14
circle_padding
hide_on_mobile
zoom_out_icon
logo.png

Your All-in-One AI-Powered Toolkit for Academic Success.

Available 24*7 on WhatsApp / Email

[object Object]