Sainsbury's Data Analysis: Spreadsheet and Formula Usage for Sales

Verified

Added on  2021/02/20

|7
|316
|50
Homework Assignment
AI Summary
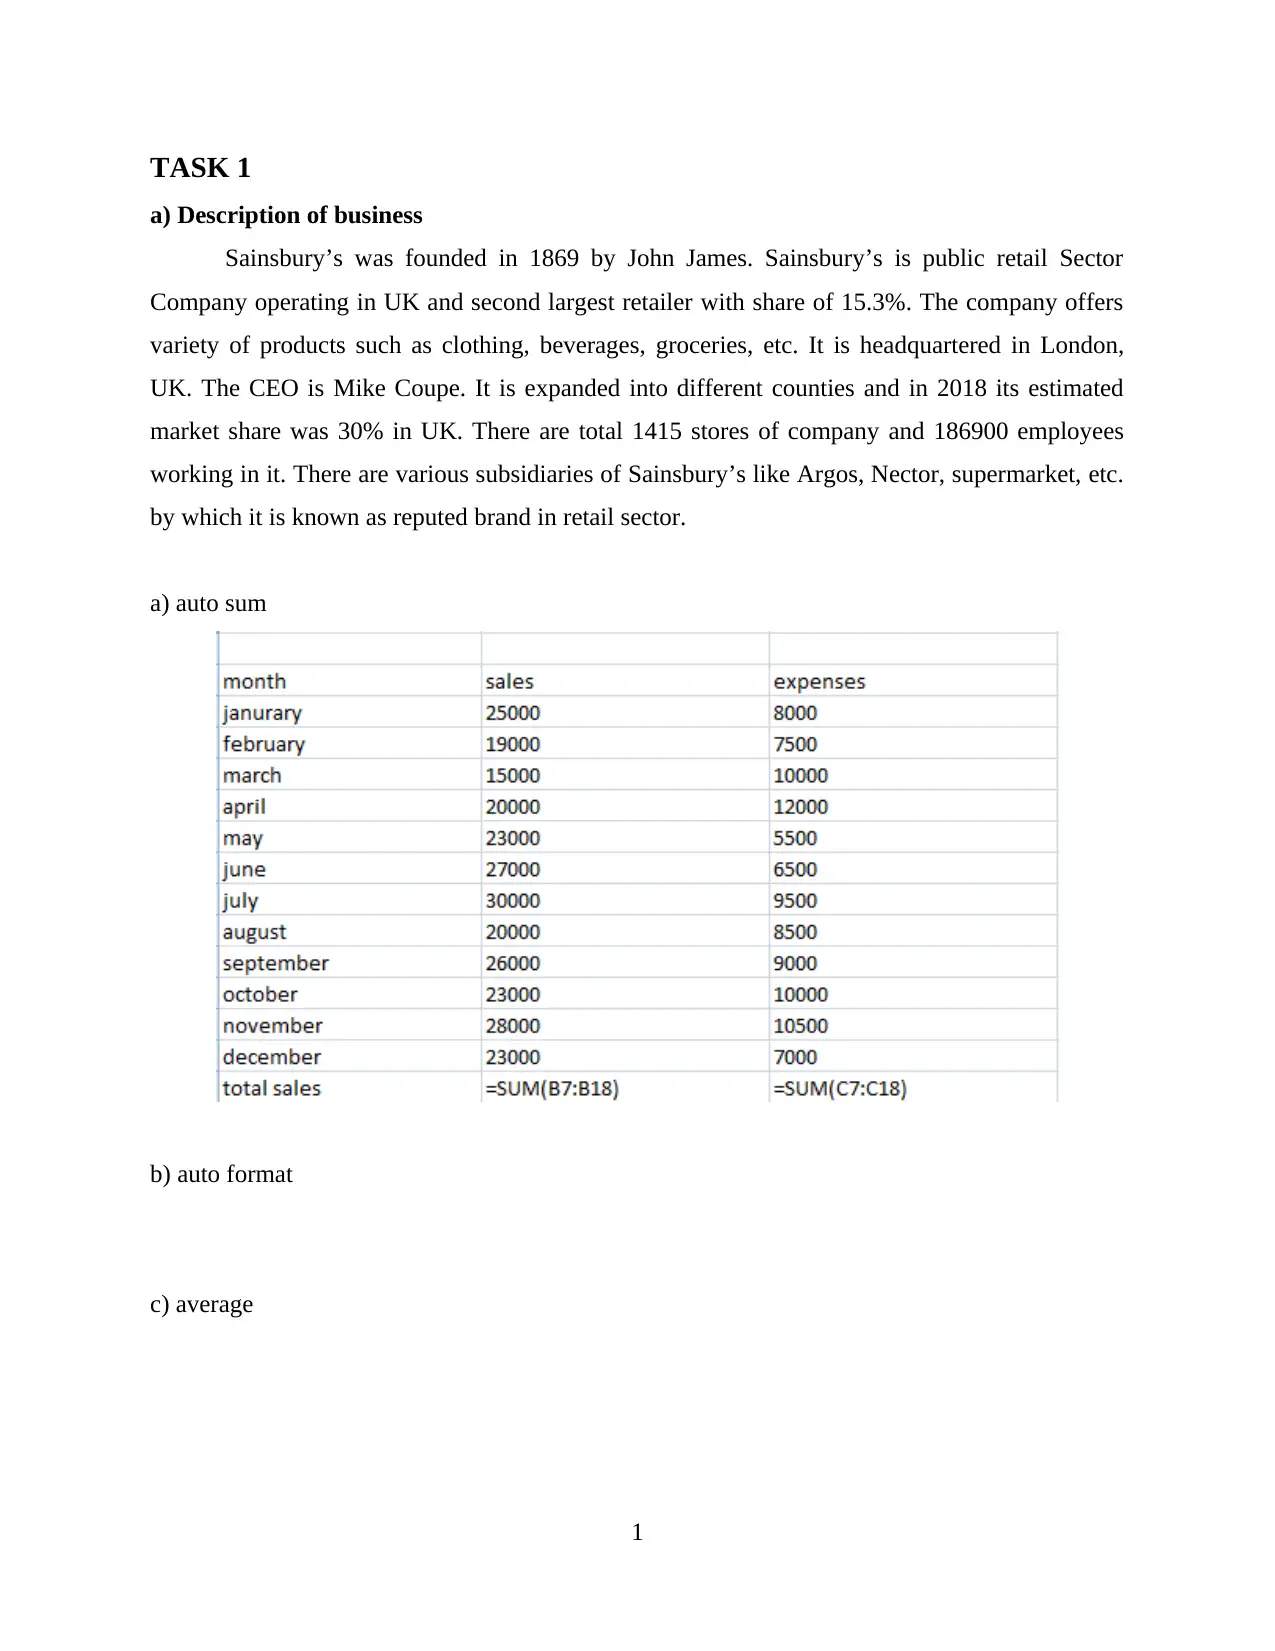
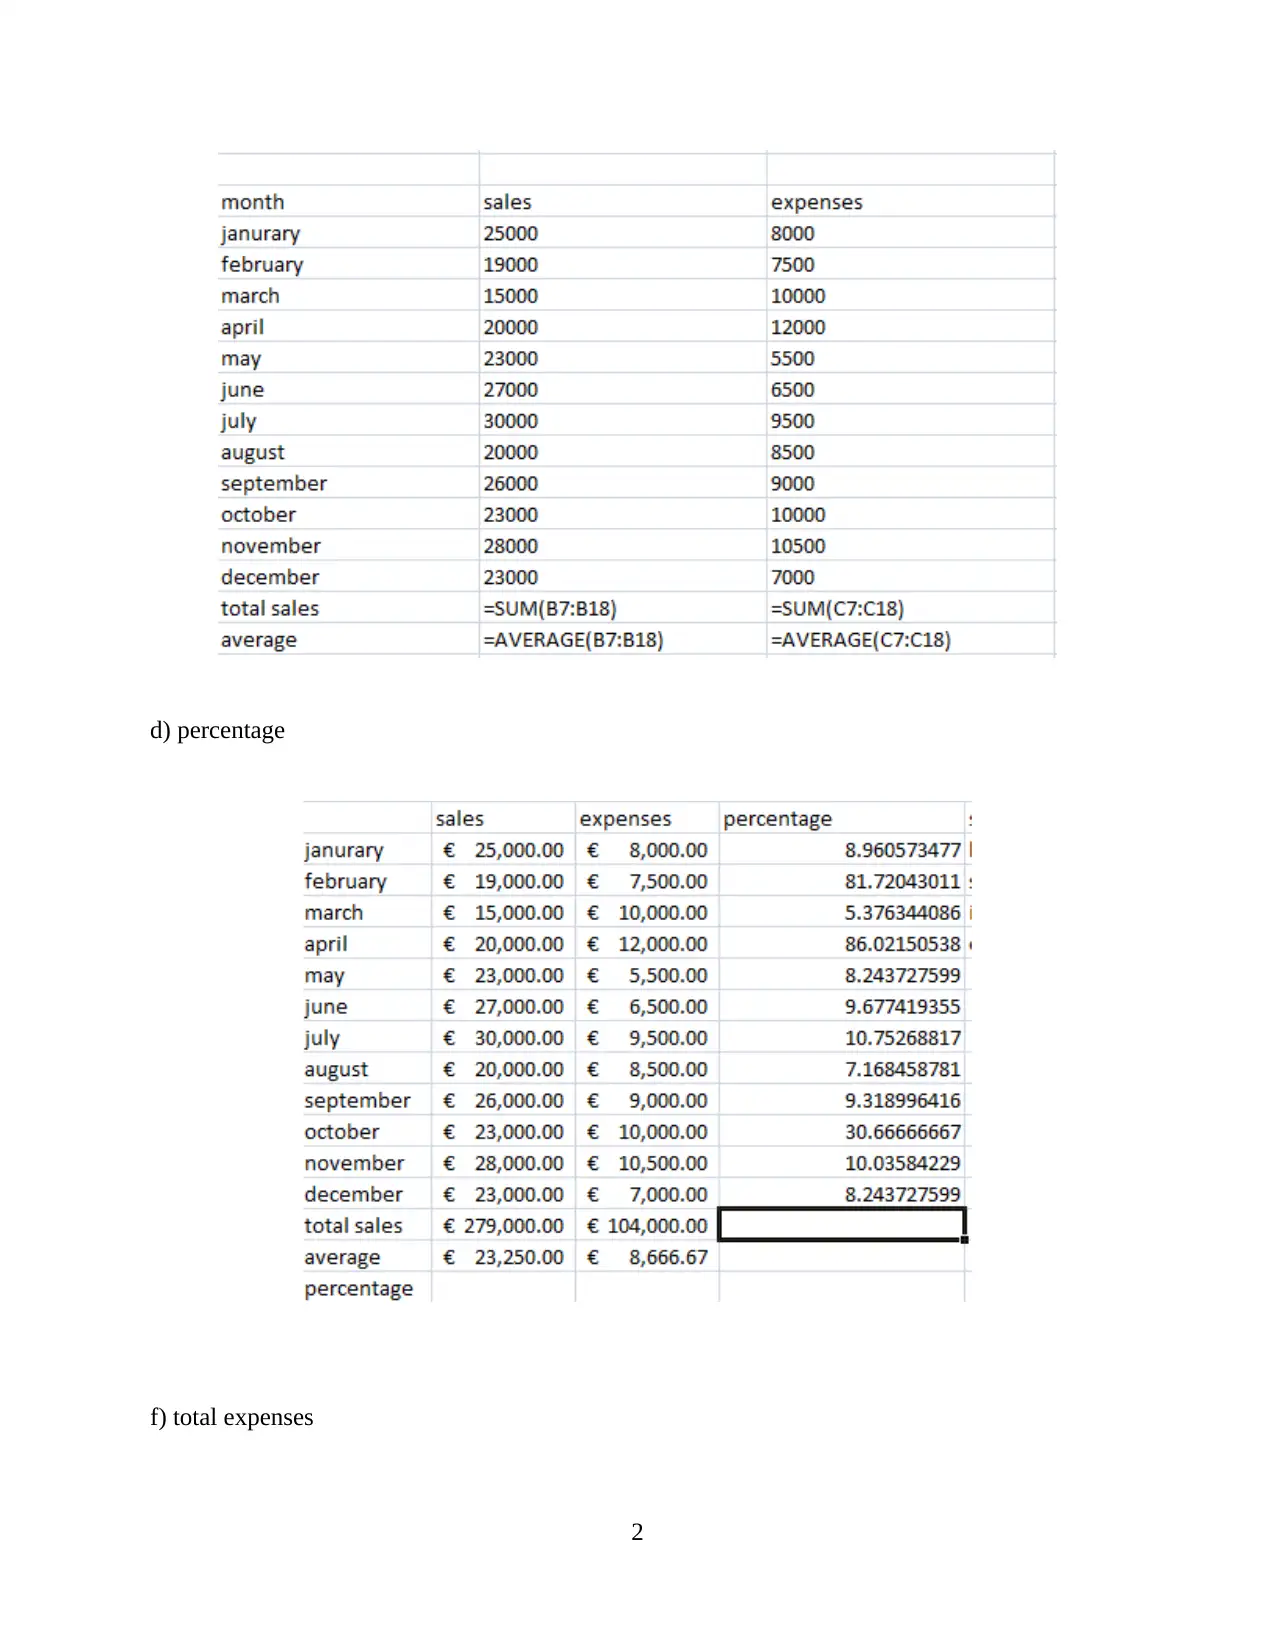
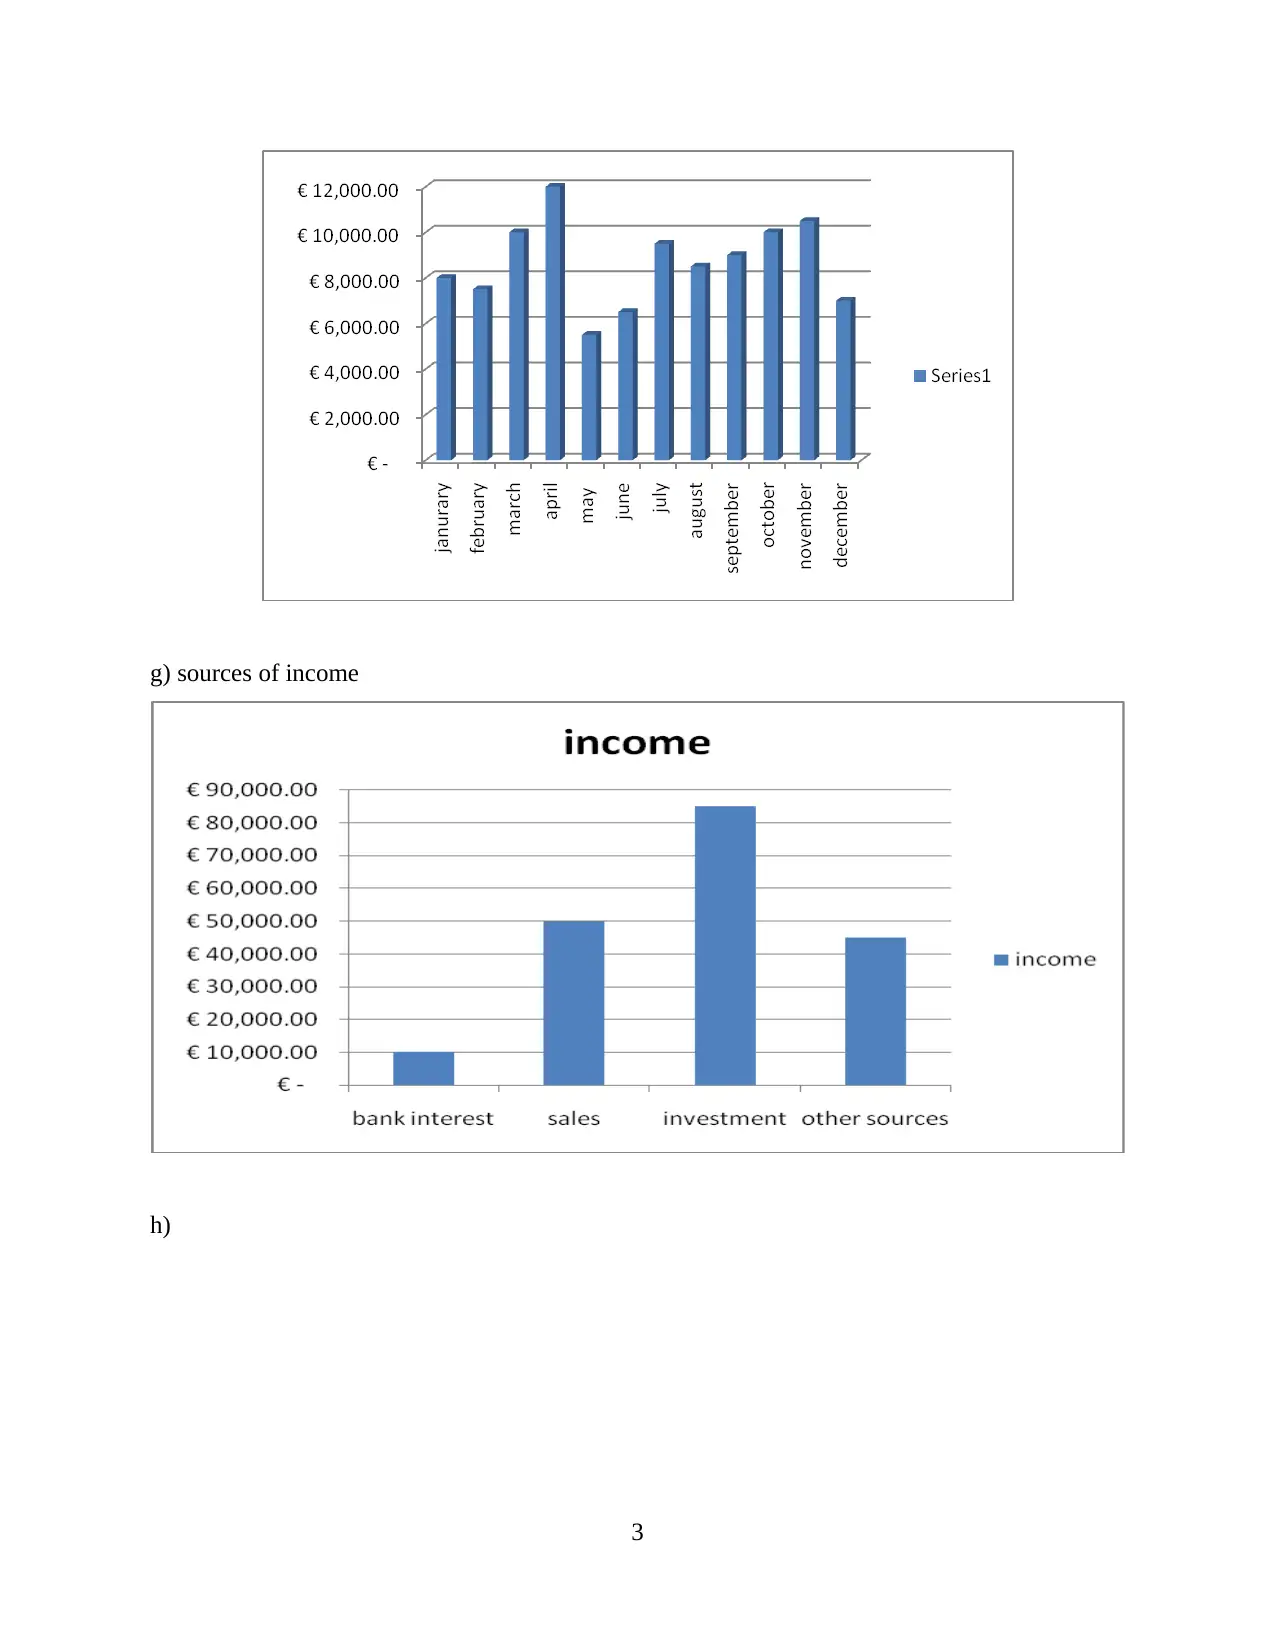
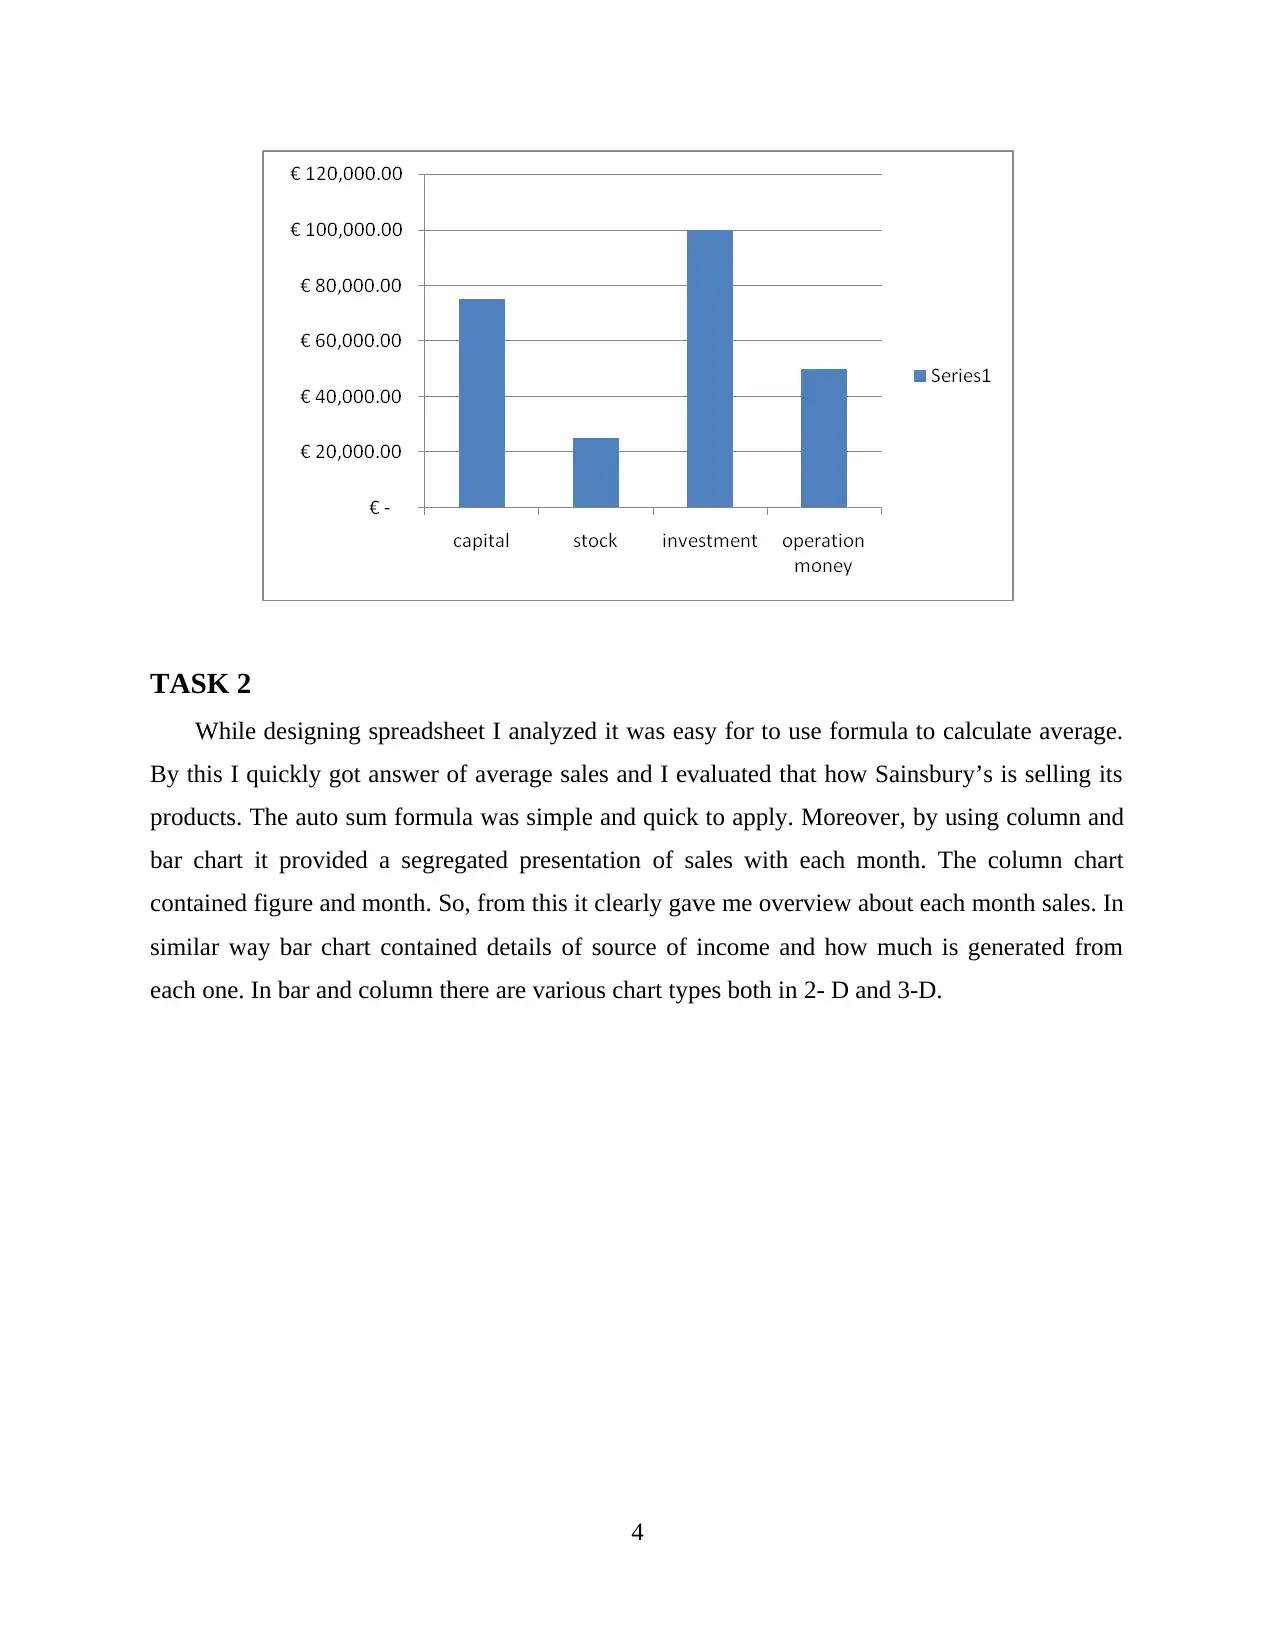
This assignment focuses on analyzing Sainsbury's data using spreadsheets and formulas. The student utilized spreadsheet software to analyze sales data, calculate averages, and visualize the data through charts. The student employed the auto sum function for calculations and created column and bar charts to represent sales figures and sources of income. The assignment demonstrates the application of spreadsheet tools for data analysis, highlighting the ease of use and the ability to generate insights into business performance. The student also discusses the advantages of using different chart types to present the data effectively, providing a comprehensive overview of the sales data.
tabler-icon-diamond-filled.svg

Contribute Materials

Your contribution can guide someone’s learning journey. Share your documents today.
Document Page
DATA HANDLING AND
USING ICT
tabler-icon-diamond-filled.svg

Secure Best Marks with AI Grader

Need help grading? Try our AI Grader for instant feedback on your assignments.
Document Page
Table of Contents
TASK 1............................................................................................................................................1
TASK 2............................................................................................................................................4
Document Page
TASK 1
a) Description of business
Sainsbury’s was founded in 1869 by John James. Sainsbury’s is public retail Sector
Company operating in UK and second largest retailer with share of 15.3%. The company offers
variety of products such as clothing, beverages, groceries, etc. It is headquartered in London,
UK. The CEO is Mike Coupe. It is expanded into different counties and in 2018 its estimated
market share was 30% in UK. There are total 1415 stores of company and 186900 employees
working in it. There are various subsidiaries of Sainsbury’s like Argos, Nector, supermarket, etc.
by which it is known as reputed brand in retail sector.
a) auto sum
b) auto format
c) average
1
Document Page
d) percentage
f) total expenses
2
tabler-icon-diamond-filled.svg

Secure Best Marks with AI Grader

Need help grading? Try our AI Grader for instant feedback on your assignments.
Document Page
g) sources of income
h)
3
Document Page
TASK 2
While designing spreadsheet I analyzed it was easy for to use formula to calculate average.
By this I quickly got answer of average sales and I evaluated that how Sainsbury’s is selling its
products. The auto sum formula was simple and quick to apply. Moreover, by using column and
bar chart it provided a segregated presentation of sales with each month. The column chart
contained figure and month. So, from this it clearly gave me overview about each month sales. In
similar way bar chart contained details of source of income and how much is generated from
each one. In bar and column there are various chart types both in 2- D and 3-D.
4
Document Page
5
chevron_up_icon
1 out of 7
circle_padding
hide_on_mobile
zoom_out_icon
logo.png

Your All-in-One AI-Powered Toolkit for Academic Success.

Available 24*7 on WhatsApp / Email

[object Object]