Analyzing Sainsbury's Business Decisions and Financial Performance
VerifiedAdded on 2019/12/03
|23
|5100
|403
Report
AI Summary
This report provides a comprehensive analysis of Sainsbury's business decision-making processes. It begins with an introduction to the importance of strategic decision-making in business, followed by an examination of data collection methods, including both primary (surveys) and secondary research. The report details the survey methodology, sampling frame, and questionnaire design used to gather customer insights. The analysis then delves into statistical analysis of key financial data, such as sales, profit before tax, and earnings per share, including descriptive statistics like mean, standard deviation, and variance. Further, the report explores the use of statistical graphs and trend lines to visualize data, along with a formal business report and an in-depth look at the Internal Rate of Return (IRR) calculation for investment projects. The conclusion summarizes the findings and emphasizes the significance of informed decision-making for Sainsbury's success.

BUSINESS
DECISION MAKING
DECISION MAKING
Paraphrase This Document
Need a fresh take? Get an instant paraphrase of this document with our AI Paraphraser
TABLE OF CONTENTS
INTRODUCTION...........................................................................................................................4
TASK 1............................................................................................................................................4
1.1 Planning for collection of data...............................................................................................4
1.2 Stating the survey methodology and sampling frame used by the researcher.......................5
1.3 Designing of questionnaire....................................................................................................6
TASK 2............................................................................................................................................7
2.1: Statistical Analysis................................................................................................................7
2.2: Percentile............................................................................................................................11
2.3: Correlation coefficient........................................................................................................13
TASK 3..........................................................................................................................................13
3.1: Statistical Graph..................................................................................................................13
3.2: Trend line for sales and operating profit variables.............................................................16
3.4: Formal business report........................................................................................................16
........................................................................................................................................................18
PART B..........................................................................................................................................19
Internal rate of return.................................................................................................................20
4.3. Calculating Internal rate of return by linear interpolation..................................................21
IRR of Project A...................................................................................................................21
CONCLUSION..............................................................................................................................22
REFERENCES..............................................................................................................................23
INTRODUCTION
It is very important for any business to draft and implement different strategies. But for
proper formulation and implementation of strategies, it is very important for all the business
organizations to focus on decision making. Decision making plays very crucial role in business’s
success. Through quick and accurate decision making, management of a company can devise
proper strategies that can provide competitive edge to it as compared to its peer group
(Hedgebeth, 2007). Decision can be related to any field; it can be financial, investment,
diversification, growth, shut down, etc. But for good decision making, it is very important to
have proper access to information. Without adequate information, it will be very difficult for the
management to draw out any conclusion. There are various tools that help in effective decision
making. Through these tools, available information can be analyzed in better manner and
management can align the numerical data with its objectives. Further, amount of subjectivity is
also reduced by the decision making tools (Hacklin and Wallnofer, 2012).
The present report deals with Sainsbury and its decision making. This work will analyze
various kinds of information available about the company which will help in decision making
process and to draw certain conclusion.
TASK 1
Planning for collection of data
Researcher undertakes both primary and secondary data collection methods to evaluate
the effectiveness of product and services which are offered by Sainsbury. Both primary and
secondary data collection methods provide assistance to the researcher in conducting the research
in an effective manner. (Linderoth and et.al., 2006)
Plan for the collection of primary data: Primary data refers to those which are collected
by the researcher for the first time specifically for the research purpose. Observation, survey and
experimental research are the source through which one can gather primary data for the research
study. In the present report, researcher undertakes survey technique to gather primary data. In
order to assess to customer attitude towards products or services which are offered by Sainsbury,
survey will be conducted by the researcher. For this, researcher firstly requires to select sample
from the population. Thereafter, researcher frames appropriate questionnaire by including close
3 | P a g e
⊘ This is a preview!⊘
Do you want full access?
Subscribe today to unlock all pages.
Trusted by 1+ million students worldwide
and opened questions upon the services offered by Sainsbury. Through this, researcher is able to
conduct study in an appropriate manner and thereby, fulfills the objectives of research.
Plan for the collection of secondary data: Secondary data is the information which is
earlier collected by researcher or by an agency and not by the researcher himself (Gardner,
2004). Scholar can gather secondary data with the help of books, newspapers, business articles,
journals, previous studies, magazines, etc. Library has a huge collection of books, journals and
articles, etc. Thus, researcher can easily access secondary data to analyze the customer attitude
towards services offered by Sainsbury by approaching the library. Besides this, researcher can
also make an effective use of the findings of other researcher who make study on the similar kind
of topic or issue.
Thus, investigator can gather primary data by conducting survey with the help of
questionnaire. Besides this, researcher also undertakes secondary data sources which are highly
related to the research issue or purpose.
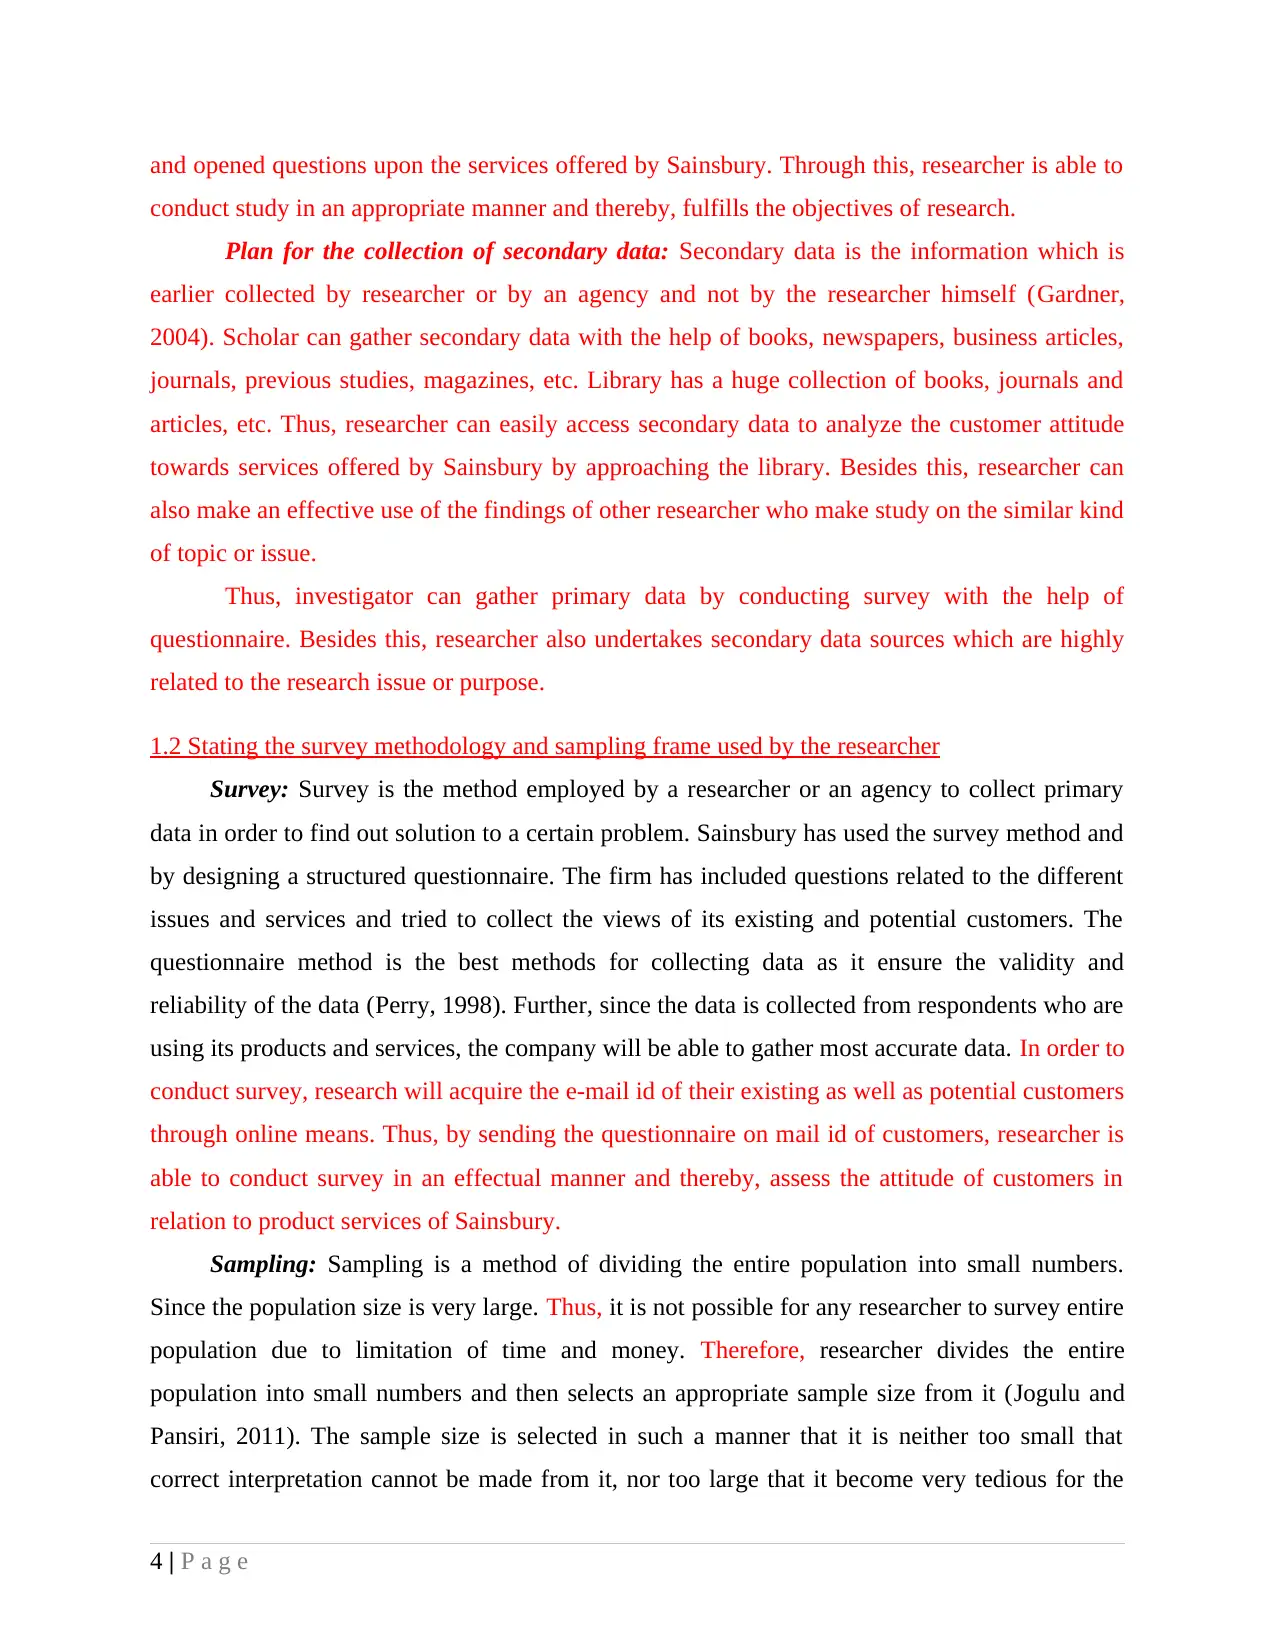
1.2 Stating the survey methodology and sampling frame used by the researcher
Survey: Survey is the method employed by a researcher or an agency to collect primary
data in order to find out solution to a certain problem. Sainsbury has used the survey method and
by designing a structured questionnaire. The firm has included questions related to the different
issues and services and tried to collect the views of its existing and potential customers. The
questionnaire method is the best methods for collecting data as it ensure the validity and
reliability of the data (Perry, 1998). Further, since the data is collected from respondents who are
using its products and services, the company will be able to gather most accurate data. In order to
conduct survey, research will acquire the e-mail id of their existing as well as potential customers
through online means. Thus, by sending the questionnaire on mail id of customers, researcher is
able to conduct survey in an effectual manner and thereby, assess the attitude of customers in
relation to product services of Sainsbury.
Sampling: Sampling is a method of dividing the entire population into small numbers.
Since the population size is very large. Thus, it is not possible for any researcher to survey entire
population due to limitation of time and money. Therefore, researcher divides the entire
population into small numbers and then selects an appropriate sample size from it (Jogulu and
Pansiri, 2011). The sample size is selected in such a manner that it is neither too small that
correct interpretation cannot be made from it, nor too large that it become very tedious for the
4 | P a g e
conduct study in an appropriate manner and thereby, fulfills the objectives of research.
Plan for the collection of secondary data: Secondary data is the information which is
earlier collected by researcher or by an agency and not by the researcher himself (Gardner,
2004). Scholar can gather secondary data with the help of books, newspapers, business articles,
journals, previous studies, magazines, etc. Library has a huge collection of books, journals and
articles, etc. Thus, researcher can easily access secondary data to analyze the customer attitude
towards services offered by Sainsbury by approaching the library. Besides this, researcher can
also make an effective use of the findings of other researcher who make study on the similar kind
of topic or issue.
Thus, investigator can gather primary data by conducting survey with the help of
questionnaire. Besides this, researcher also undertakes secondary data sources which are highly
related to the research issue or purpose.
1.2 Stating the survey methodology and sampling frame used by the researcher
Survey: Survey is the method employed by a researcher or an agency to collect primary
data in order to find out solution to a certain problem. Sainsbury has used the survey method and
by designing a structured questionnaire. The firm has included questions related to the different
issues and services and tried to collect the views of its existing and potential customers. The
questionnaire method is the best methods for collecting data as it ensure the validity and
reliability of the data (Perry, 1998). Further, since the data is collected from respondents who are
using its products and services, the company will be able to gather most accurate data. In order to
conduct survey, research will acquire the e-mail id of their existing as well as potential customers
through online means. Thus, by sending the questionnaire on mail id of customers, researcher is
able to conduct survey in an effectual manner and thereby, assess the attitude of customers in
relation to product services of Sainsbury.
Sampling: Sampling is a method of dividing the entire population into small numbers.
Since the population size is very large. Thus, it is not possible for any researcher to survey entire
population due to limitation of time and money. Therefore, researcher divides the entire
population into small numbers and then selects an appropriate sample size from it (Jogulu and
Pansiri, 2011). The sample size is selected in such a manner that it is neither too small that
correct interpretation cannot be made from it, nor too large that it become very tedious for the
4 | P a g e
Paraphrase This Document
Need a fresh take? Get an instant paraphrase of this document with our AI Paraphraser
researcher to collect the data from all the respondents. There are basically two methods of
sample selection; probability sampling and non-probability sampling. Under probability
sampling, all the respondents of the population have equal opportunity of being surveyed, while,
in the non-probability sampling, there is no equal opportunity with all the respondents. Among
all the sampling techniques available, simple random sampling technique has been used by the
company. It ensured that all the respondents had equal chances of being surveyed and has
eliminated the chances of biasness. Further, the sample size for the given survey was 50. For the
present investigation, researcher will send questionnaire to 50 customers of Sainsbury which
help them in presenting fair views on research issue.
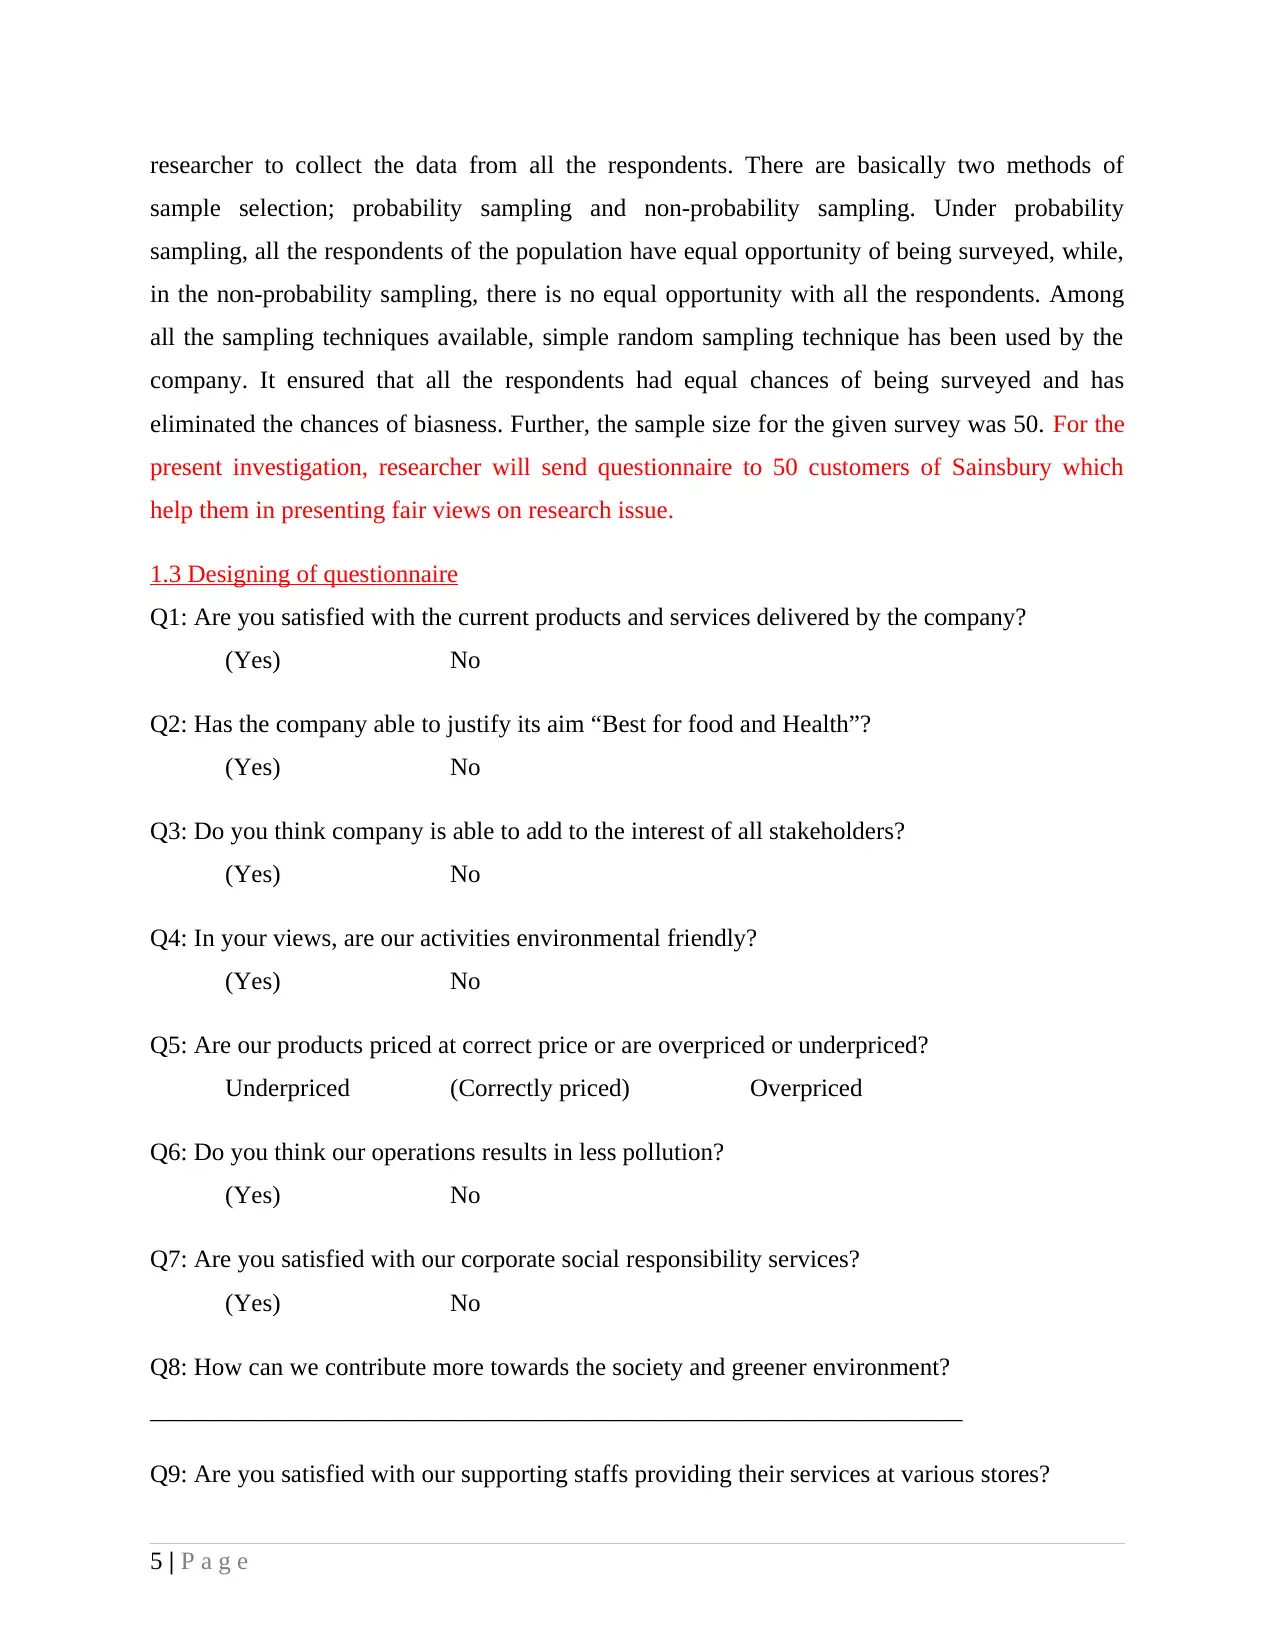
1.3 Designing of questionnaire
Q1: Are you satisfied with the current products and services delivered by the company?
(Yes) No
Q2: Has the company able to justify its aim “Best for food and Health”?
(Yes) No
Q3: Do you think company is able to add to the interest of all stakeholders?
(Yes) No
Q4: In your views, are our activities environmental friendly?
(Yes) No
Q5: Are our products priced at correct price or are overpriced or underpriced?
Underpriced (Correctly priced) Overpriced
Q6: Do you think our operations results in less pollution?
(Yes) No
Q7: Are you satisfied with our corporate social responsibility services?
(Yes) No
Q8: How can we contribute more towards the society and greener environment?
_________________________________________________________________
Q9: Are you satisfied with our supporting staffs providing their services at various stores?
5 | P a g e
sample selection; probability sampling and non-probability sampling. Under probability
sampling, all the respondents of the population have equal opportunity of being surveyed, while,
in the non-probability sampling, there is no equal opportunity with all the respondents. Among
all the sampling techniques available, simple random sampling technique has been used by the
company. It ensured that all the respondents had equal chances of being surveyed and has
eliminated the chances of biasness. Further, the sample size for the given survey was 50. For the
present investigation, researcher will send questionnaire to 50 customers of Sainsbury which
help them in presenting fair views on research issue.
1.3 Designing of questionnaire
Q1: Are you satisfied with the current products and services delivered by the company?
(Yes) No
Q2: Has the company able to justify its aim “Best for food and Health”?
(Yes) No
Q3: Do you think company is able to add to the interest of all stakeholders?
(Yes) No
Q4: In your views, are our activities environmental friendly?
(Yes) No
Q5: Are our products priced at correct price or are overpriced or underpriced?
Underpriced (Correctly priced) Overpriced
Q6: Do you think our operations results in less pollution?
(Yes) No
Q7: Are you satisfied with our corporate social responsibility services?
(Yes) No
Q8: How can we contribute more towards the society and greener environment?
_________________________________________________________________
Q9: Are you satisfied with our supporting staffs providing their services at various stores?
5 | P a g e
(Yes) No
Q10: How can we further improve our customer services?
TASK 2
2.1: Statistical Analysis
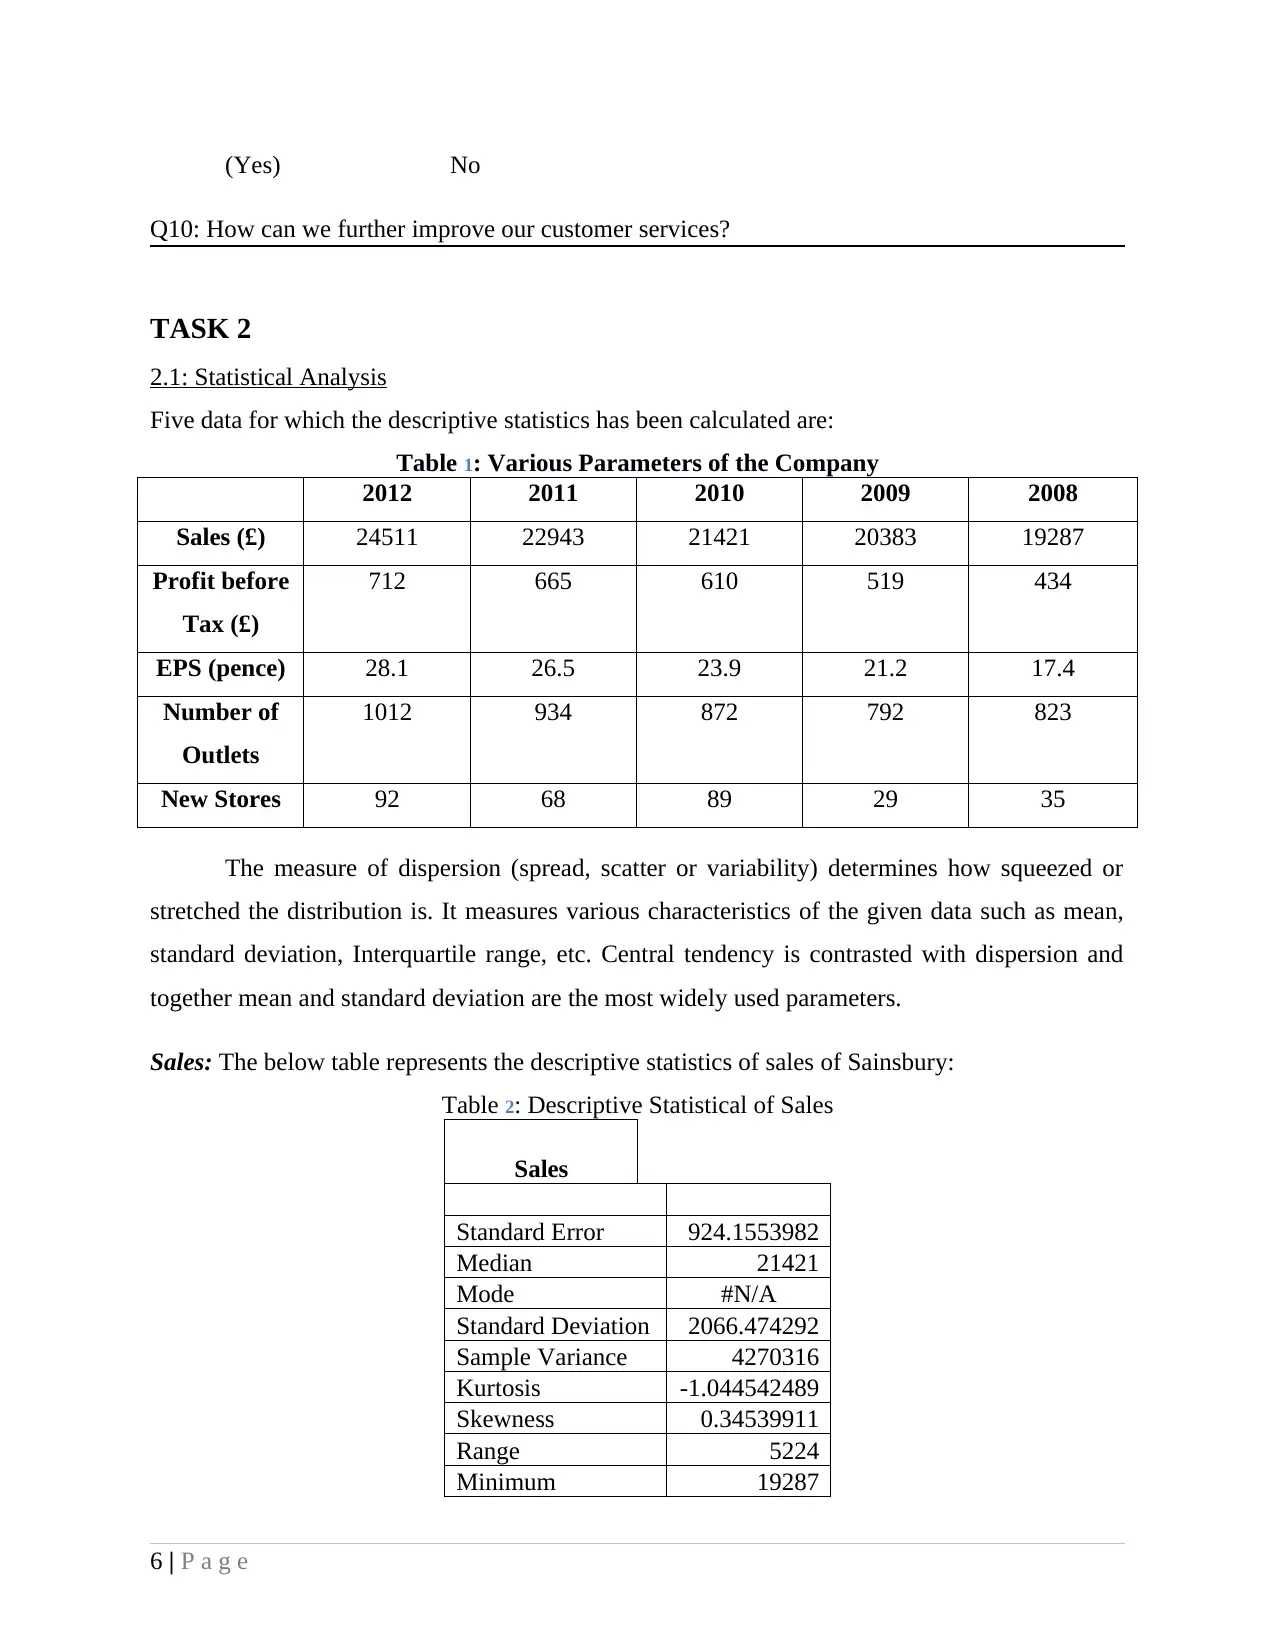
Five data for which the descriptive statistics has been calculated are:
Table 1: Various Parameters of the Company
2012 2011 2010 2009 2008
Sales (£) 24511 22943 21421 20383 19287
Profit before
Tax (£)
712 665 610 519 434
EPS (pence) 28.1 26.5 23.9 21.2 17.4
Number of
Outlets
1012 934 872 792 823
New Stores 92 68 89 29 35
The measure of dispersion (spread, scatter or variability) determines how squeezed or
stretched the distribution is. It measures various characteristics of the given data such as mean,
standard deviation, Interquartile range, etc. Central tendency is contrasted with dispersion and
together mean and standard deviation are the most widely used parameters.
Sales: The below table represents the descriptive statistics of sales of Sainsbury:
Table 2: Descriptive Statistical of Sales
Sales
Standard Error 924.1553982
Median 21421
Mode #N/A
Standard Deviation 2066.474292
Sample Variance 4270316
Kurtosis -1.044542489
Skewness 0.34539911
Range 5224
Minimum 19287
6 | P a g e
Q10: How can we further improve our customer services?
TASK 2
2.1: Statistical Analysis
Five data for which the descriptive statistics has been calculated are:
Table 1: Various Parameters of the Company
2012 2011 2010 2009 2008
Sales (£) 24511 22943 21421 20383 19287
Profit before
Tax (£)
712 665 610 519 434
EPS (pence) 28.1 26.5 23.9 21.2 17.4
Number of
Outlets
1012 934 872 792 823
New Stores 92 68 89 29 35
The measure of dispersion (spread, scatter or variability) determines how squeezed or
stretched the distribution is. It measures various characteristics of the given data such as mean,
standard deviation, Interquartile range, etc. Central tendency is contrasted with dispersion and
together mean and standard deviation are the most widely used parameters.
Sales: The below table represents the descriptive statistics of sales of Sainsbury:
Table 2: Descriptive Statistical of Sales
Sales
Standard Error 924.1553982
Median 21421
Mode #N/A
Standard Deviation 2066.474292
Sample Variance 4270316
Kurtosis -1.044542489
Skewness 0.34539911
Range 5224
Minimum 19287
6 | P a g e
⊘ This is a preview!⊘
Do you want full access?
Subscribe today to unlock all pages.
Trusted by 1+ million students worldwide
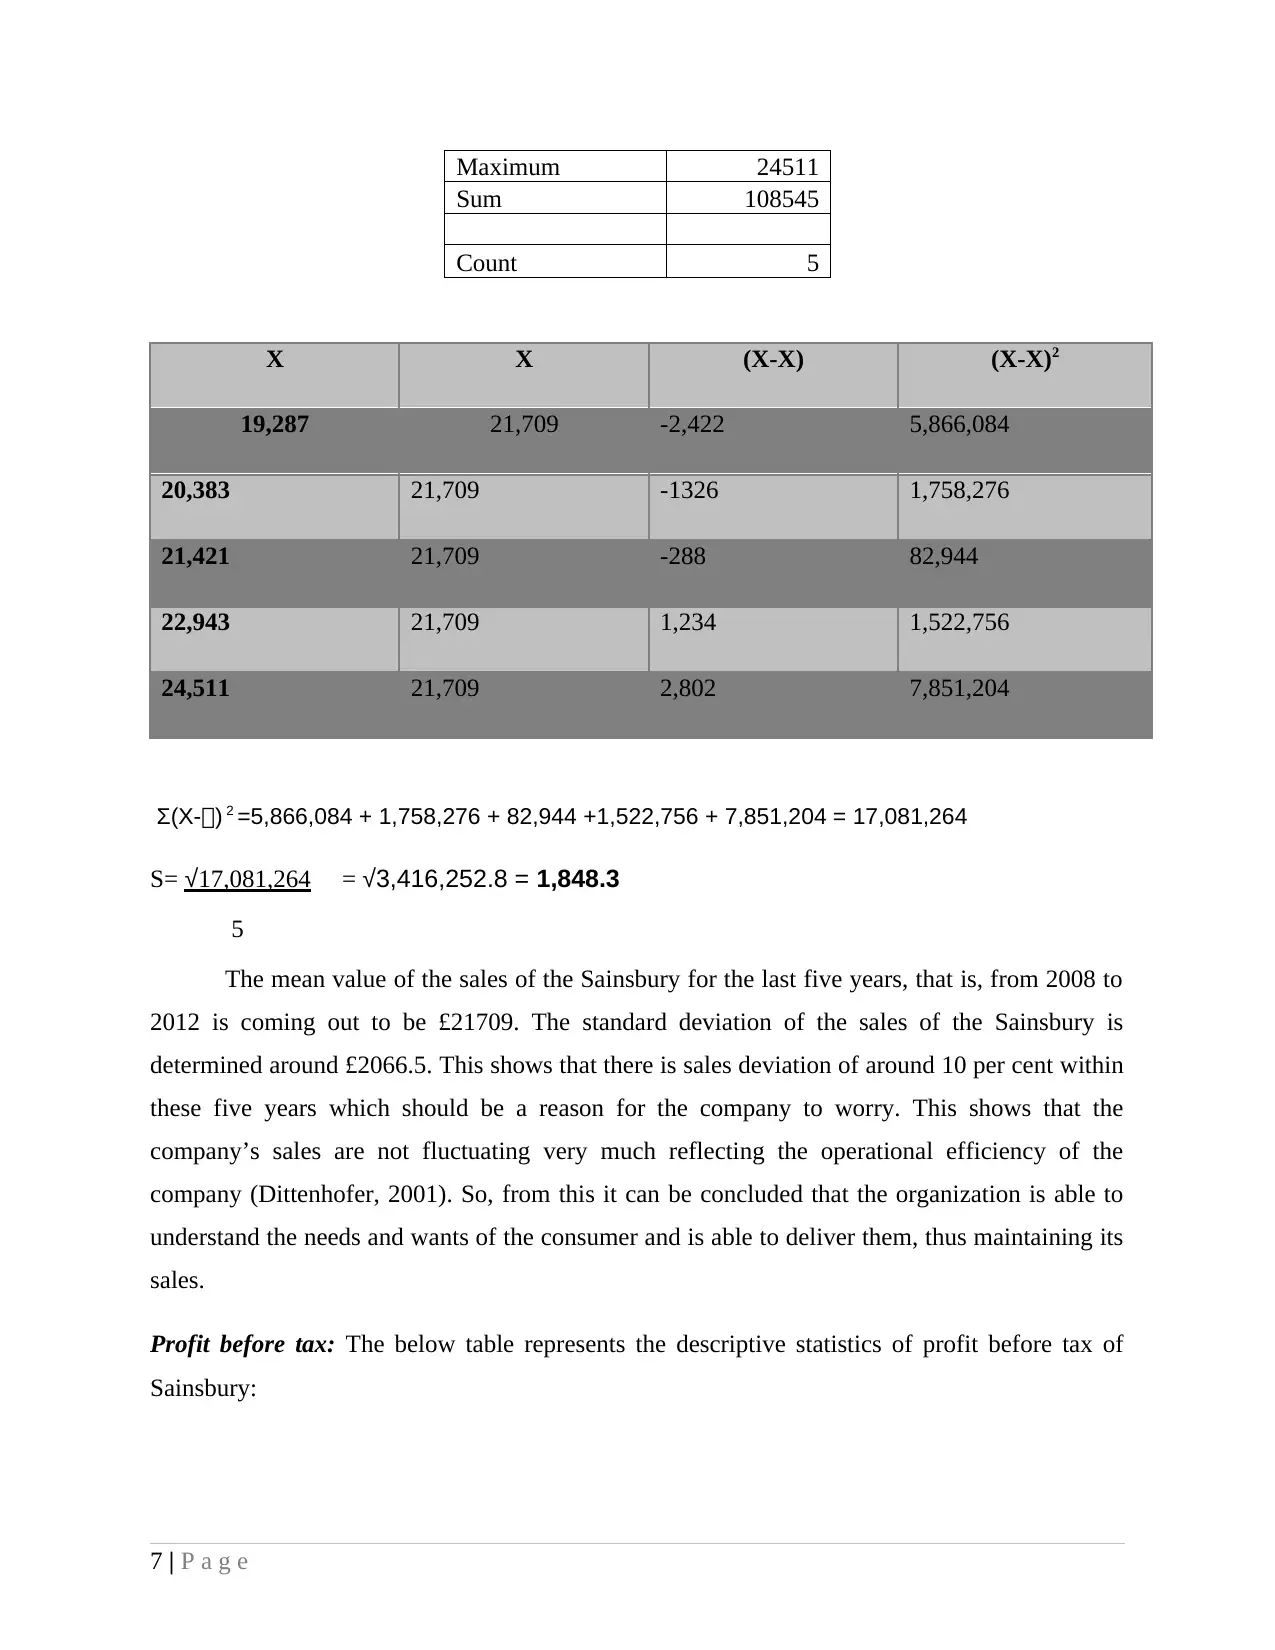
Maximum 24511
Sum 108545
Count 5
X X (X-X) (X-X)2
19,287 21,709 -2,422 5,866,084
20,383 21,709 -1326 1,758,276
21,421 21,709 -288 82,944
22,943 21,709 1,234 1,522,756
24,511 21,709 2,802 7,851,204
Σ(X-) 2 =5,866,084 + 1,758,276 + 82,944 +1,522,756 + 7,851,204 = 17,081,264
S= √17,081,264 = √3,416,252.8 = 1,848.3
5
The mean value of the sales of the Sainsbury for the last five years, that is, from 2008 to
2012 is coming out to be £21709. The standard deviation of the sales of the Sainsbury is
determined around £2066.5. This shows that there is sales deviation of around 10 per cent within
these five years which should be a reason for the company to worry. This shows that the
company’s sales are not fluctuating very much reflecting the operational efficiency of the
company (Dittenhofer, 2001). So, from this it can be concluded that the organization is able to
understand the needs and wants of the consumer and is able to deliver them, thus maintaining its
sales.
Profit before tax: The below table represents the descriptive statistics of profit before tax of
Sainsbury:
7 | P a g e
Paraphrase This Document
Need a fresh take? Get an instant paraphrase of this document with our AI Paraphraser
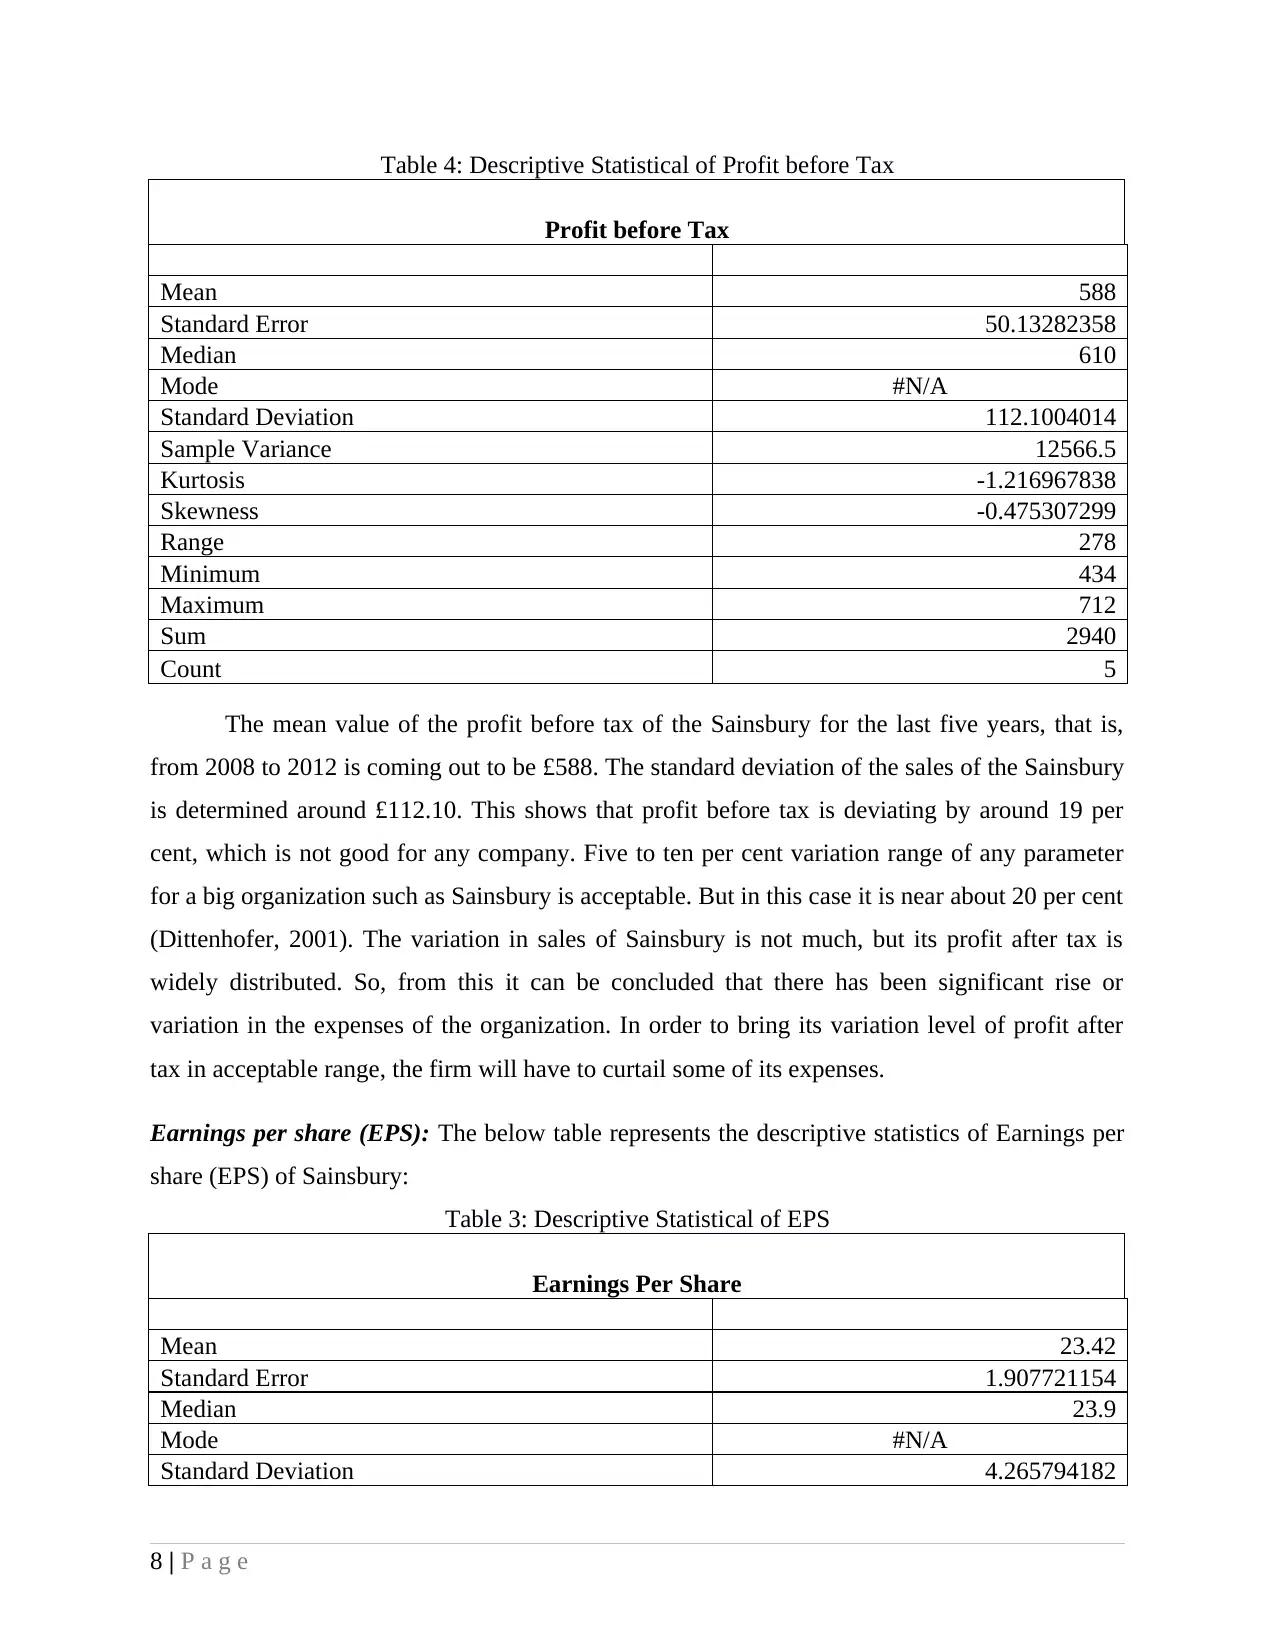
Table 4: Descriptive Statistical of Profit before Tax
Profit before Tax
Mean 588
Standard Error 50.13282358
Median 610
Mode #N/A
Standard Deviation 112.1004014
Sample Variance 12566.5
Kurtosis -1.216967838
Skewness -0.475307299
Range 278
Minimum 434
Maximum 712
Sum 2940
Count 5
The mean value of the profit before tax of the Sainsbury for the last five years, that is,
from 2008 to 2012 is coming out to be £588. The standard deviation of the sales of the Sainsbury
is determined around £112.10. This shows that profit before tax is deviating by around 19 per
cent, which is not good for any company. Five to ten per cent variation range of any parameter
for a big organization such as Sainsbury is acceptable. But in this case it is near about 20 per cent
(Dittenhofer, 2001). The variation in sales of Sainsbury is not much, but its profit after tax is
widely distributed. So, from this it can be concluded that there has been significant rise or
variation in the expenses of the organization. In order to bring its variation level of profit after
tax in acceptable range, the firm will have to curtail some of its expenses.
Earnings per share (EPS): The below table represents the descriptive statistics of Earnings per
share (EPS) of Sainsbury:
Table 3: Descriptive Statistical of EPS
Earnings Per Share
Mean 23.42
Standard Error 1.907721154
Median 23.9
Mode #N/A
Standard Deviation 4.265794182
8 | P a g e
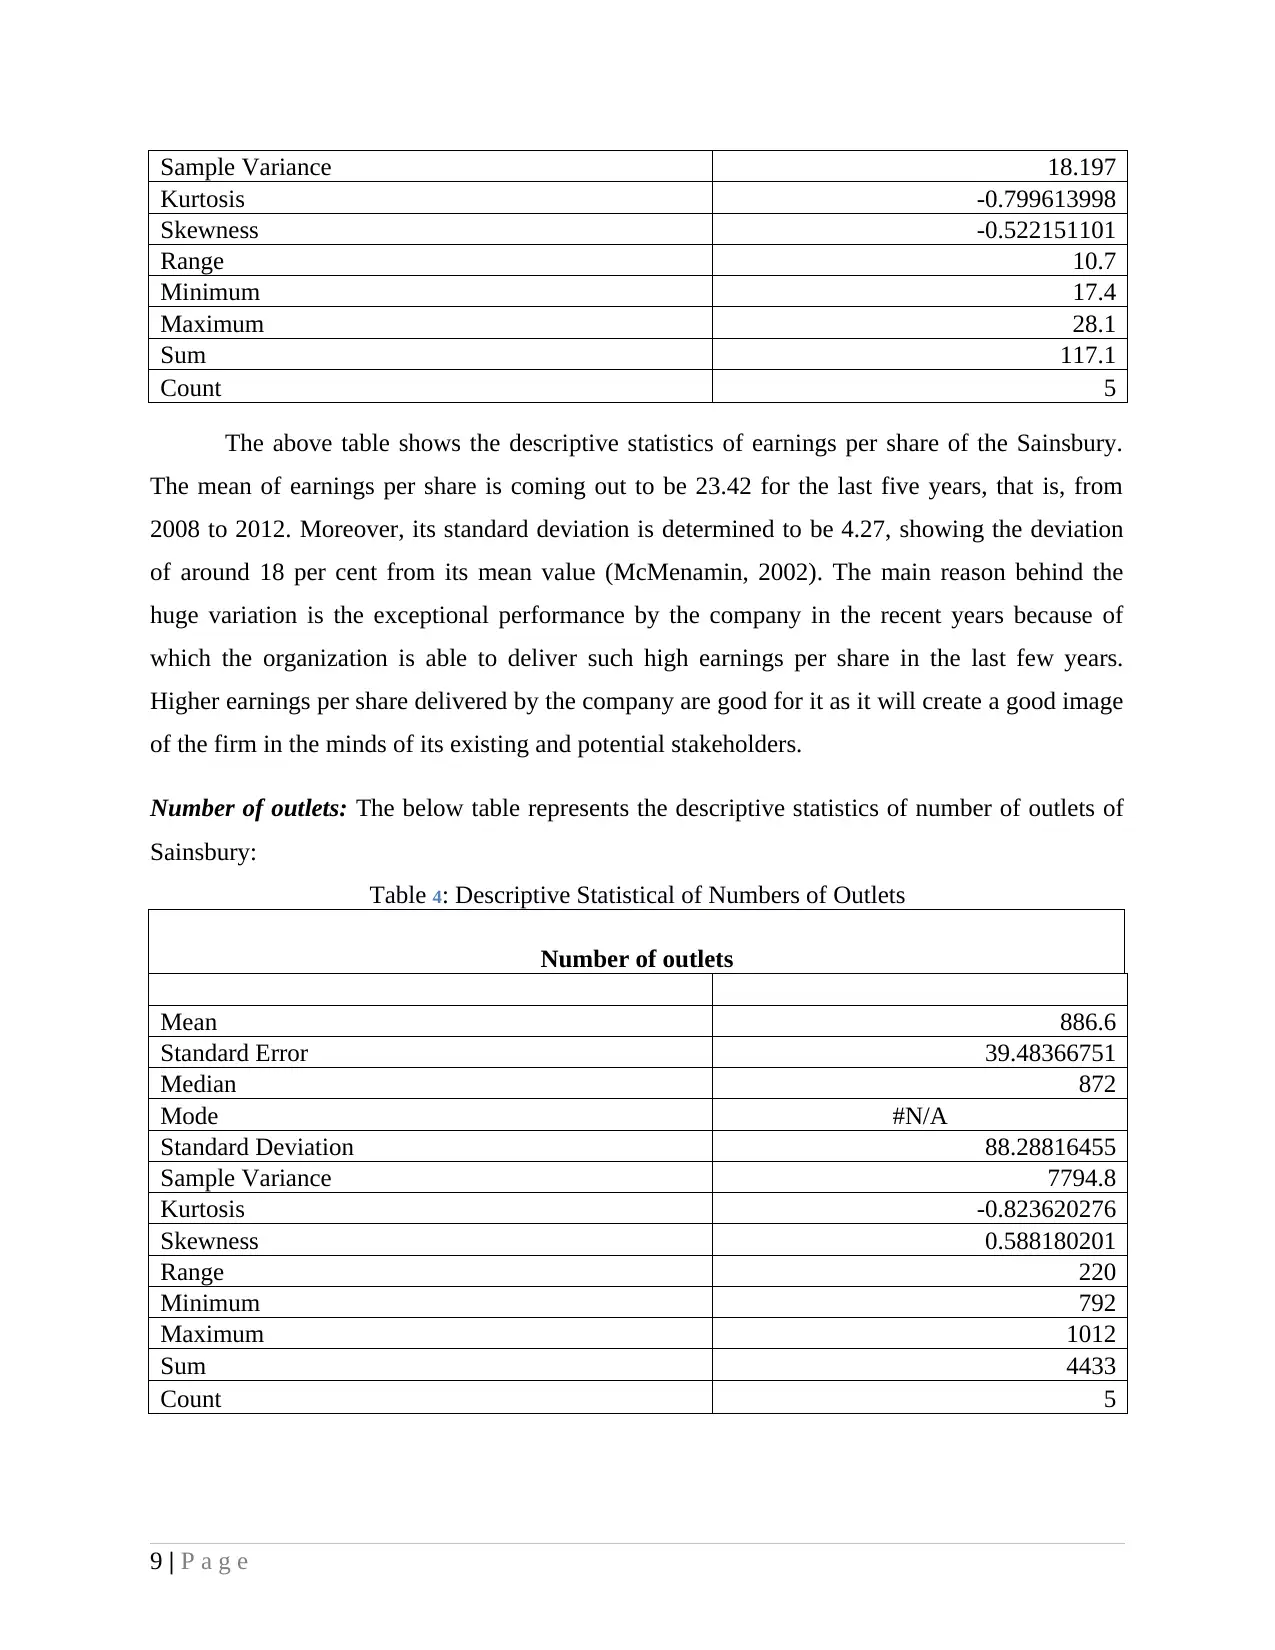
Sample Variance 18.197
Kurtosis -0.799613998
Skewness -0.522151101
Range 10.7
Minimum 17.4
Maximum 28.1
Sum 117.1
Count 5
The above table shows the descriptive statistics of earnings per share of the Sainsbury.
The mean of earnings per share is coming out to be 23.42 for the last five years, that is, from
2008 to 2012. Moreover, its standard deviation is determined to be 4.27, showing the deviation
of around 18 per cent from its mean value (McMenamin, 2002). The main reason behind the
huge variation is the exceptional performance by the company in the recent years because of
which the organization is able to deliver such high earnings per share in the last few years.
Higher earnings per share delivered by the company are good for it as it will create a good image
of the firm in the minds of its existing and potential stakeholders.
Number of outlets: The below table represents the descriptive statistics of number of outlets of
Sainsbury:
Table 4: Descriptive Statistical of Numbers of Outlets
Number of outlets
Mean 886.6
Standard Error 39.48366751
Median 872
Mode #N/A
Standard Deviation 88.28816455
Sample Variance 7794.8
Kurtosis -0.823620276
Skewness 0.588180201
Range 220
Minimum 792
Maximum 1012
Sum 4433
Count 5
9 | P a g e
⊘ This is a preview!⊘
Do you want full access?
Subscribe today to unlock all pages.
Trusted by 1+ million students worldwide
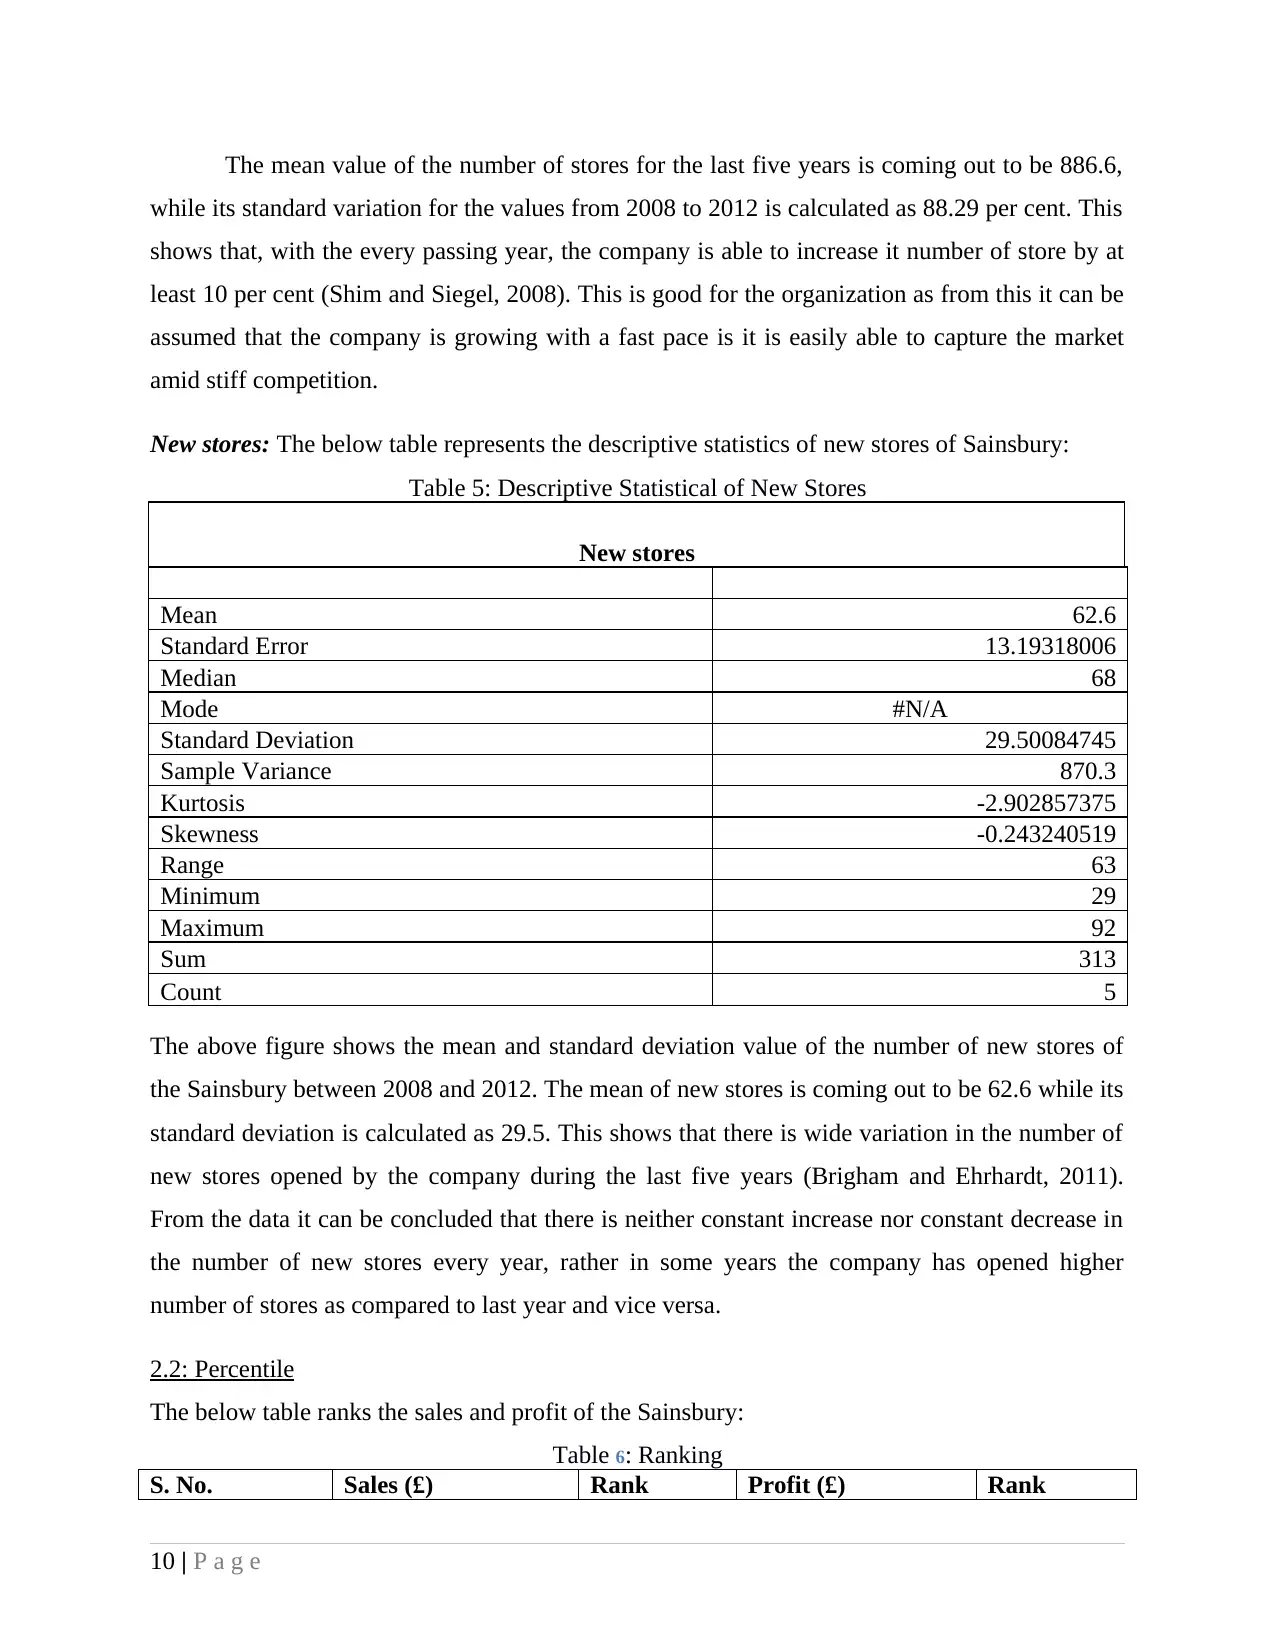
The mean value of the number of stores for the last five years is coming out to be 886.6,
while its standard variation for the values from 2008 to 2012 is calculated as 88.29 per cent. This
shows that, with the every passing year, the company is able to increase it number of store by at
least 10 per cent (Shim and Siegel, 2008). This is good for the organization as from this it can be
assumed that the company is growing with a fast pace is it is easily able to capture the market
amid stiff competition.
New stores: The below table represents the descriptive statistics of new stores of Sainsbury:
Table 5: Descriptive Statistical of New Stores
New stores
Mean 62.6
Standard Error 13.19318006
Median 68
Mode #N/A
Standard Deviation 29.50084745
Sample Variance 870.3
Kurtosis -2.902857375
Skewness -0.243240519
Range 63
Minimum 29
Maximum 92
Sum 313
Count 5
The above figure shows the mean and standard deviation value of the number of new stores of
the Sainsbury between 2008 and 2012. The mean of new stores is coming out to be 62.6 while its
standard deviation is calculated as 29.5. This shows that there is wide variation in the number of
new stores opened by the company during the last five years (Brigham and Ehrhardt, 2011).
From the data it can be concluded that there is neither constant increase nor constant decrease in
the number of new stores every year, rather in some years the company has opened higher
number of stores as compared to last year and vice versa.
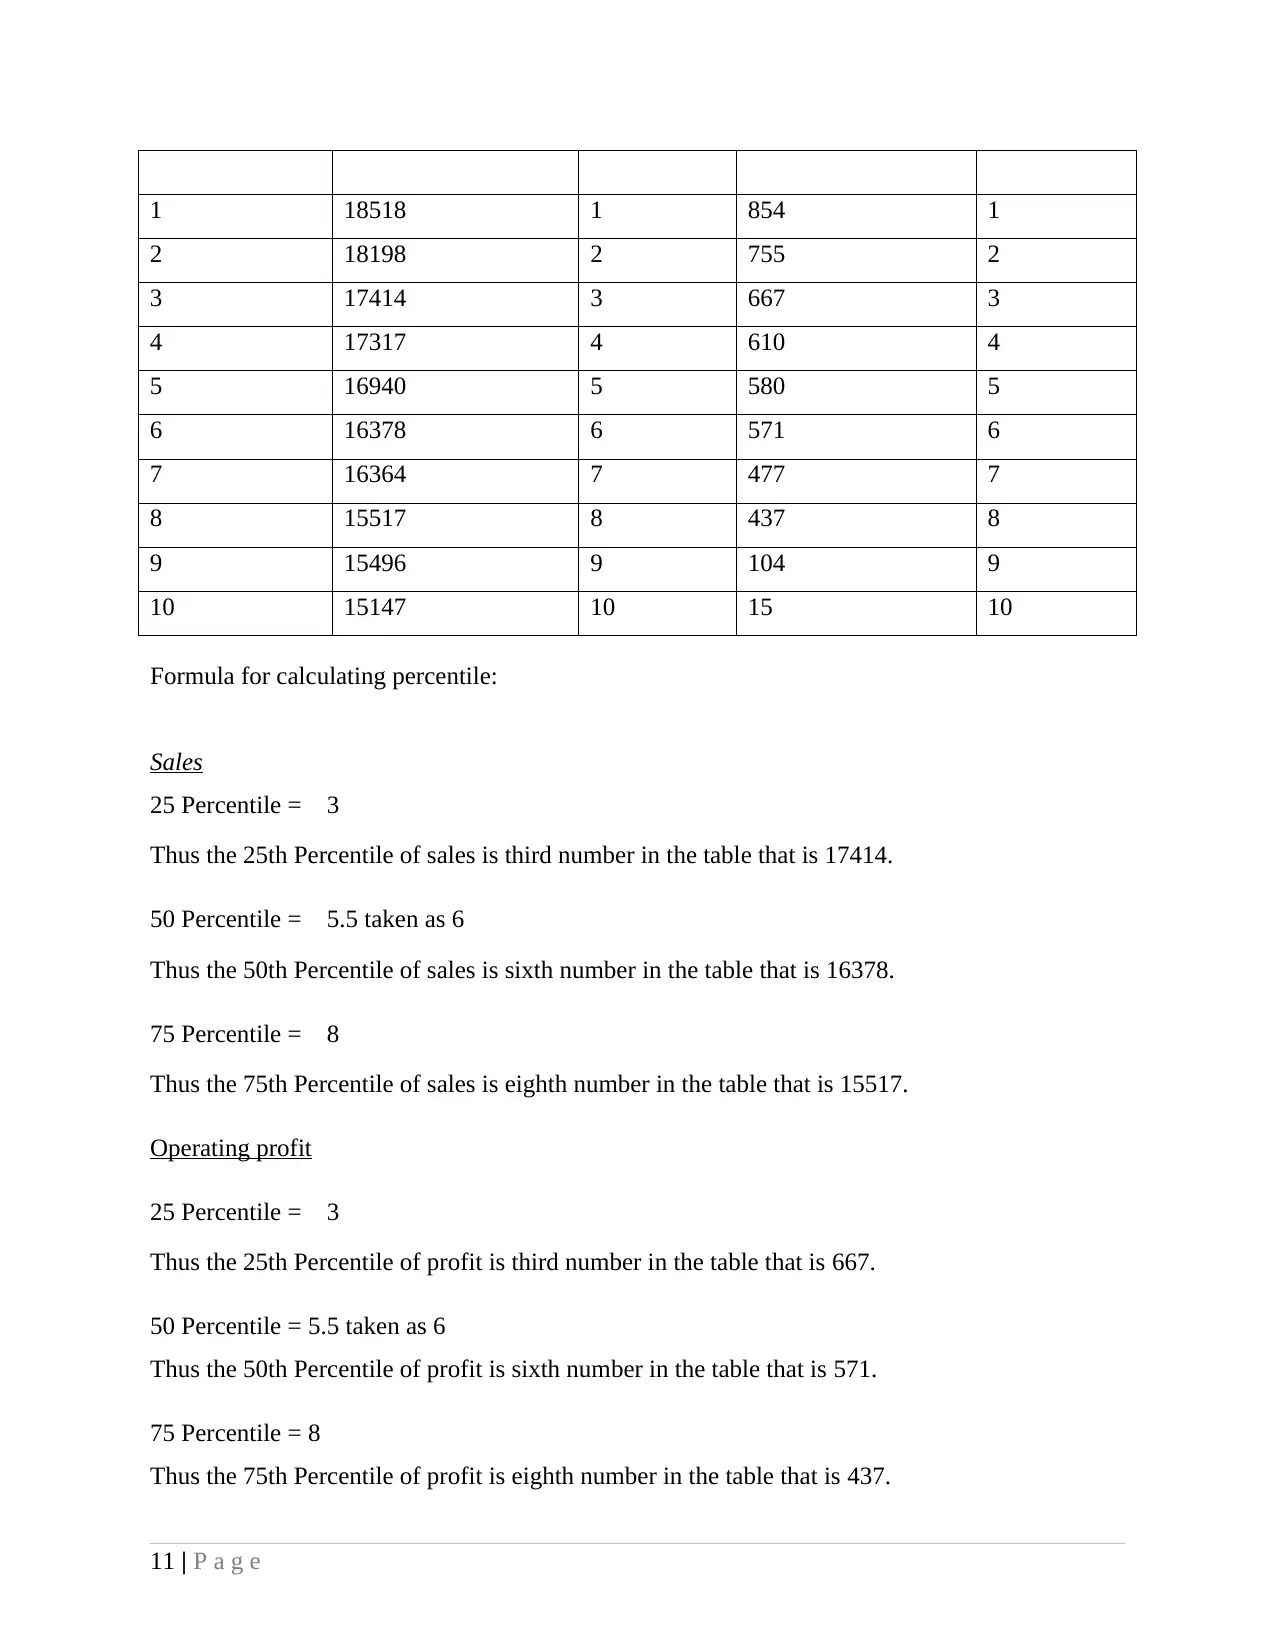
2.2: Percentile
The below table ranks the sales and profit of the Sainsbury:
Table 6: Ranking
S. No. Sales (£) Rank Profit (£) Rank
10 | P a g e
while its standard variation for the values from 2008 to 2012 is calculated as 88.29 per cent. This
shows that, with the every passing year, the company is able to increase it number of store by at
least 10 per cent (Shim and Siegel, 2008). This is good for the organization as from this it can be
assumed that the company is growing with a fast pace is it is easily able to capture the market
amid stiff competition.
New stores: The below table represents the descriptive statistics of new stores of Sainsbury:
Table 5: Descriptive Statistical of New Stores
New stores
Mean 62.6
Standard Error 13.19318006
Median 68
Mode #N/A
Standard Deviation 29.50084745
Sample Variance 870.3
Kurtosis -2.902857375
Skewness -0.243240519
Range 63
Minimum 29
Maximum 92
Sum 313
Count 5
The above figure shows the mean and standard deviation value of the number of new stores of
the Sainsbury between 2008 and 2012. The mean of new stores is coming out to be 62.6 while its
standard deviation is calculated as 29.5. This shows that there is wide variation in the number of
new stores opened by the company during the last five years (Brigham and Ehrhardt, 2011).
From the data it can be concluded that there is neither constant increase nor constant decrease in
the number of new stores every year, rather in some years the company has opened higher
number of stores as compared to last year and vice versa.
2.2: Percentile
The below table ranks the sales and profit of the Sainsbury:
Table 6: Ranking
S. No. Sales (£) Rank Profit (£) Rank
10 | P a g e
Paraphrase This Document
Need a fresh take? Get an instant paraphrase of this document with our AI Paraphraser
1 18518 1 854 1
2 18198 2 755 2
3 17414 3 667 3
4 17317 4 610 4
5 16940 5 580 5
6 16378 6 571 6
7 16364 7 477 7
8 15517 8 437 8
9 15496 9 104 9
10 15147 10 15 10
Formula for calculating percentile:
Sales
25 Percentile = 3
Thus the 25th Percentile of sales is third number in the table that is 17414.
50 Percentile = 5.5 taken as 6
Thus the 50th Percentile of sales is sixth number in the table that is 16378.
75 Percentile = 8
Thus the 75th Percentile of sales is eighth number in the table that is 15517.
Operating profit
25 Percentile = 3
Thus the 25th Percentile of profit is third number in the table that is 667.
50 Percentile = 5.5 taken as 6
Thus the 50th Percentile of profit is sixth number in the table that is 571.
75 Percentile = 8
Thus the 75th Percentile of profit is eighth number in the table that is 437.
11 | P a g e
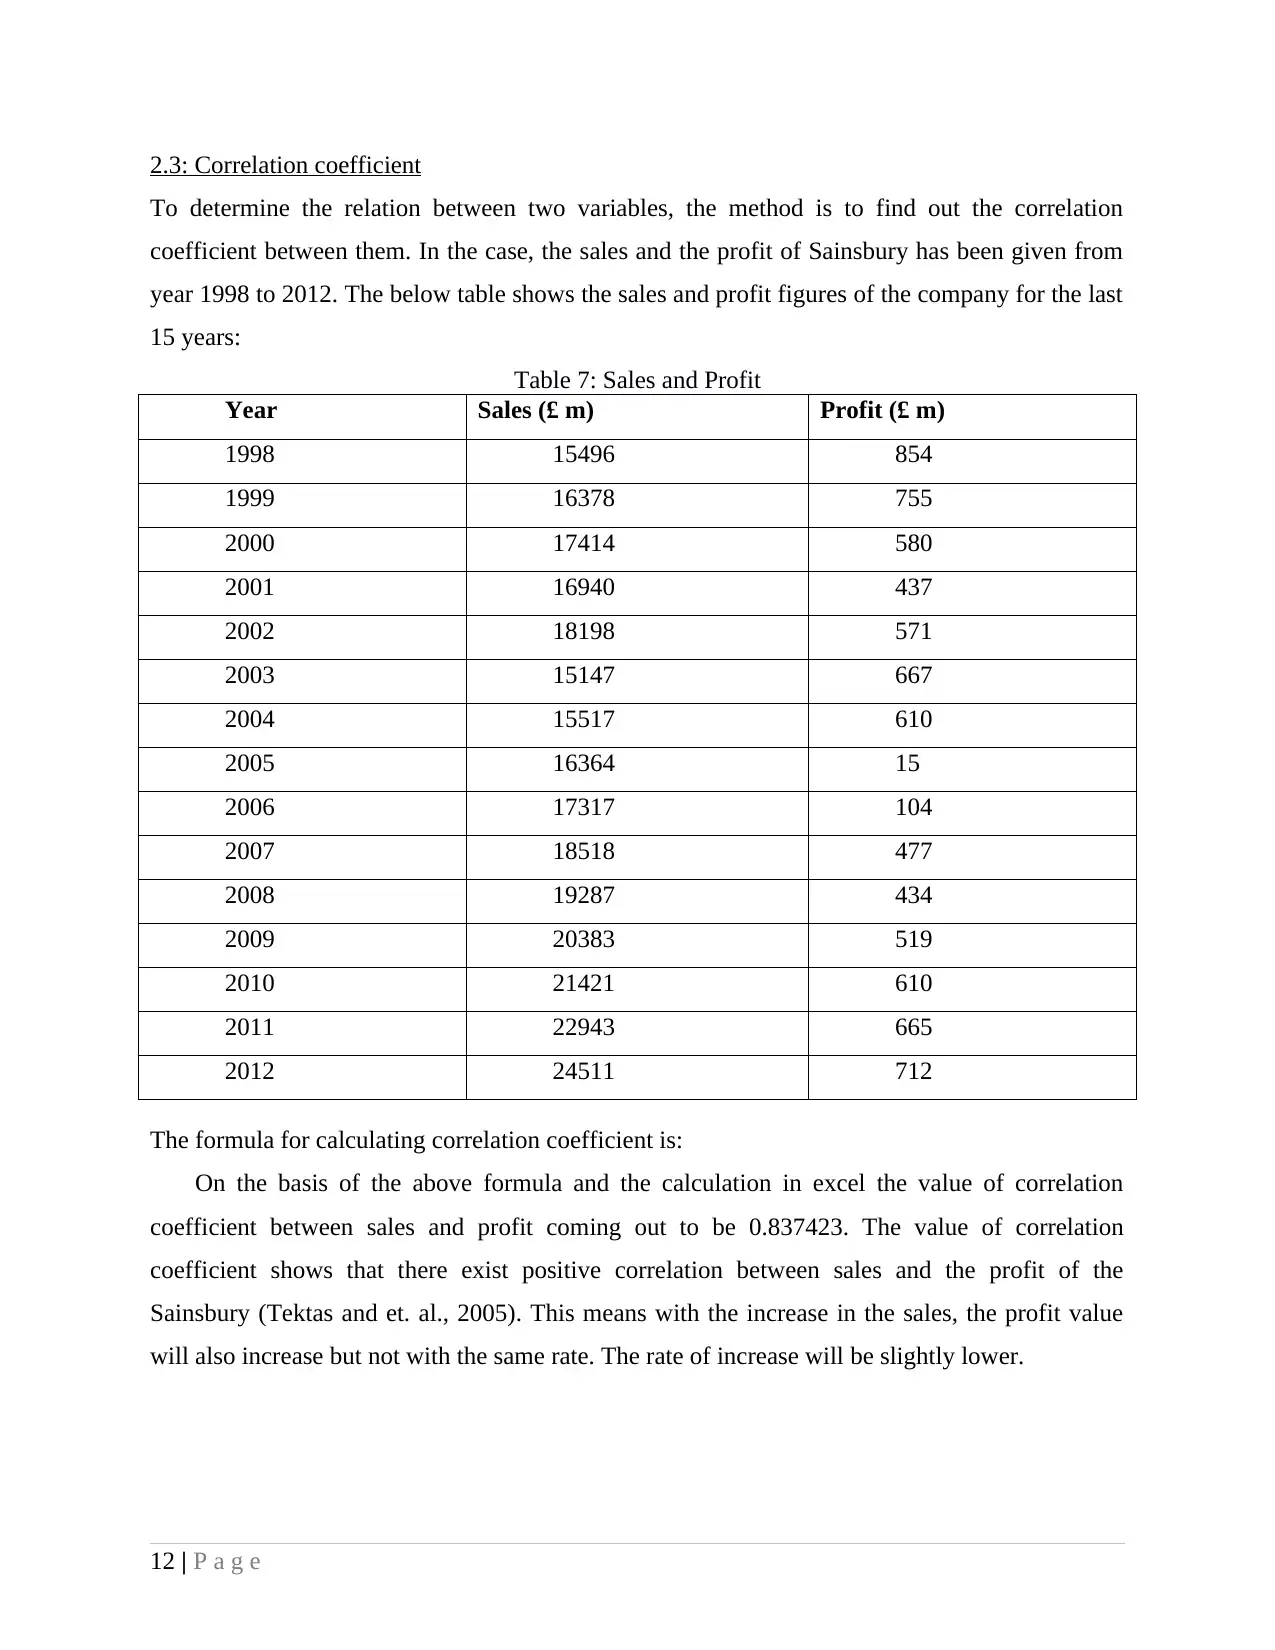
2.3: Correlation coefficient
To determine the relation between two variables, the method is to find out the correlation
coefficient between them. In the case, the sales and the profit of Sainsbury has been given from
year 1998 to 2012. The below table shows the sales and profit figures of the company for the last
15 years:
Table 7: Sales and Profit
Year Sales (£ m) Profit (£ m)
1998 15496 854
1999 16378 755
2000 17414 580
2001 16940 437
2002 18198 571
2003 15147 667
2004 15517 610
2005 16364 15
2006 17317 104
2007 18518 477
2008 19287 434
2009 20383 519
2010 21421 610
2011 22943 665
2012 24511 712
The formula for calculating correlation coefficient is:
On the basis of the above formula and the calculation in excel the value of correlation
coefficient between sales and profit coming out to be 0.837423. The value of correlation
coefficient shows that there exist positive correlation between sales and the profit of the
Sainsbury (Tektas and et. al., 2005). This means with the increase in the sales, the profit value
will also increase but not with the same rate. The rate of increase will be slightly lower.
12 | P a g e
⊘ This is a preview!⊘
Do you want full access?
Subscribe today to unlock all pages.
Trusted by 1+ million students worldwide
1 out of 23
Related Documents


Your All-in-One AI-Powered Toolkit for Academic Success.
+13062052269
info@desklib.com
Available 24*7 on WhatsApp / Email
![[object Object]](/_next/static/media/star-bottom.7253800d.svg)
Unlock your academic potential
Copyright © 2020–2026 A2Z Services. All Rights Reserved. Developed and managed by ZUCOL.