ACFI1203: Financial Accounting Assignment - Sainsbury's Analysis

Verified

Added on  2022/09/11

|7
|982
|28
Homework Assignment
AI Summary
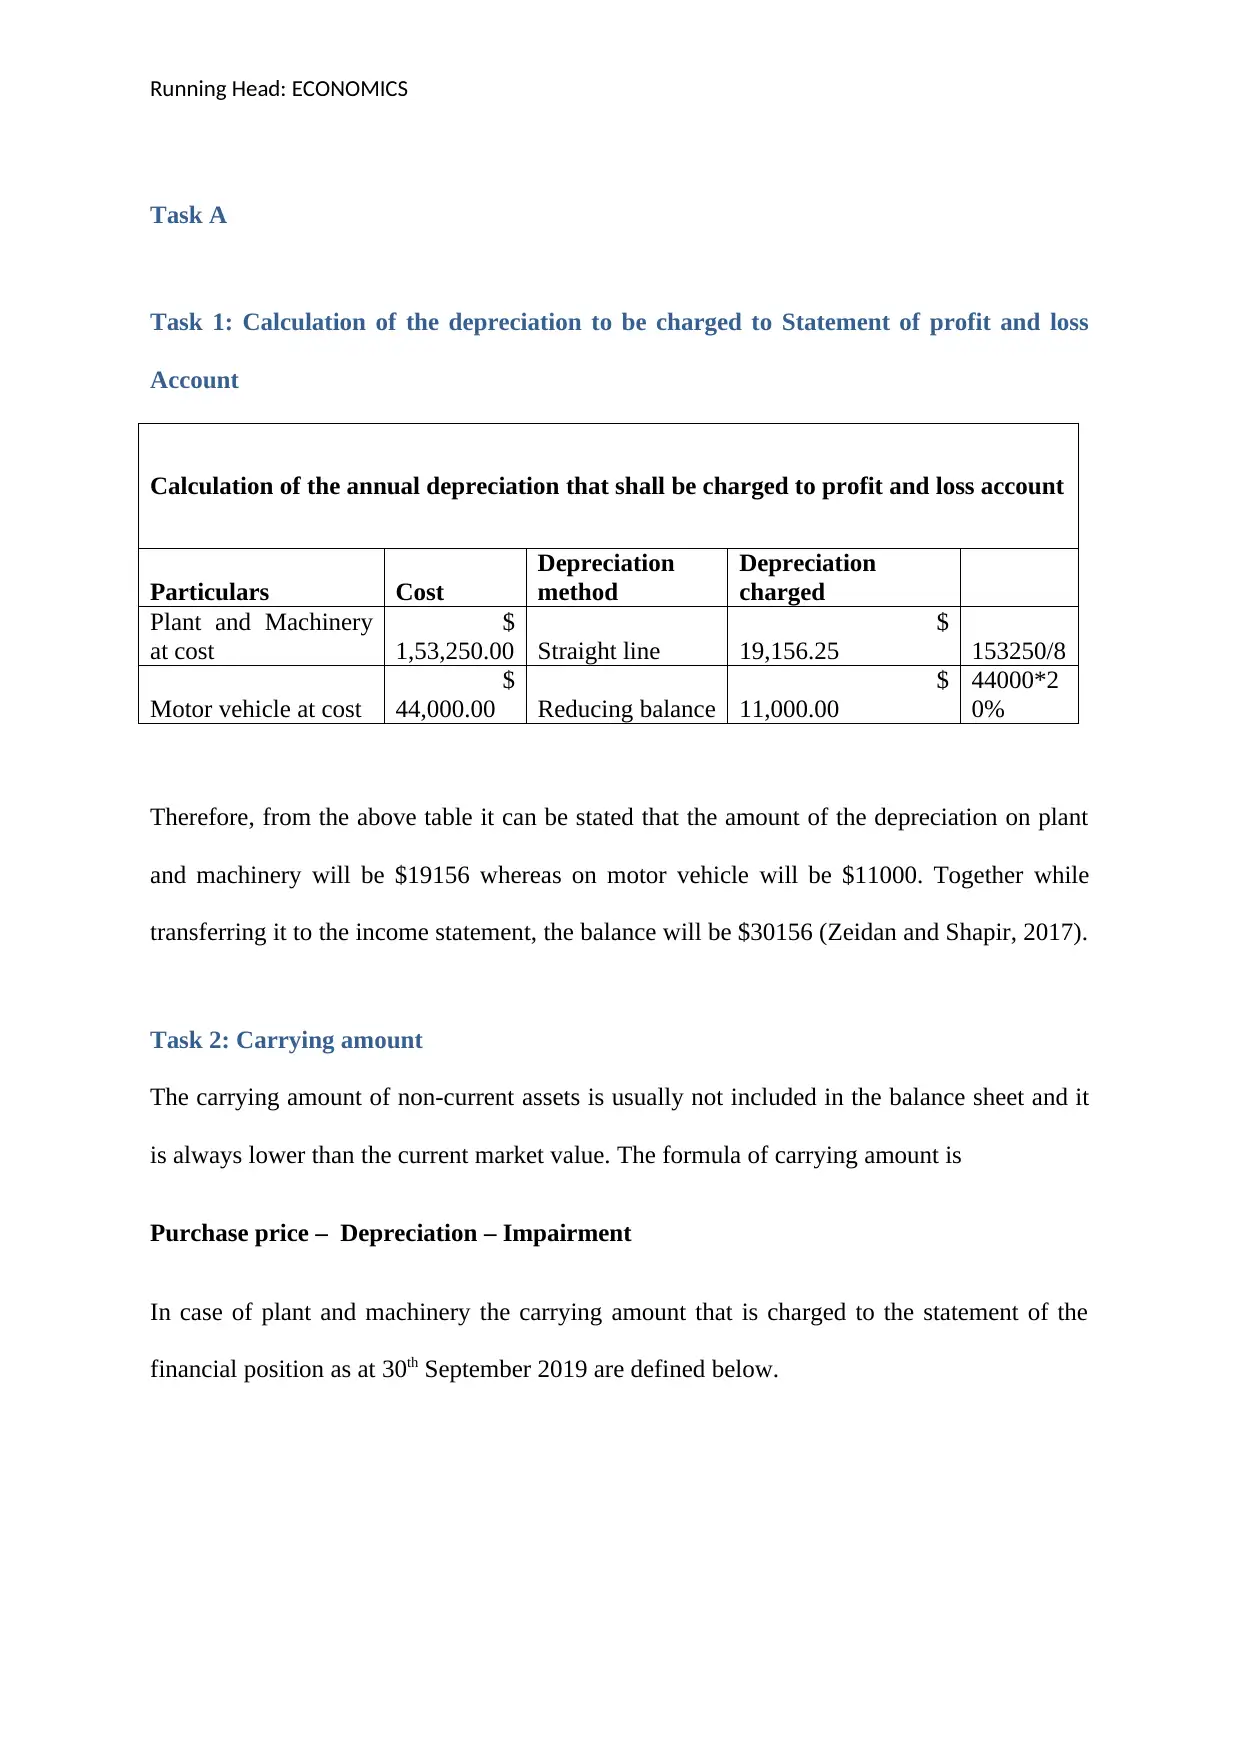
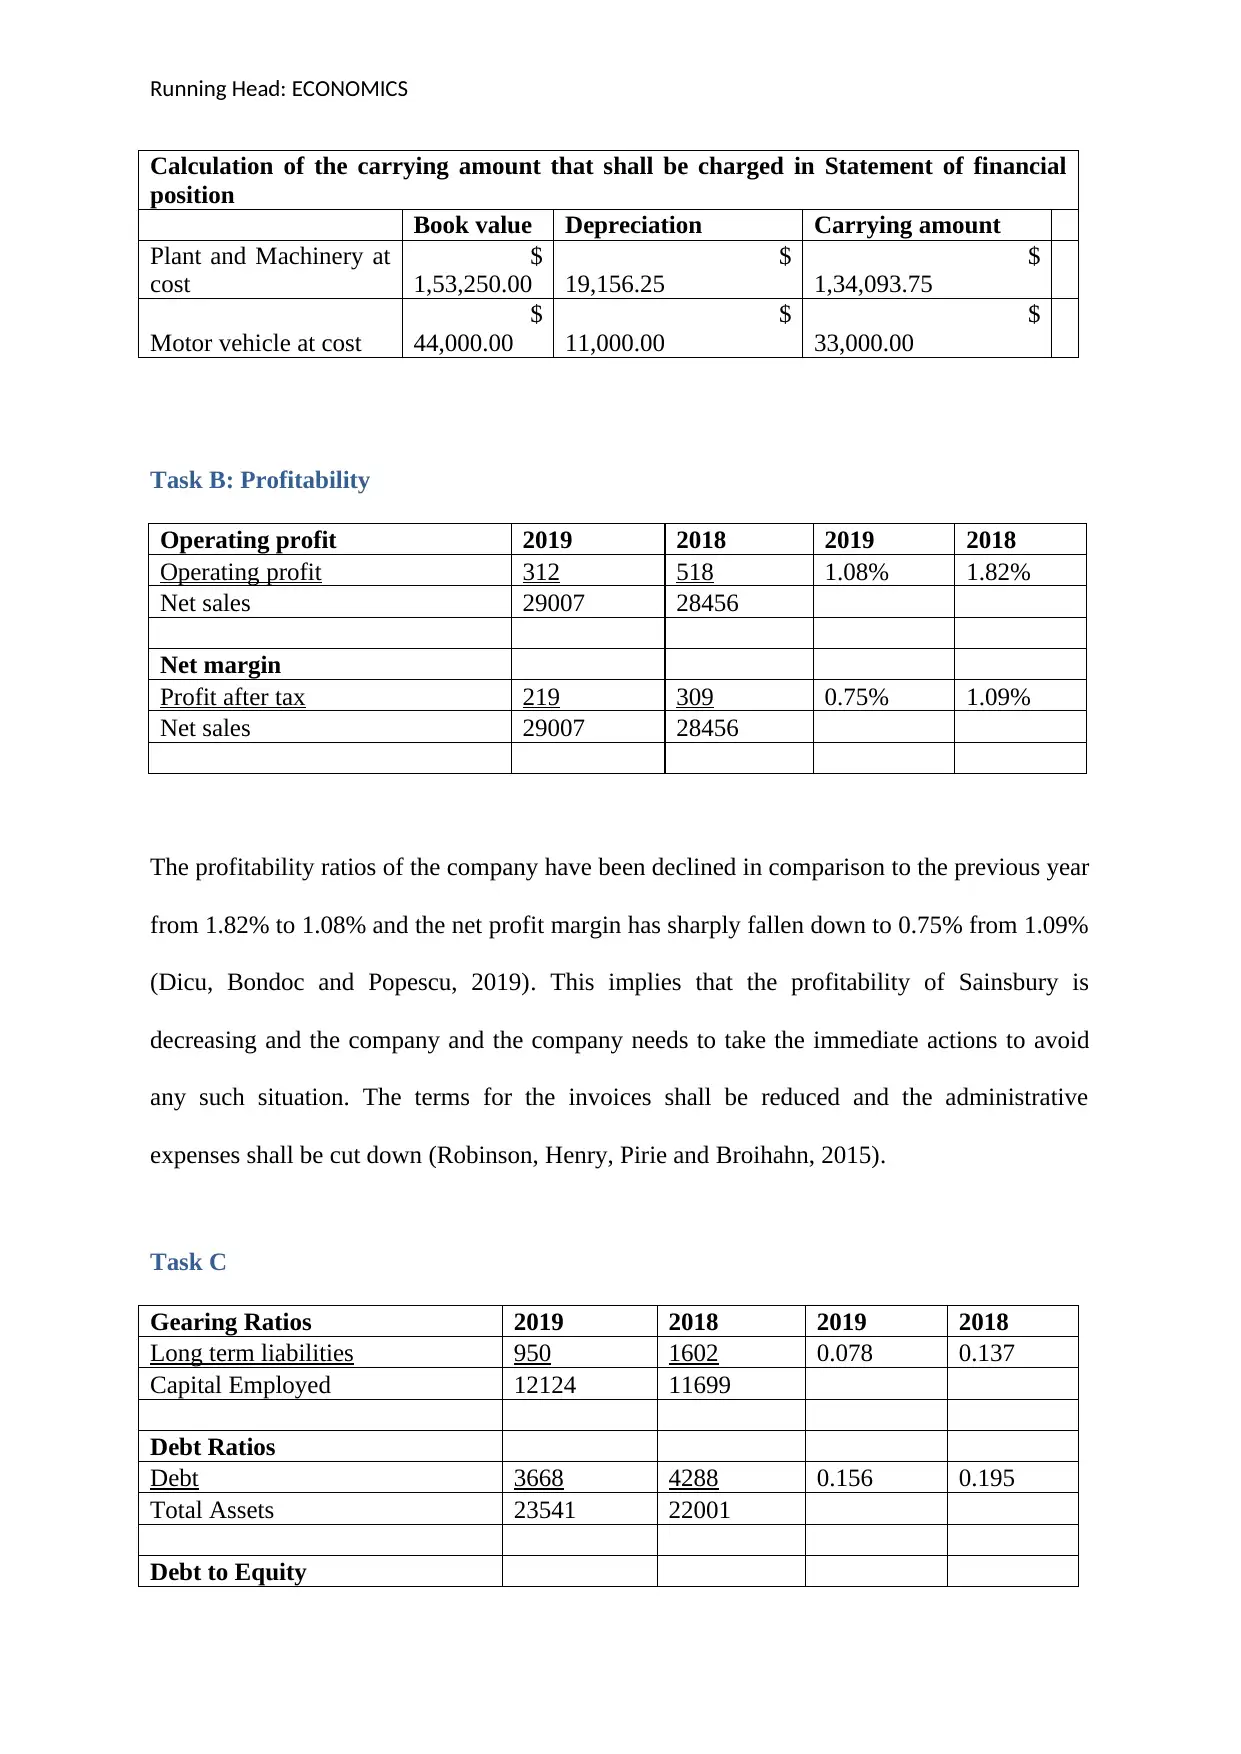
This assignment analyzes the financial performance of Sainsbury's Group Plc based on its 2019 financial statements, as part of the ACFI1203 course. It begins with the calculation of depreciation for plant and machinery and motor vehicles, determining carrying amounts. The assignment then examines Sainsbury's profitability, comparing operating profit and net profit margins for 2018 and 2019, revealing a decline in profitability ratios. Gearing ratios are then calculated and interpreted, assessing the company's financial leverage and debt-to-equity ratio, indicating a reduction in financial burden and increased equity. Finally, the cash conversion cycle is analyzed, revealing a negative cycle, indicating that the company is not efficiently managing its cash flows. The assignment provides a detailed analysis of the company's financial position, including key financial ratios and their implications.
tabler-icon-diamond-filled.svg

Contribute Materials

Your contribution can guide someone’s learning journey. Share your documents today.
Document Page
Running Head: ECONOMICS 1
ECONOMICS
tabler-icon-diamond-filled.svg

Secure Best Marks with AI Grader

Need help grading? Try our AI Grader for instant feedback on your assignments.
Document Page
Running Head: ECONOMICS
Contents
Task A...................................................................................................................................................3
Task 1: Calculation of the depreciation to be charged to Statement of profit and loss Account............3
Task 2: Carrying amount.......................................................................................................................3
Task B: Profitability..............................................................................................................................4
Task C...................................................................................................................................................4
Task D: Cash Conversion Cycle............................................................................................................5
References.............................................................................................................................................7
Document Page
Running Head: ECONOMICS
Task A
Task 1: Calculation of the depreciation to be charged to Statement of profit and loss
Account
Calculation of the annual depreciation that shall be charged to profit and loss account
Particulars Cost
Depreciation
method
Depreciation
charged
Plant and Machinery
at cost
$
1,53,250.00 Straight line
$
19,156.25 153250/8
Motor vehicle at cost
$
44,000.00 Reducing balance
$
11,000.00
44000*2
0%
Therefore, from the above table it can be stated that the amount of the depreciation on plant
and machinery will be $19156 whereas on motor vehicle will be $11000. Together while
transferring it to the income statement, the balance will be $30156 (Zeidan and Shapir, 2017).
Task 2: Carrying amount
The carrying amount of non-current assets is usually not included in the balance sheet and it
is always lower than the current market value. The formula of carrying amount is
Purchase price – Depreciation – Impairment
In case of plant and machinery the carrying amount that is charged to the statement of the
financial position as at 30th September 2019 are defined below.
Document Page
Running Head: ECONOMICS
Calculation of the carrying amount that shall be charged in Statement of financial
position
Book value Depreciation Carrying amount
Plant and Machinery at
cost
$
1,53,250.00
$
19,156.25
$
1,34,093.75
Motor vehicle at cost
$
44,000.00
$
11,000.00
$
33,000.00
Task B: Profitability
Operating profit 2019 2018 2019 2018
Operating profit 312 518 1.08% 1.82%
Net sales 29007 28456
Net margin
Profit after tax 219 309 0.75% 1.09%
Net sales 29007 28456
The profitability ratios of the company have been declined in comparison to the previous year
from 1.82% to 1.08% and the net profit margin has sharply fallen down to 0.75% from 1.09%
(Dicu, Bondoc and Popescu, 2019). This implies that the profitability of Sainsbury is
decreasing and the company and the company needs to take the immediate actions to avoid
any such situation. The terms for the invoices shall be reduced and the administrative
expenses shall be cut down (Robinson, Henry, Pirie and Broihahn, 2015).
Task C
Gearing Ratios 2019 2018 2019 2018
Long term liabilities 950 1602 0.078 0.137
Capital Employed 12124 11699
Debt Ratios
Debt 3668 4288 0.156 0.195
Total Assets 23541 22001
Debt to Equity
tabler-icon-diamond-filled.svg

Secure Best Marks with AI Grader

Need help grading? Try our AI Grader for instant feedback on your assignments.
Document Page
Running Head: ECONOMICS
Debt 3668 4288 0.461 0.620
Equity 7960 6915
Gearing ratios are the ratios that are covered with the liabilities and define and measures the
financial leverage of the business. The ratio decreased from 0.137 to 0.078 times and this
indicates that the company has reduced the financial burden from themselves. The debt to
equity ratio of the company overall has been reduced from 0.19 to 0.15 times and this is a
good start to take off the company from excessive leverage, however, the company must take
the risks with core analysis and supervision so that it shall not affect the profitability position
of the company. The assets shall be used efficiently and effectively. The debt to equity ratio
has decreased from 0.62 to 0.46 times and this again defines that the company is more
interested in equity (Williams and Dobelman, 2017).
Task D: Cash Conversion Cycle
Cash conversion cycle is a metric that is used to measure the time taken by the company for
the purpose of conversion of investments in inventory and the other resources into cash flows
from sales. The cash conversion cycle is also known as Net operating cycle is used to figure
out how well the company is performing in collecting the cash. The combination of the
inventory, receivables and the accounts payable is one of the measures that are used by the
company to figure out the inflow of the cash from the receivables and by sale of inventory to
pay back the creditors and supplier.
The formula for calculating the cash conversion cycle is presented below.
Days Inventory outstanding + Receivables days outstanding - Days Payables
Outstanding
Document Page
Running Head: ECONOMICS
The cash conversion cycle of Sainsbury is negative as the ratio of the inventory days along
with receivables outstanding is the not sufficient enough to pay back the creditor on time. the
cash cycle for the year 2018 is -25.063 days and -24.28 days and this implies the company
has hardly made any efforts towards the improvement and probably wants to keep the cash in
hand to define the better position of the company (Sainsbury, 2018).
Document Page
Running Head: ECONOMICS
References
Dicu, C., Bondoc, M. D., and Popescu, M. B. (2019) A Quantitative Approach To
Profitability Ratios. Scientific Bulletin-Economic Sciences, 18(1), pp 57-65.
Robinson, T. R., Henry, E., Pirie, W. L., and Broihahn, M. A. (2015) International financial
statement analysis. John Wiley and Sons.
Sainsbury, (2018) Annual Report [Online] Available from
https://www.about.sainsburys.co.uk/~/media/Files/S/Sainsburys/documents/reports-and-
presentations/annual-reports/sainsburys-ar2019.pdf [Accessed on 13th December 2019]
Williams, E. E., and Dobelman, J. A. (2017) Financial statement analysis. World Scientific
Book Chapters, pp 109-169.
Zeidan, R. and Shapir, O.M., (2017) Cash conversion cycle and value-enhancing operations:
Theory and evidence for a free lunch. Journal of Corporate Finance, 45, pp.203-219.
chevron_up_icon
1 out of 7
circle_padding
hide_on_mobile
zoom_out_icon
logo.png

Your All-in-One AI-Powered Toolkit for Academic Success.

Available 24*7 on WhatsApp / Email

[object Object]