Report: Financial Performance Analysis of Sainsbury's PLC (2015-2019)
VerifiedAdded on 2022/09/03
|36
|9609
|13
Report
AI Summary
This report provides a comprehensive financial analysis of Sainsbury's PLC, examining its performance over a five-year period (2015-2019). The analysis includes a detailed assessment of profitability, liquidity, efficiency, and gearing ratios, alongside horizontal and vertical trend analyses. The report compares Sainsbury's financial performance with its key competitor, Tesco, to provide valuable insights into the company's financial health and competitive position. The analysis utilizes data from financial statements, university databases, and other relevant sources. The report also includes recommendations for the board of directors, supported by critical discussions and academic references. Various appendices provide detailed ratio calculations, horizontal and vertical analyses, and graphical representations to support the findings and recommendations. The report offers a clear understanding of Sainsbury's financial strengths, weaknesses, and areas for improvement, guiding strategic decision-making.
Running head: MANAGE FINANCIAL PERFORMANCE
Manage Financial Performance
Name of the Student:
Name of the University:
Author’s Note:
Manage Financial Performance
Name of the Student:
Name of the University:
Author’s Note:
Paraphrase This Document
Need a fresh take? Get an instant paraphrase of this document with our AI Paraphraser
1MANAGE FINANCIAL PERFORMANCE
Table of Contents
Introduction......................................................................................................................................2
Financial Ratio Analysis: Profitability Ratio:..................................................................................2
Financial Ratio Analysis: Liquidity Ratio.......................................................................................5
Financial Ratio Analysis: Efficiency Ratio.....................................................................................6
Financial Ratio Analysis: Gearing Ratio.........................................................................................8
Conclusion and Recommendations..................................................................................................9
References......................................................................................................................................10
Appendix A: Financial Ratio Analysis..........................................................................................12
Appendix B: Vertical Statement Analysis of Sainsbury................................................................13
Appendix C: Vertical Statement Analysis: TESCO Company......................................................17
Appendix D: Horizontal Statement Analysis: Sainsbury Plc........................................................22
Appendix E: Horizontal Statement Analysis: TESCO Company..................................................26
Appendix F: Sainsbury Key Ratio.................................................................................................30
2MANAGE FINANCIAL PERFORMANCE
To: Board of Directors of Sainsbury PLC
From: Reporting Accountant
Date: 30th December 2019.
Introduction
The financial analysis of the Sainsbury Plc has been done for a sum of last five years whereby
relevant changes in the financials of the Company has been well accounted and taken into
consideration. The key competitors of the company include TESCO, both the analyzed company
operates as a multinational grocery company operating in the retail industry. The financial
analysis for the Sainsbury Company in particular would be done using ratio analysis whereby
liquidity, profitability, efficiency and activity ratios would be analyzed for the company in
particular (Guo and Wang 2019).
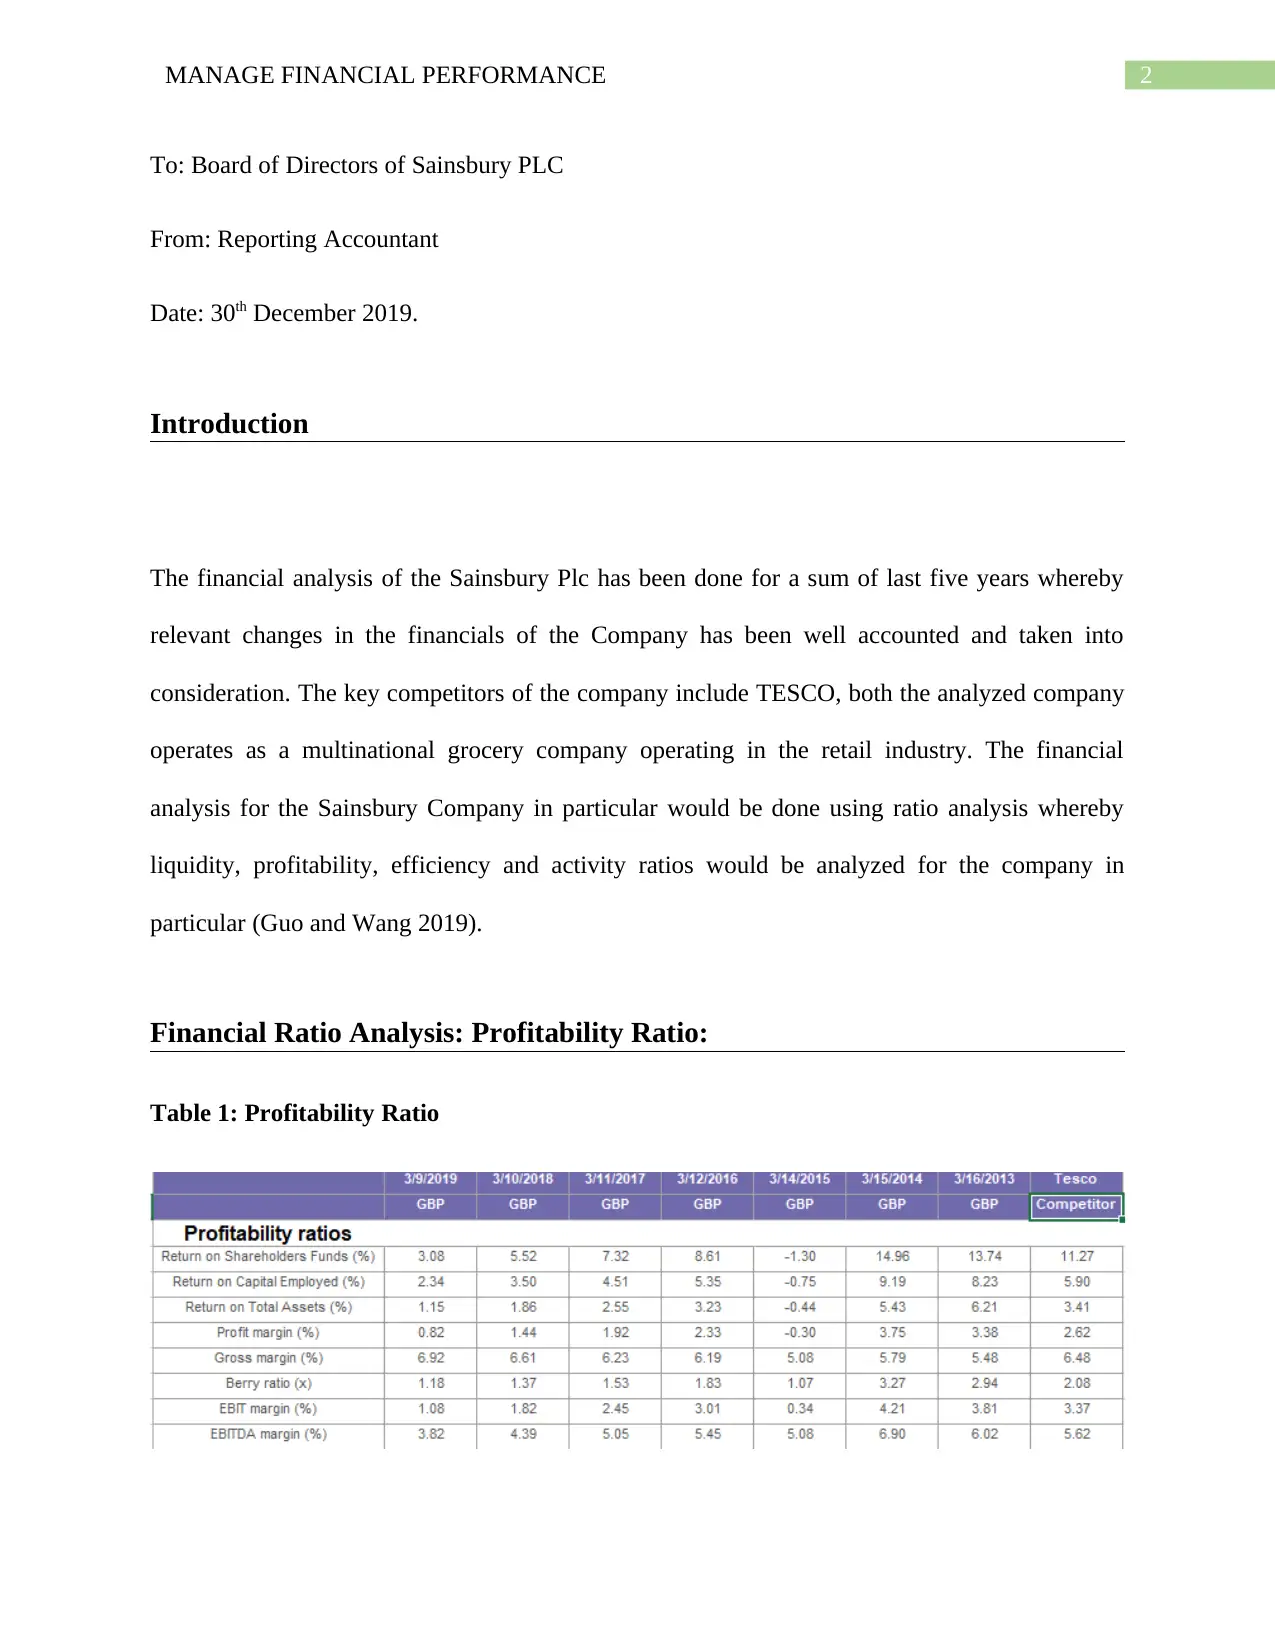
Financial Ratio Analysis: Profitability Ratio:
Table 1: Profitability Ratio
To: Board of Directors of Sainsbury PLC
From: Reporting Accountant
Date: 30th December 2019.
Introduction
The financial analysis of the Sainsbury Plc has been done for a sum of last five years whereby
relevant changes in the financials of the Company has been well accounted and taken into
consideration. The key competitors of the company include TESCO, both the analyzed company
operates as a multinational grocery company operating in the retail industry. The financial
analysis for the Sainsbury Company in particular would be done using ratio analysis whereby
liquidity, profitability, efficiency and activity ratios would be analyzed for the company in
particular (Guo and Wang 2019).
Financial Ratio Analysis: Profitability Ratio:
Table 1: Profitability Ratio
⊘ This is a preview!⊘
Do you want full access?
Subscribe today to unlock all pages.
Trusted by 1+ million students worldwide
3MANAGE FINANCIAL PERFORMANCE
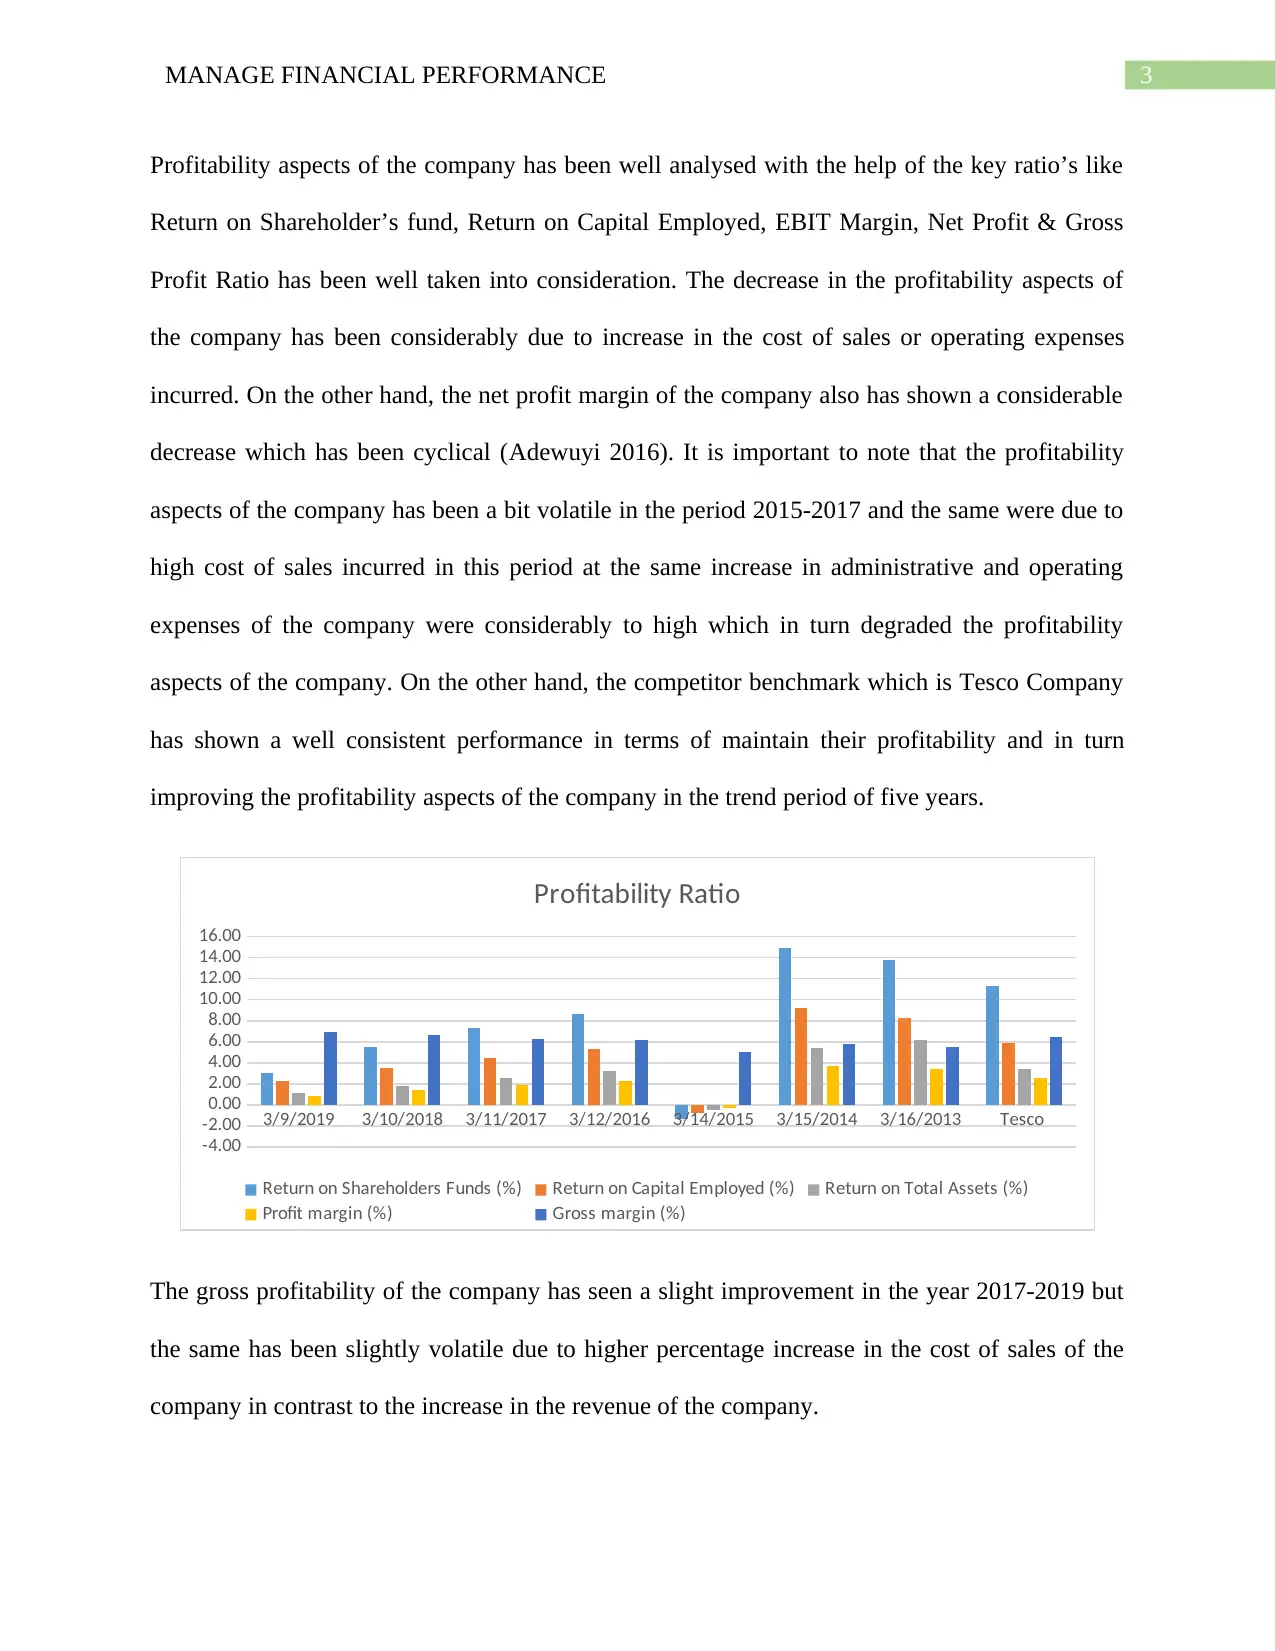
Profitability aspects of the company has been well analysed with the help of the key ratio’s like
Return on Shareholder’s fund, Return on Capital Employed, EBIT Margin, Net Profit & Gross
Profit Ratio has been well taken into consideration. The decrease in the profitability aspects of
the company has been considerably due to increase in the cost of sales or operating expenses
incurred. On the other hand, the net profit margin of the company also has shown a considerable
decrease which has been cyclical (Adewuyi 2016). It is important to note that the profitability
aspects of the company has been a bit volatile in the period 2015-2017 and the same were due to
high cost of sales incurred in this period at the same increase in administrative and operating
expenses of the company were considerably to high which in turn degraded the profitability
aspects of the company. On the other hand, the competitor benchmark which is Tesco Company
has shown a well consistent performance in terms of maintain their profitability and in turn
improving the profitability aspects of the company in the trend period of five years.
3/9/2019 3/10/2018 3/11/2017 3/12/2016 3/14/2015 3/15/2014 3/16/2013 Tesco
-4.00
-2.00
0.00
2.00
4.00
6.00
8.00
10.00
12.00
14.00
16.00
Profitability Ratio
Return on Shareholders Funds (%) Return on Capital Employed (%) Return on Total Assets (%)
Profit margin (%) Gross margin (%)
The gross profitability of the company has seen a slight improvement in the year 2017-2019 but
the same has been slightly volatile due to higher percentage increase in the cost of sales of the
company in contrast to the increase in the revenue of the company.
Paraphrase This Document
Need a fresh take? Get an instant paraphrase of this document with our AI Paraphraser
4MANAGE FINANCIAL PERFORMANCE
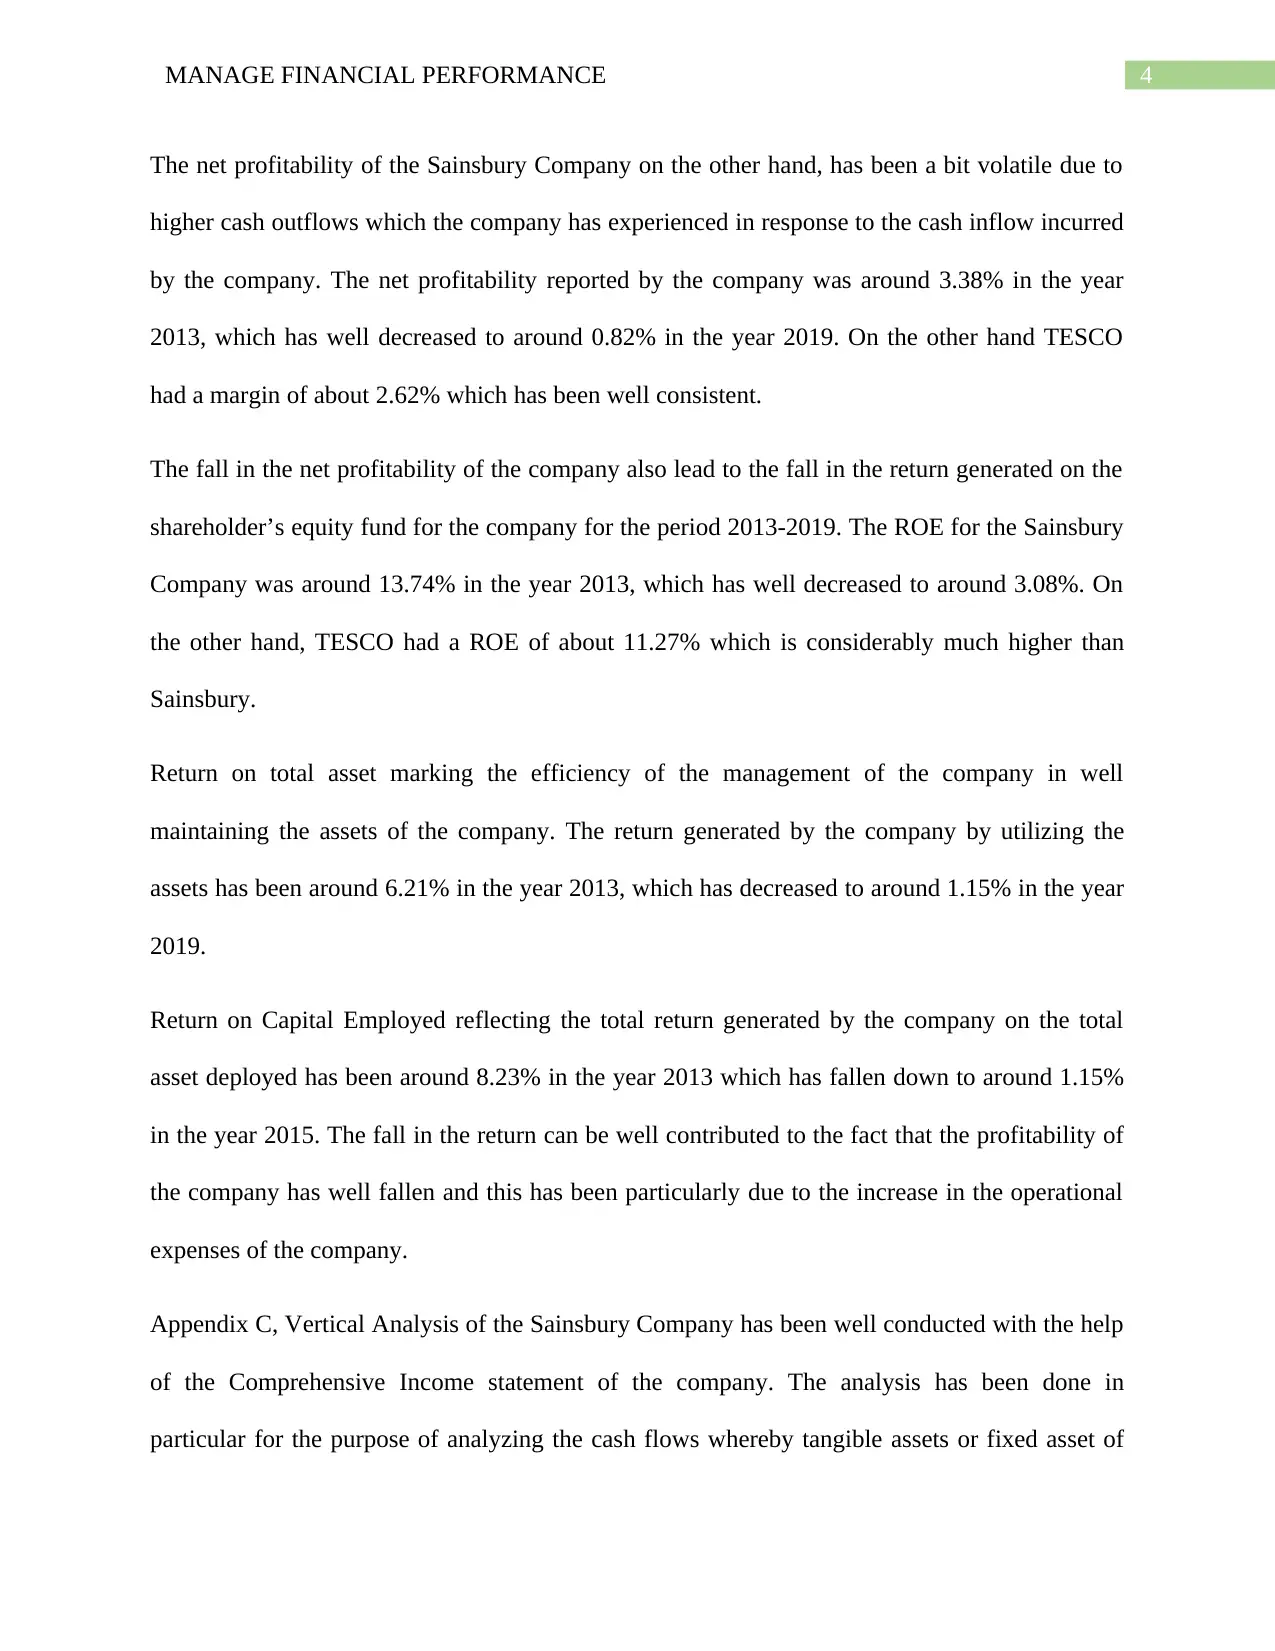
The net profitability of the Sainsbury Company on the other hand, has been a bit volatile due to
higher cash outflows which the company has experienced in response to the cash inflow incurred
by the company. The net profitability reported by the company was around 3.38% in the year
2013, which has well decreased to around 0.82% in the year 2019. On the other hand TESCO
had a margin of about 2.62% which has been well consistent.
The fall in the net profitability of the company also lead to the fall in the return generated on the
shareholder’s equity fund for the company for the period 2013-2019. The ROE for the Sainsbury
Company was around 13.74% in the year 2013, which has well decreased to around 3.08%. On
the other hand, TESCO had a ROE of about 11.27% which is considerably much higher than
Sainsbury.
Return on total asset marking the efficiency of the management of the company in well
maintaining the assets of the company. The return generated by the company by utilizing the
assets has been around 6.21% in the year 2013, which has decreased to around 1.15% in the year
2019.
Return on Capital Employed reflecting the total return generated by the company on the total
asset deployed has been around 8.23% in the year 2013 which has fallen down to around 1.15%
in the year 2015. The fall in the return can be well contributed to the fact that the profitability of
the company has well fallen and this has been particularly due to the increase in the operational
expenses of the company.
Appendix C, Vertical Analysis of the Sainsbury Company has been well conducted with the help
of the Comprehensive Income statement of the company. The analysis has been done in
particular for the purpose of analyzing the cash flows whereby tangible assets or fixed asset of
5MANAGE FINANCIAL PERFORMANCE
the company comprised of almost 84.92% of the total assets reported which has decreased to
around 66.39% in the year 2019. On the other hand, TESCO has maintained the proportion
between non-current asset to current asset to 75:25 ratio.
The profitability ratios analyzed for the Tesco Company has been well analyzed which states
from the above analysis that the Sainsbury Company must take crucial steps in well improving
the profitability position of the company. Controlling expenses and increasing the revenue base
by diversifying the product base can be the best available option for the management.
Financial Ratio Analysis: Liquidity Ratio
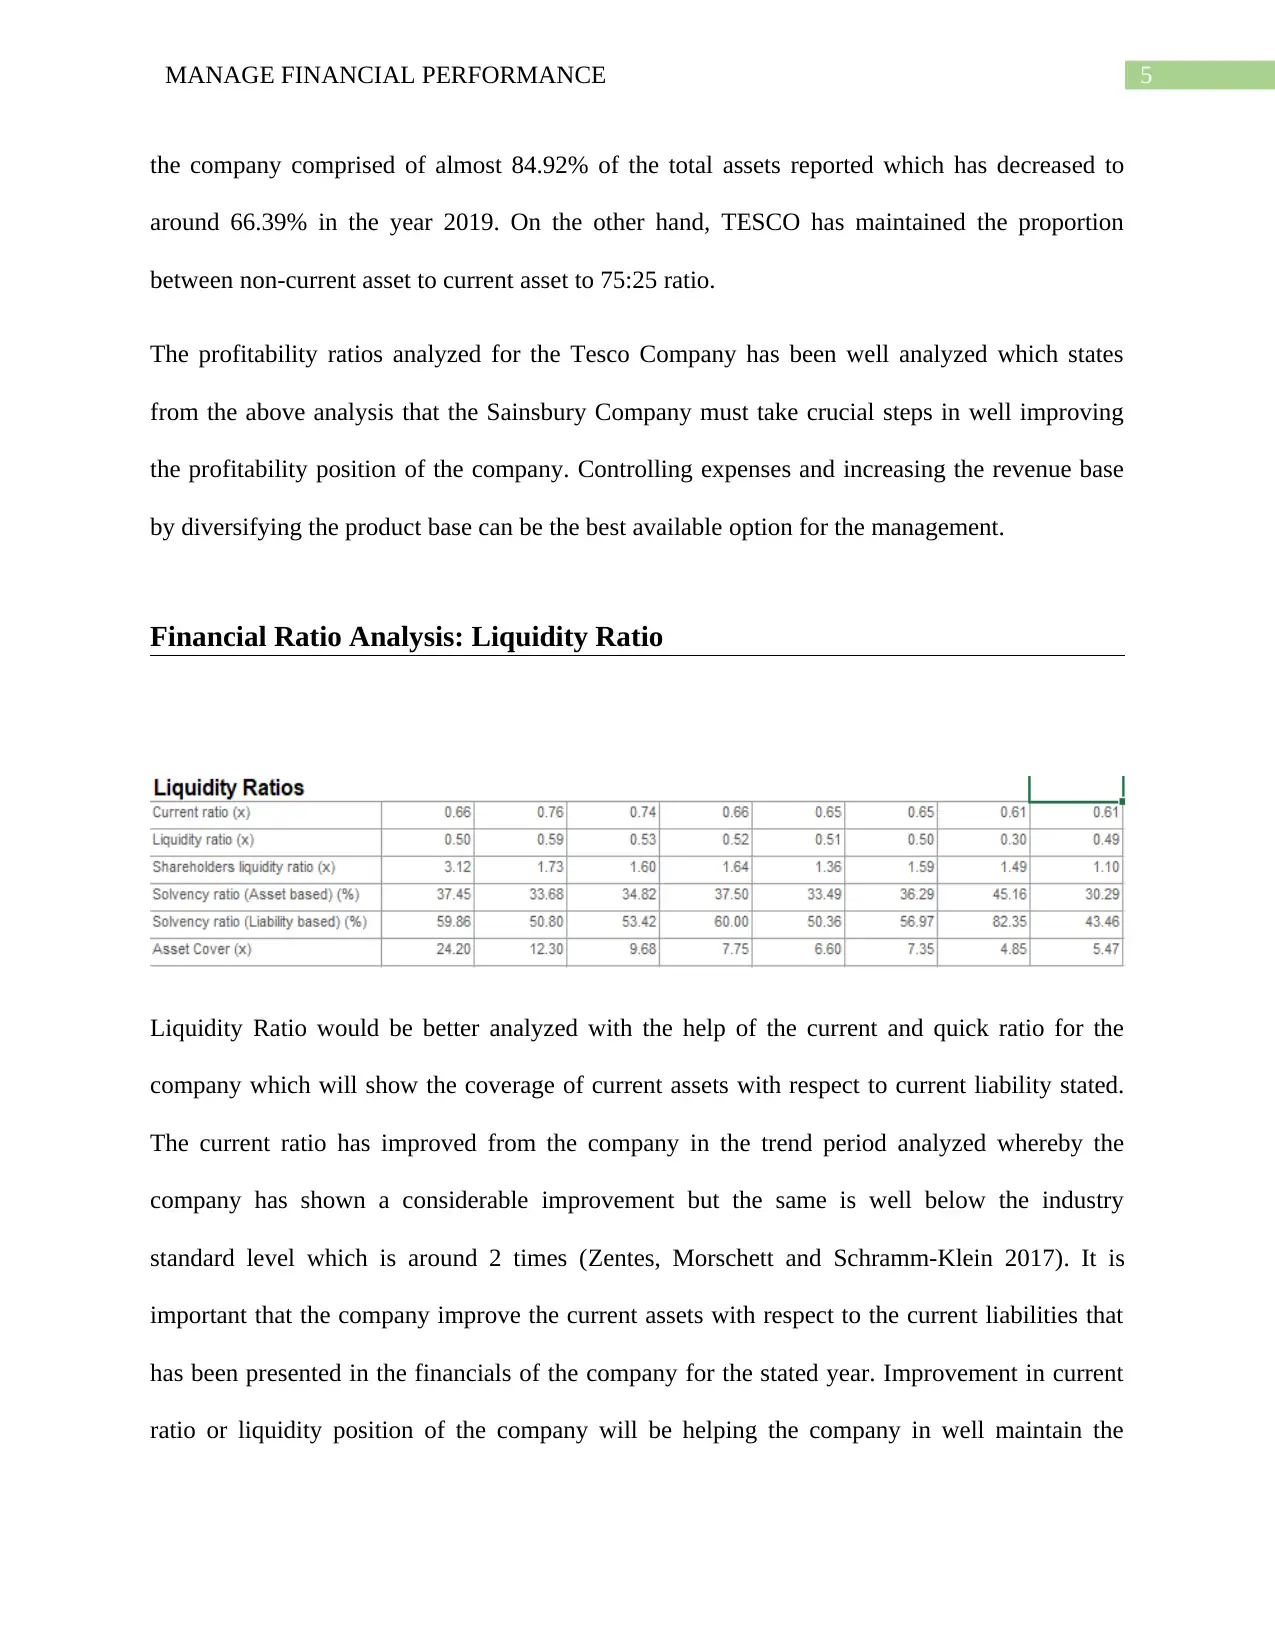
Liquidity Ratio would be better analyzed with the help of the current and quick ratio for the
company which will show the coverage of current assets with respect to current liability stated.
The current ratio has improved from the company in the trend period analyzed whereby the
company has shown a considerable improvement but the same is well below the industry
standard level which is around 2 times (Zentes, Morschett and Schramm-Klein 2017). It is
important that the company improve the current assets with respect to the current liabilities that
has been presented in the financials of the company for the stated year. Improvement in current
ratio or liquidity position of the company will be helping the company in well maintain the
the company comprised of almost 84.92% of the total assets reported which has decreased to
around 66.39% in the year 2019. On the other hand, TESCO has maintained the proportion
between non-current asset to current asset to 75:25 ratio.
The profitability ratios analyzed for the Tesco Company has been well analyzed which states
from the above analysis that the Sainsbury Company must take crucial steps in well improving
the profitability position of the company. Controlling expenses and increasing the revenue base
by diversifying the product base can be the best available option for the management.
Financial Ratio Analysis: Liquidity Ratio
Liquidity Ratio would be better analyzed with the help of the current and quick ratio for the
company which will show the coverage of current assets with respect to current liability stated.
The current ratio has improved from the company in the trend period analyzed whereby the
company has shown a considerable improvement but the same is well below the industry
standard level which is around 2 times (Zentes, Morschett and Schramm-Klein 2017). It is
important that the company improve the current assets with respect to the current liabilities that
has been presented in the financials of the company for the stated year. Improvement in current
ratio or liquidity position of the company will be helping the company in well maintain the
⊘ This is a preview!⊘
Do you want full access?
Subscribe today to unlock all pages.
Trusted by 1+ million students worldwide
6MANAGE FINANCIAL PERFORMANCE
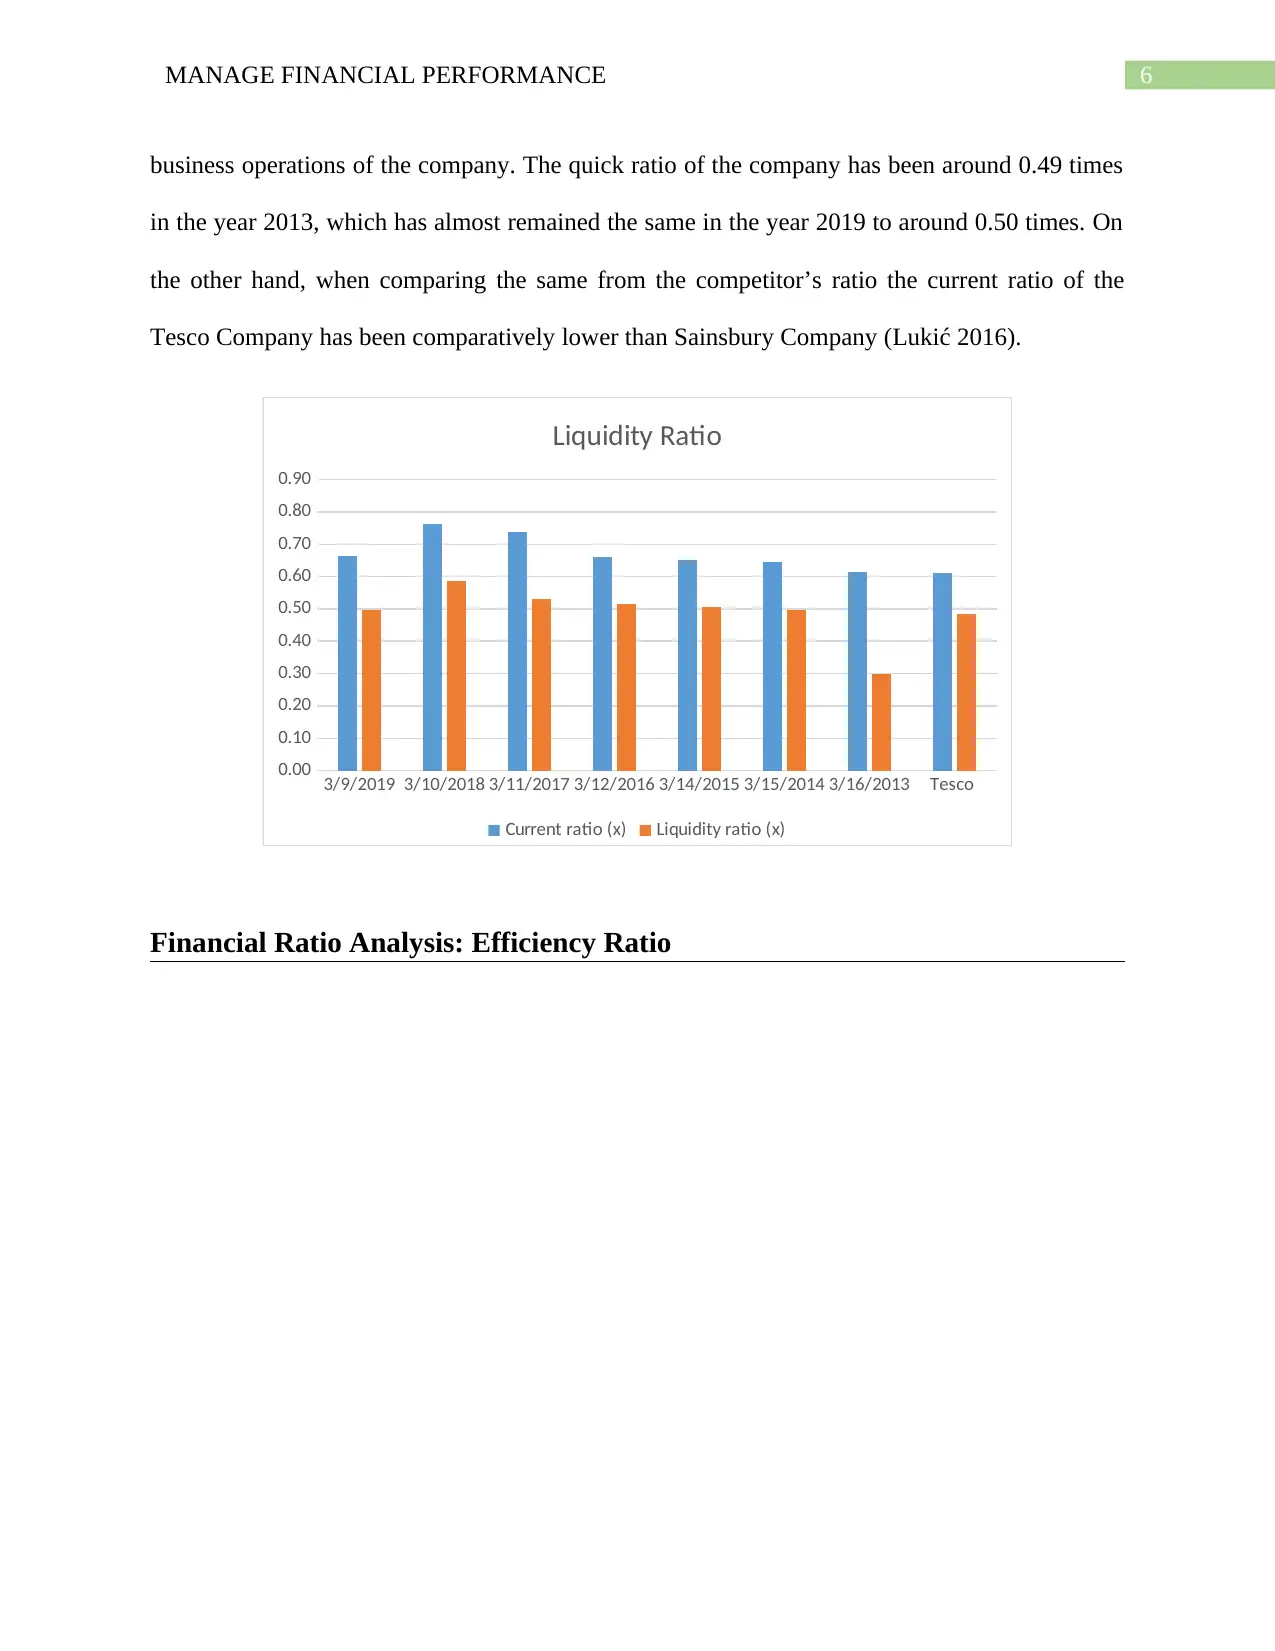
business operations of the company. The quick ratio of the company has been around 0.49 times
in the year 2013, which has almost remained the same in the year 2019 to around 0.50 times. On
the other hand, when comparing the same from the competitor’s ratio the current ratio of the
Tesco Company has been comparatively lower than Sainsbury Company (Lukić 2016).
3/9/2019 3/10/2018 3/11/2017 3/12/2016 3/14/2015 3/15/2014 3/16/2013 Tesco
0.00
0.10
0.20
0.30
0.40
0.50
0.60
0.70
0.80
0.90
Liquidity Ratio
Current ratio (x) Liquidity ratio (x)
Financial Ratio Analysis: Efficiency Ratio
Paraphrase This Document
Need a fresh take? Get an instant paraphrase of this document with our AI Paraphraser
7MANAGE FINANCIAL PERFORMANCE
3/9/2019 3/10/2018 3/11/2017 3/12/2016 3/14/2015 3/15/2014 3/16/2013 Tesco
0.00
20.00
40.00
60.00
80.00
100.00
120.00
140.00
160.00
180.00
200.00
Efficiency Ratio
Net Assets Turnover (x) Fixed Assets Turnover (x) Interest Cover (x)
Stock Turnover (x) Debtors Turnover (x) Debtor Collection (days)
Creditors Payment (days)
Efficiency Ratios
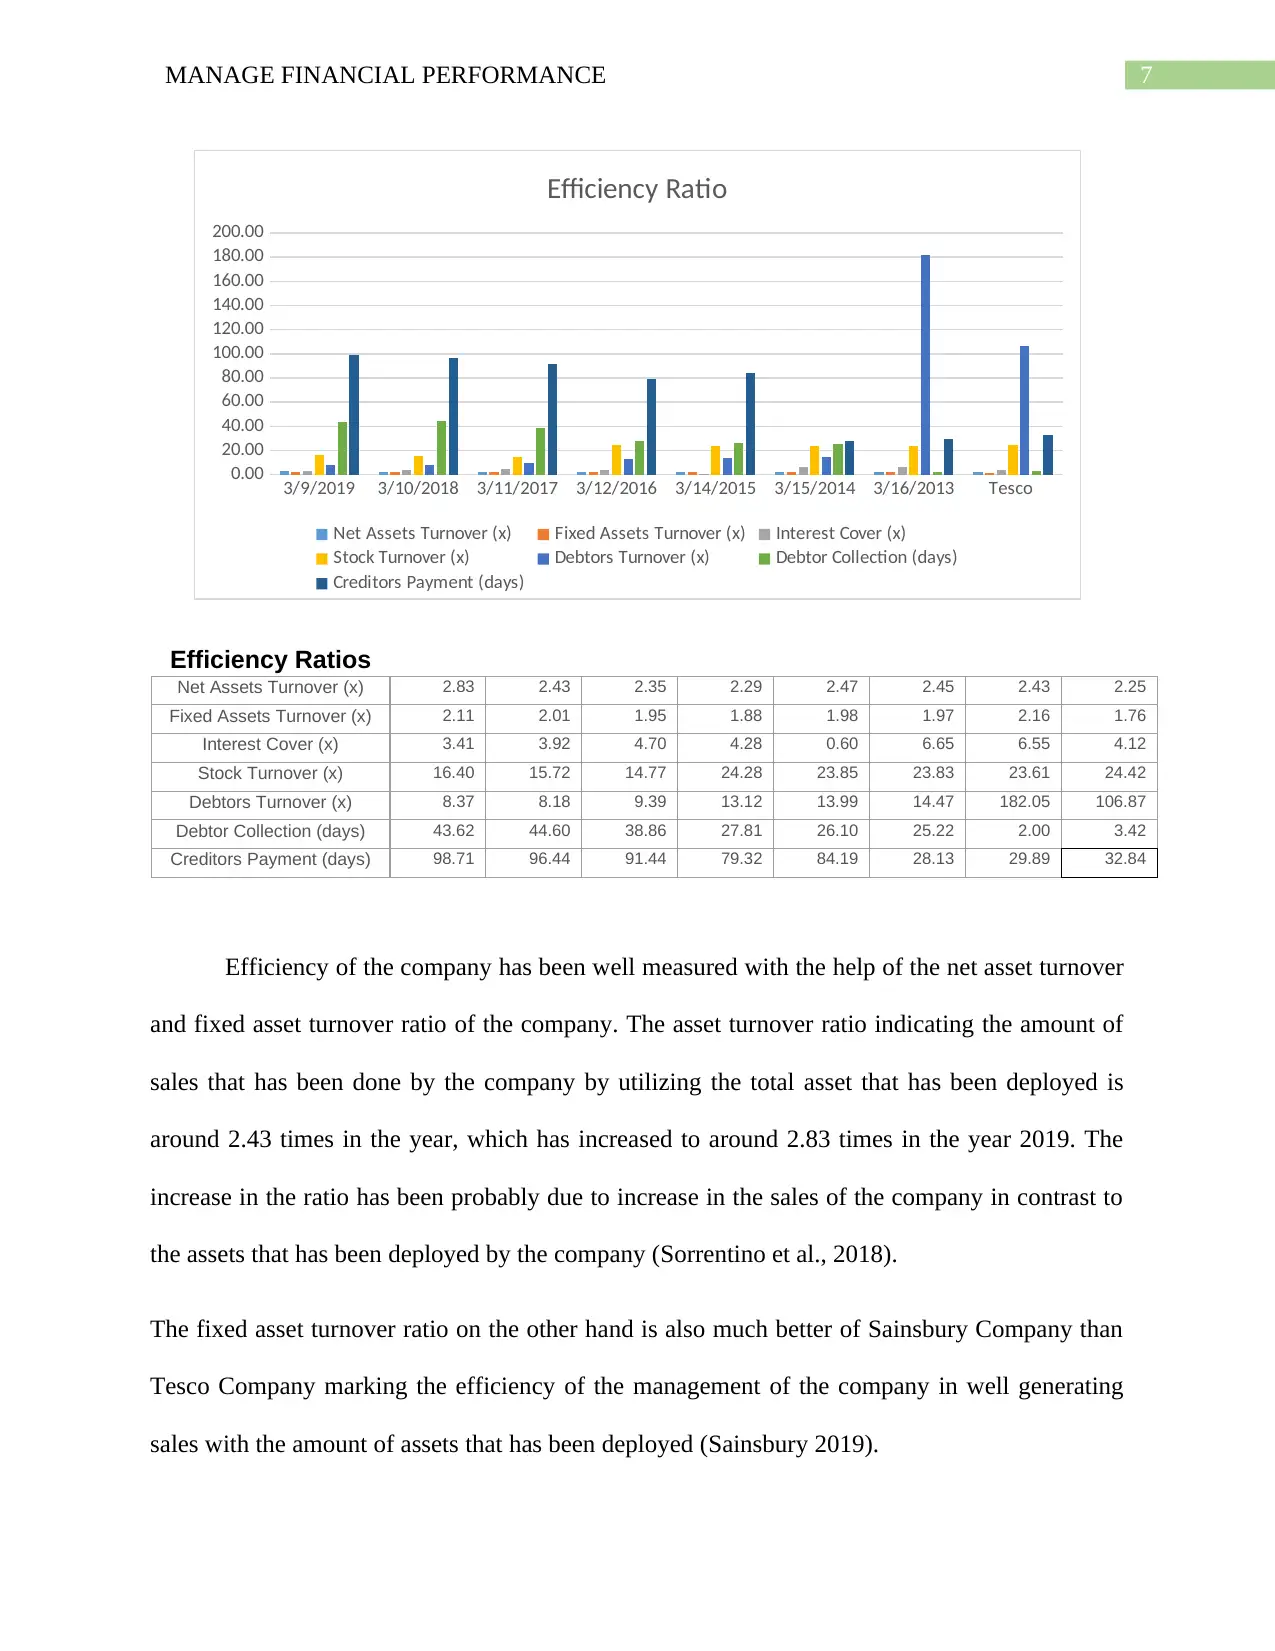
Net Assets Turnover (x) 2.83 2.43 2.35 2.29 2.47 2.45 2.43 2.25
Fixed Assets Turnover (x) 2.11 2.01 1.95 1.88 1.98 1.97 2.16 1.76
Interest Cover (x) 3.41 3.92 4.70 4.28 0.60 6.65 6.55 4.12
Stock Turnover (x) 16.40 15.72 14.77 24.28 23.85 23.83 23.61 24.42
Debtors Turnover (x) 8.37 8.18 9.39 13.12 13.99 14.47 182.05 106.87
Debtor Collection (days) 43.62 44.60 38.86 27.81 26.10 25.22 2.00 3.42
Creditors Payment (days) 98.71 96.44 91.44 79.32 84.19 28.13 29.89 32.84
Efficiency of the company has been well measured with the help of the net asset turnover
and fixed asset turnover ratio of the company. The asset turnover ratio indicating the amount of
sales that has been done by the company by utilizing the total asset that has been deployed is
around 2.43 times in the year, which has increased to around 2.83 times in the year 2019. The
increase in the ratio has been probably due to increase in the sales of the company in contrast to
the assets that has been deployed by the company (Sorrentino et al., 2018).
The fixed asset turnover ratio on the other hand is also much better of Sainsbury Company than
Tesco Company marking the efficiency of the management of the company in well generating
sales with the amount of assets that has been deployed (Sainsbury 2019).
3/9/2019 3/10/2018 3/11/2017 3/12/2016 3/14/2015 3/15/2014 3/16/2013 Tesco
0.00
20.00
40.00
60.00
80.00
100.00
120.00
140.00
160.00
180.00
200.00
Efficiency Ratio
Net Assets Turnover (x) Fixed Assets Turnover (x) Interest Cover (x)
Stock Turnover (x) Debtors Turnover (x) Debtor Collection (days)
Creditors Payment (days)
Efficiency Ratios
Net Assets Turnover (x) 2.83 2.43 2.35 2.29 2.47 2.45 2.43 2.25
Fixed Assets Turnover (x) 2.11 2.01 1.95 1.88 1.98 1.97 2.16 1.76
Interest Cover (x) 3.41 3.92 4.70 4.28 0.60 6.65 6.55 4.12
Stock Turnover (x) 16.40 15.72 14.77 24.28 23.85 23.83 23.61 24.42
Debtors Turnover (x) 8.37 8.18 9.39 13.12 13.99 14.47 182.05 106.87
Debtor Collection (days) 43.62 44.60 38.86 27.81 26.10 25.22 2.00 3.42
Creditors Payment (days) 98.71 96.44 91.44 79.32 84.19 28.13 29.89 32.84
Efficiency of the company has been well measured with the help of the net asset turnover
and fixed asset turnover ratio of the company. The asset turnover ratio indicating the amount of
sales that has been done by the company by utilizing the total asset that has been deployed is
around 2.43 times in the year, which has increased to around 2.83 times in the year 2019. The
increase in the ratio has been probably due to increase in the sales of the company in contrast to
the assets that has been deployed by the company (Sorrentino et al., 2018).
The fixed asset turnover ratio on the other hand is also much better of Sainsbury Company than
Tesco Company marking the efficiency of the management of the company in well generating
sales with the amount of assets that has been deployed (Sainsbury 2019).
8MANAGE FINANCIAL PERFORMANCE
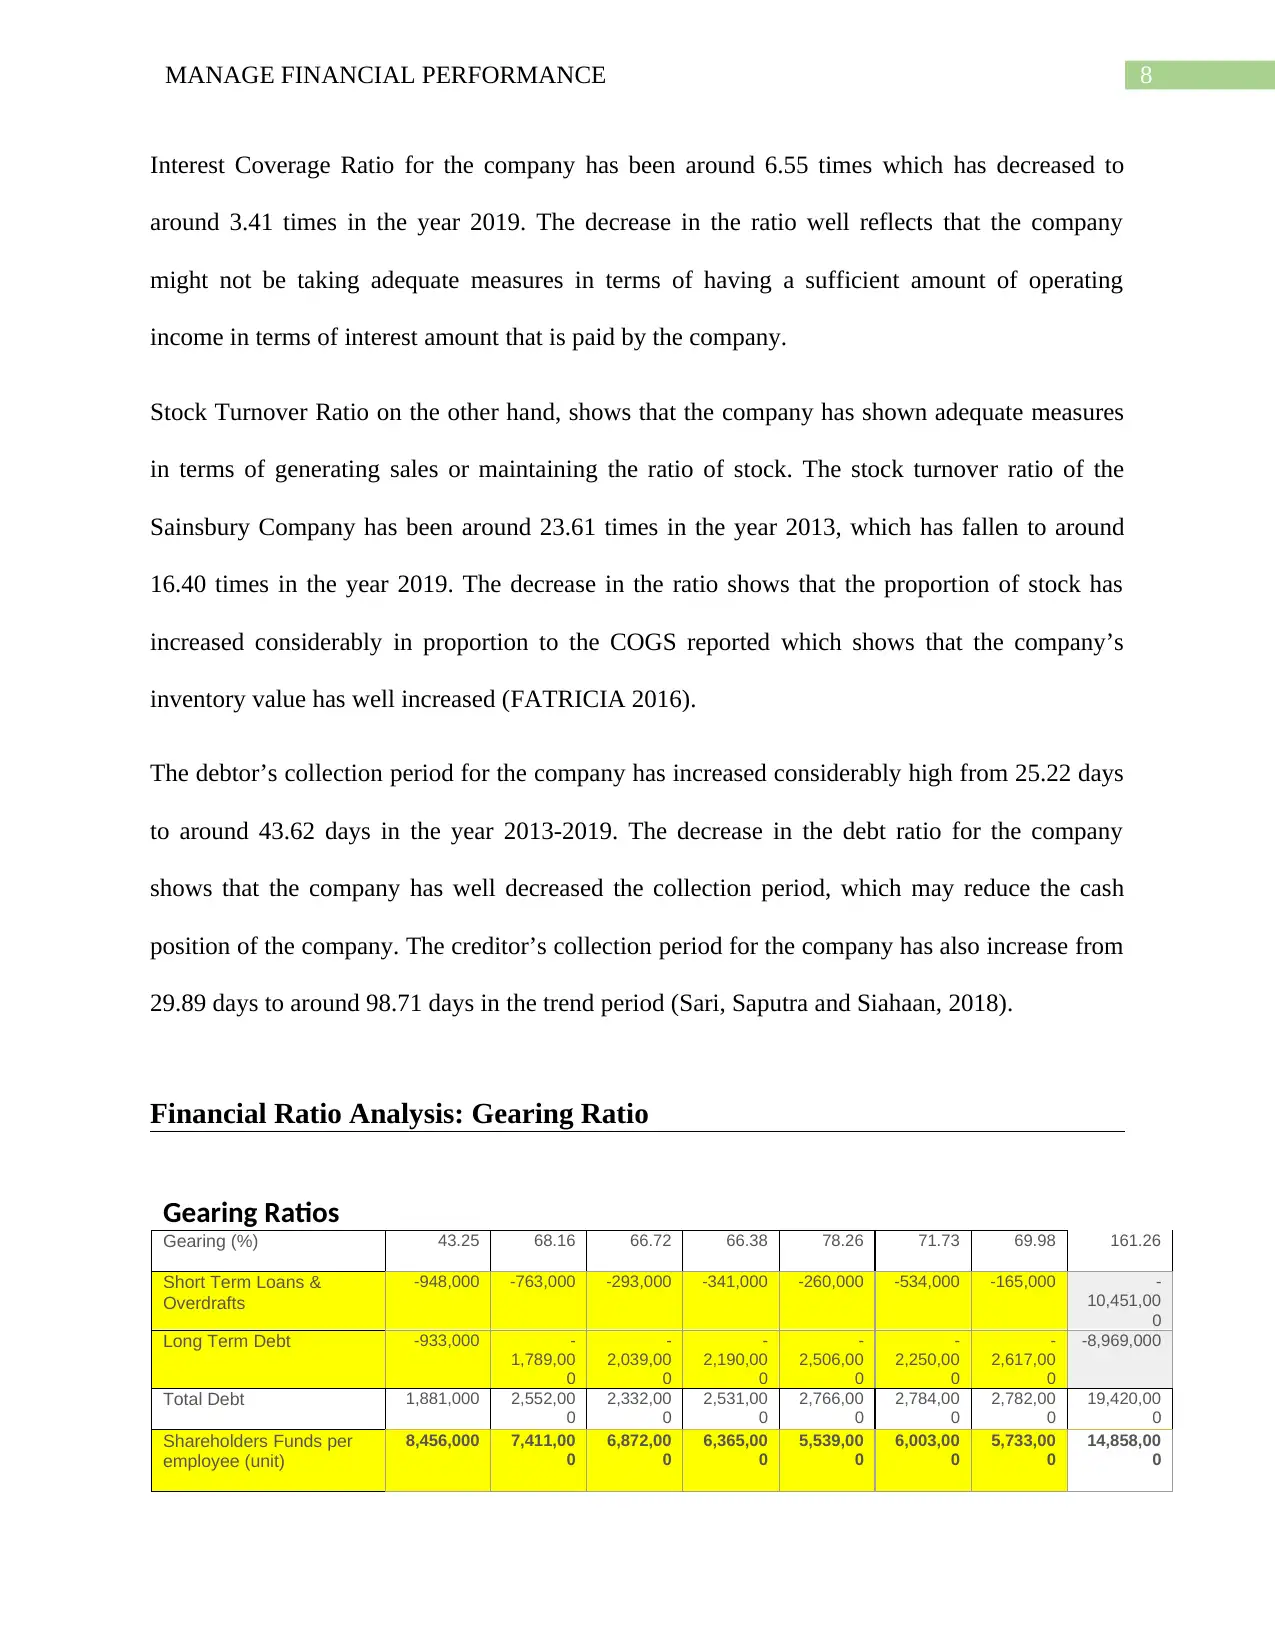
Interest Coverage Ratio for the company has been around 6.55 times which has decreased to
around 3.41 times in the year 2019. The decrease in the ratio well reflects that the company
might not be taking adequate measures in terms of having a sufficient amount of operating
income in terms of interest amount that is paid by the company.
Stock Turnover Ratio on the other hand, shows that the company has shown adequate measures
in terms of generating sales or maintaining the ratio of stock. The stock turnover ratio of the
Sainsbury Company has been around 23.61 times in the year 2013, which has fallen to around
16.40 times in the year 2019. The decrease in the ratio shows that the proportion of stock has
increased considerably in proportion to the COGS reported which shows that the company’s
inventory value has well increased (FATRICIA 2016).
The debtor’s collection period for the company has increased considerably high from 25.22 days
to around 43.62 days in the year 2013-2019. The decrease in the debt ratio for the company
shows that the company has well decreased the collection period, which may reduce the cash
position of the company. The creditor’s collection period for the company has also increase from
29.89 days to around 98.71 days in the trend period (Sari, Saputra and Siahaan, 2018).
Financial Ratio Analysis: Gearing Ratio
Gearing Ratios
Gearing (%) 43.25 68.16 66.72 66.38 78.26 71.73 69.98 161.26
Short Term Loans &
Overdrafts
-948,000 -763,000 -293,000 -341,000 -260,000 -534,000 -165,000 -
10,451,00
0
Long Term Debt -933,000 -
1,789,00
0
-
2,039,00
0
-
2,190,00
0
-
2,506,00
0
-
2,250,00
0
-
2,617,00
0
-8,969,000
Total Debt 1,881,000 2,552,00
0
2,332,00
0
2,531,00
0
2,766,00
0
2,784,00
0
2,782,00
0
19,420,00
0
Shareholders Funds per
employee (unit)
8,456,000 7,411,00
0
6,872,00
0
6,365,00
0
5,539,00
0
6,003,00
0
5,733,00
0
14,858,00
0
⊘ This is a preview!⊘
Do you want full access?
Subscribe today to unlock all pages.
Trusted by 1+ million students worldwide
9MANAGE FINANCIAL PERFORMANCE
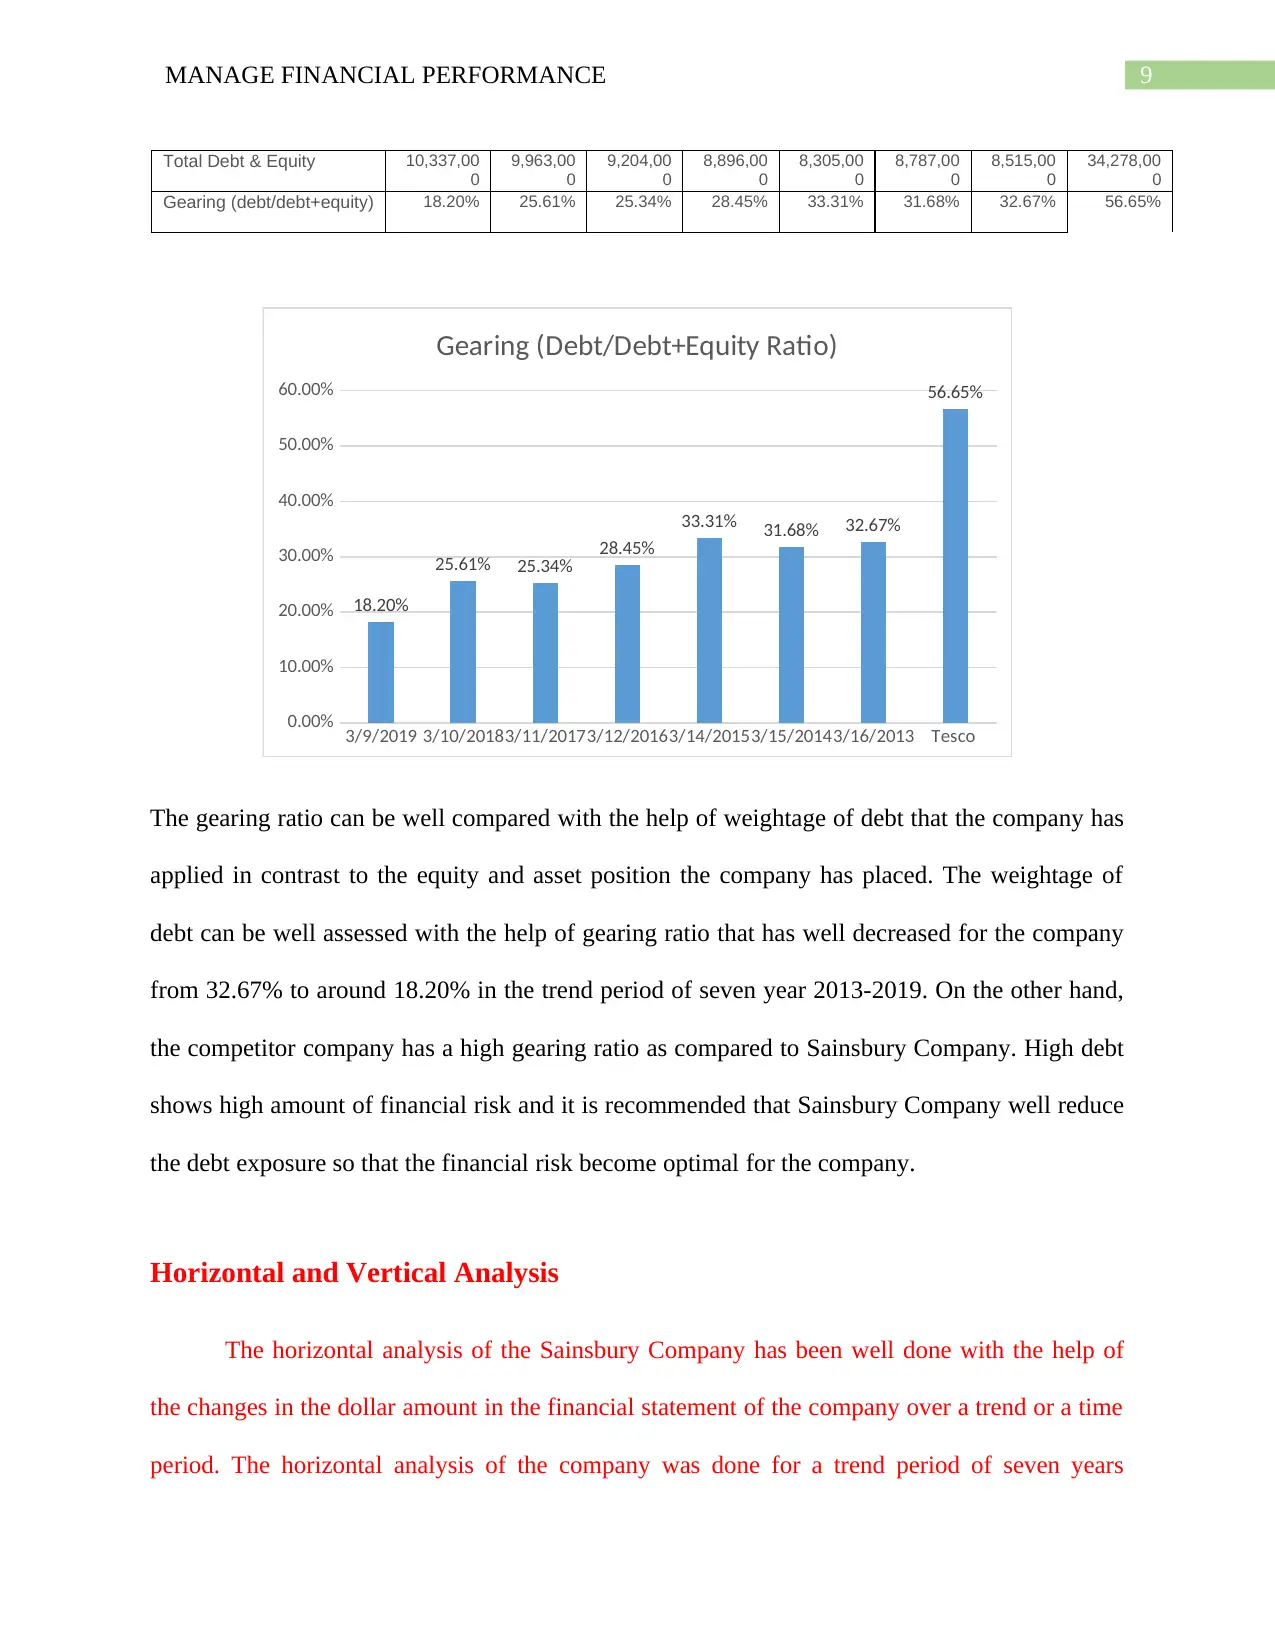
Total Debt & Equity 10,337,00
0
9,963,00
0
9,204,00
0
8,896,00
0
8,305,00
0
8,787,00
0
8,515,00
0
34,278,00
0
Gearing (debt/debt+equity) 18.20% 25.61% 25.34% 28.45% 33.31% 31.68% 32.67% 56.65%
3/9/2019 3/10/20183/11/20173/12/20163/14/20153/15/20143/16/2013 Tesco
0.00%
10.00%
20.00%
30.00%
40.00%
50.00%
60.00%
18.20%
25.61% 25.34% 28.45%
33.31% 31.68% 32.67%
56.65%
Gearing (Debt/Debt+Equity Ratio)
The gearing ratio can be well compared with the help of weightage of debt that the company has
applied in contrast to the equity and asset position the company has placed. The weightage of
debt can be well assessed with the help of gearing ratio that has well decreased for the company
from 32.67% to around 18.20% in the trend period of seven year 2013-2019. On the other hand,
the competitor company has a high gearing ratio as compared to Sainsbury Company. High debt
shows high amount of financial risk and it is recommended that Sainsbury Company well reduce
the debt exposure so that the financial risk become optimal for the company.
Horizontal and Vertical Analysis
The horizontal analysis of the Sainsbury Company has been well done with the help of
the changes in the dollar amount in the financial statement of the company over a trend or a time
period. The horizontal analysis of the company was done for a trend period of seven years
Paraphrase This Document
Need a fresh take? Get an instant paraphrase of this document with our AI Paraphraser
10MANAGE FINANCIAL PERFORMANCE
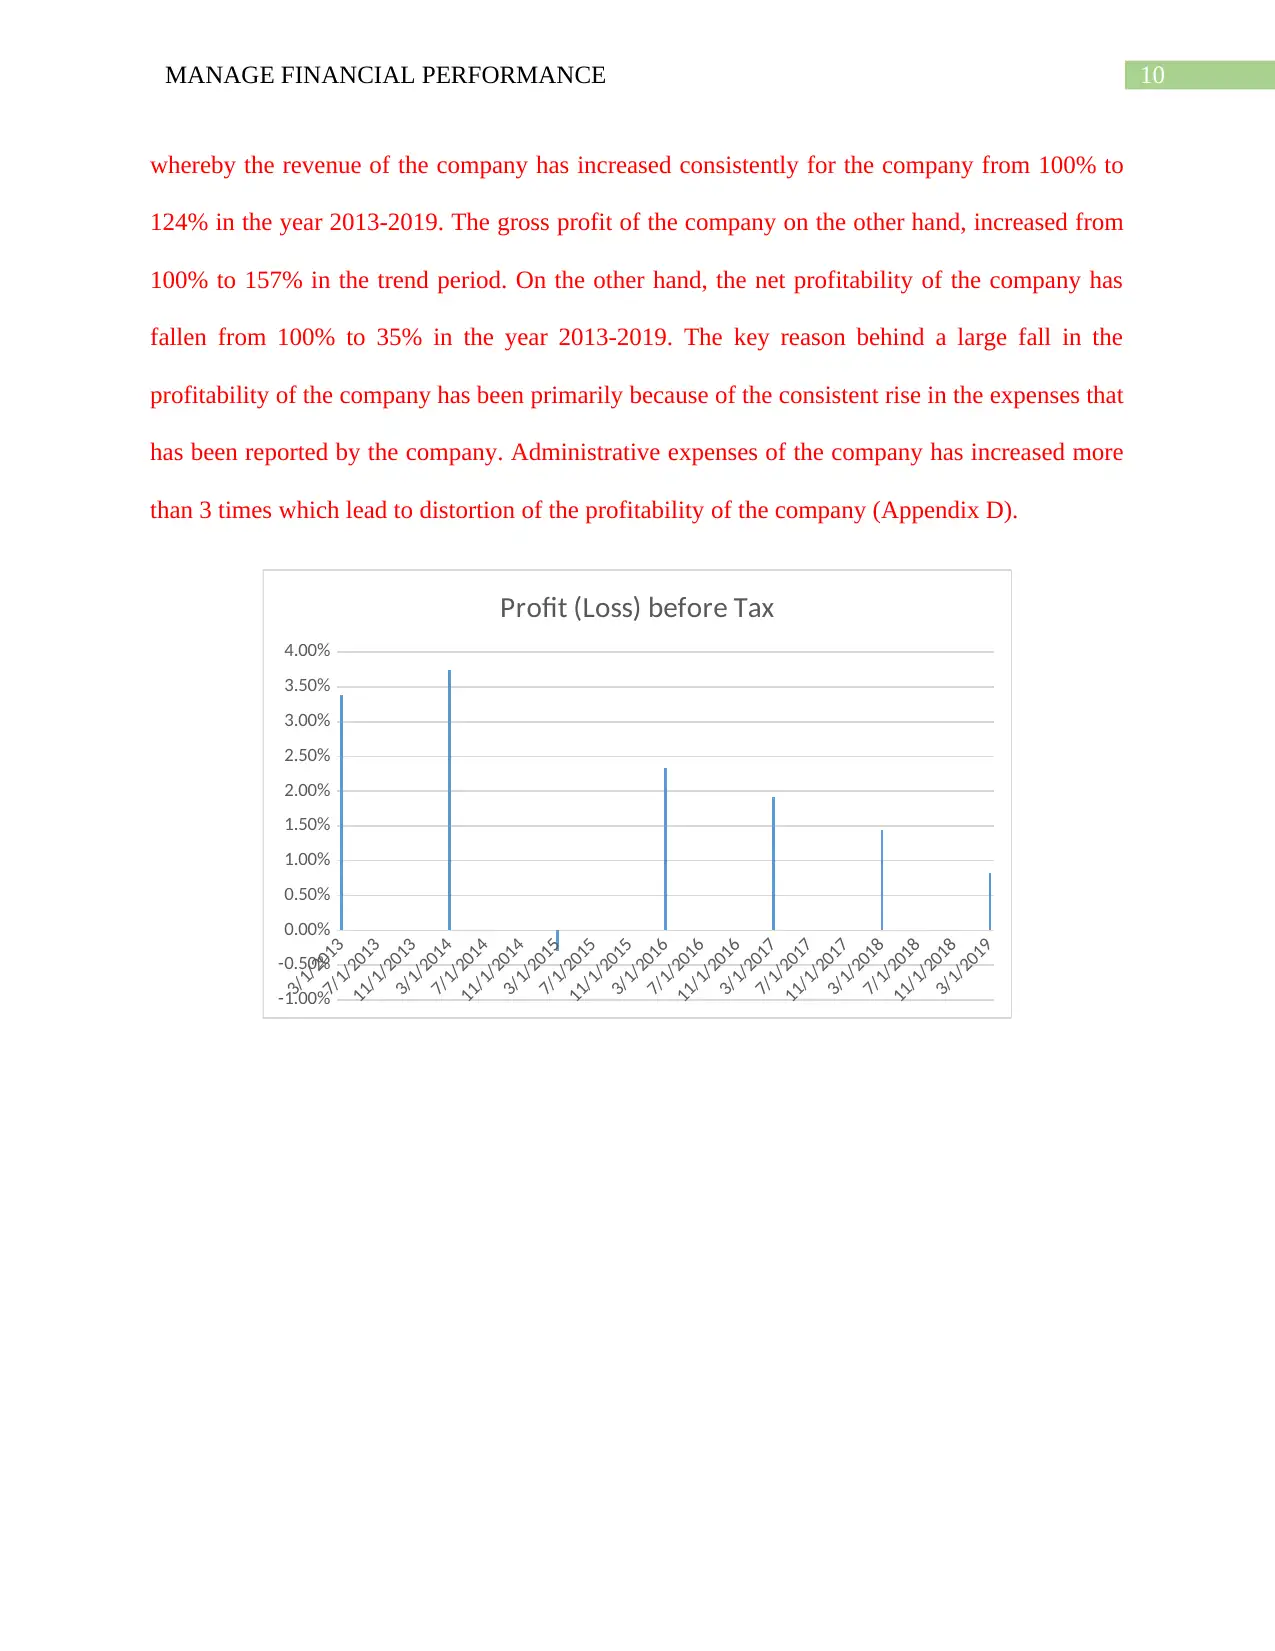
whereby the revenue of the company has increased consistently for the company from 100% to
124% in the year 2013-2019. The gross profit of the company on the other hand, increased from
100% to 157% in the trend period. On the other hand, the net profitability of the company has
fallen from 100% to 35% in the year 2013-2019. The key reason behind a large fall in the
profitability of the company has been primarily because of the consistent rise in the expenses that
has been reported by the company. Administrative expenses of the company has increased more
than 3 times which lead to distortion of the profitability of the company (Appendix D).
3/1/2013
7/1/2013
11/1/2013
3/1/2014
7/1/2014
11/1/2014
3/1/2015
7/1/2015
11/1/2015
3/1/2016
7/1/2016
11/1/2016
3/1/2017
7/1/2017
11/1/2017
3/1/2018
7/1/2018
11/1/2018
3/1/2019
-1.00%
-0.50%
0.00%
0.50%
1.00%
1.50%
2.00%
2.50%
3.00%
3.50%
4.00%
Profit (Loss) before Tax
11MANAGE FINANCIAL PERFORMANCE
3/1/2013
7/1/2013
11/1/2013
3/1/2014
7/1/2014
11/1/2014
3/1/2015
7/1/2015
11/1/2015
3/1/2016
7/1/2016
11/1/2016
3/1/2017
7/1/2017
11/1/2017
3/1/2018
7/1/2018
11/1/2018
3/1/2019
0.00%
20.00%
40.00%
60.00%
80.00%
100.00%
120.00%
100% 100% 100% 100% 100% 100% 100%
Turnover
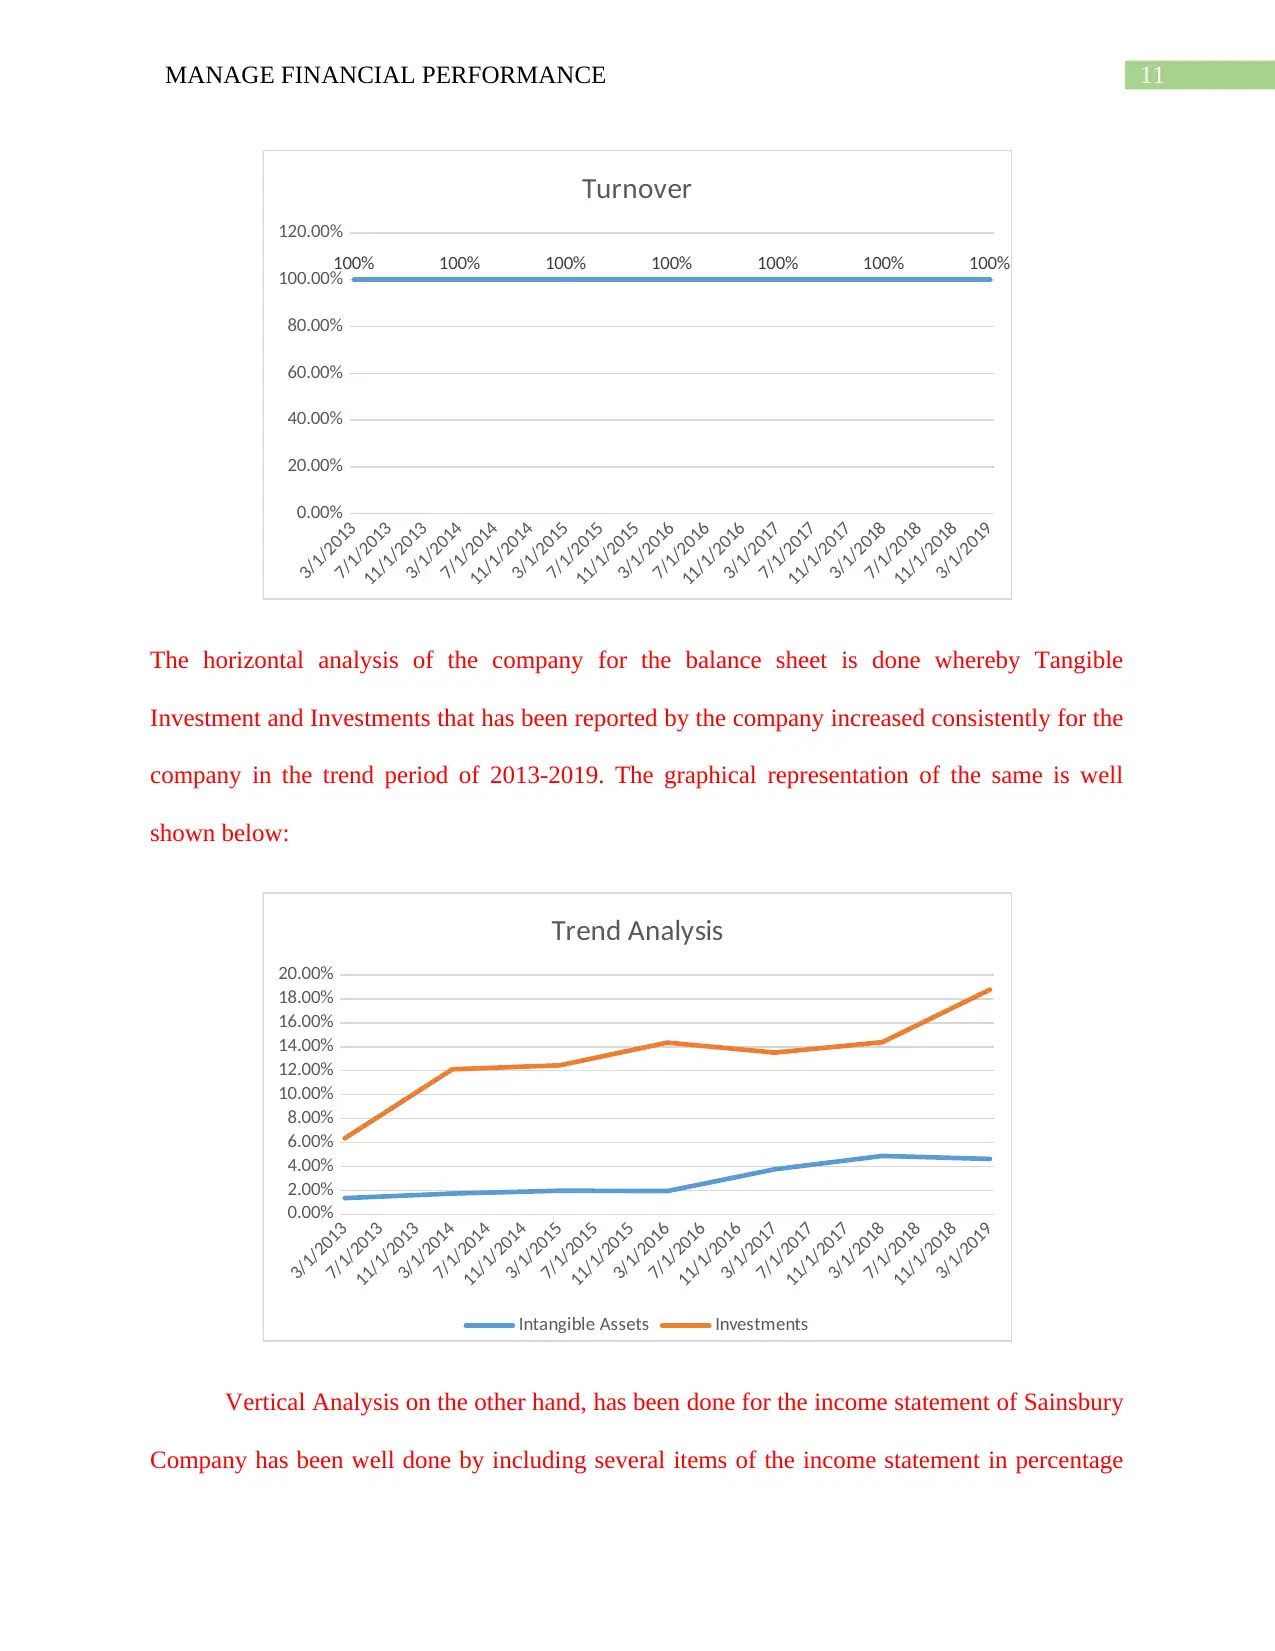
The horizontal analysis of the company for the balance sheet is done whereby Tangible
Investment and Investments that has been reported by the company increased consistently for the
company in the trend period of 2013-2019. The graphical representation of the same is well
shown below:
3/1/2013
7/1/2013
11/1/2013
3/1/2014
7/1/2014
11/1/2014
3/1/2015
7/1/2015
11/1/2015
3/1/2016
7/1/2016
11/1/2016
3/1/2017
7/1/2017
11/1/2017
3/1/2018
7/1/2018
11/1/2018
3/1/2019
0.00%
2.00%
4.00%
6.00%
8.00%
10.00%
12.00%
14.00%
16.00%
18.00%
20.00%
Trend Analysis
Intangible Assets Investments
Vertical Analysis on the other hand, has been done for the income statement of Sainsbury
Company has been well done by including several items of the income statement in percentage
3/1/2013
7/1/2013
11/1/2013
3/1/2014
7/1/2014
11/1/2014
3/1/2015
7/1/2015
11/1/2015
3/1/2016
7/1/2016
11/1/2016
3/1/2017
7/1/2017
11/1/2017
3/1/2018
7/1/2018
11/1/2018
3/1/2019
0.00%
20.00%
40.00%
60.00%
80.00%
100.00%
120.00%
100% 100% 100% 100% 100% 100% 100%
Turnover
The horizontal analysis of the company for the balance sheet is done whereby Tangible
Investment and Investments that has been reported by the company increased consistently for the
company in the trend period of 2013-2019. The graphical representation of the same is well
shown below:
3/1/2013
7/1/2013
11/1/2013
3/1/2014
7/1/2014
11/1/2014
3/1/2015
7/1/2015
11/1/2015
3/1/2016
7/1/2016
11/1/2016
3/1/2017
7/1/2017
11/1/2017
3/1/2018
7/1/2018
11/1/2018
3/1/2019
0.00%
2.00%
4.00%
6.00%
8.00%
10.00%
12.00%
14.00%
16.00%
18.00%
20.00%
Trend Analysis
Intangible Assets Investments
Vertical Analysis on the other hand, has been done for the income statement of Sainsbury
Company has been well done by including several items of the income statement in percentage
⊘ This is a preview!⊘
Do you want full access?
Subscribe today to unlock all pages.
Trusted by 1+ million students worldwide
1 out of 36
Related Documents


Your All-in-One AI-Powered Toolkit for Academic Success.
+13062052269
info@desklib.com
Available 24*7 on WhatsApp / Email
![[object Object]](/_next/static/media/star-bottom.7253800d.svg)
Unlock your academic potential
Copyright © 2020–2026 A2Z Services. All Rights Reserved. Developed and managed by ZUCOL.