Detailed Financial Analysis of Sainsbury's for 2016 and 2017: A Report
VerifiedAdded on 2020/06/06
|8
|1944
|291
Report
AI Summary
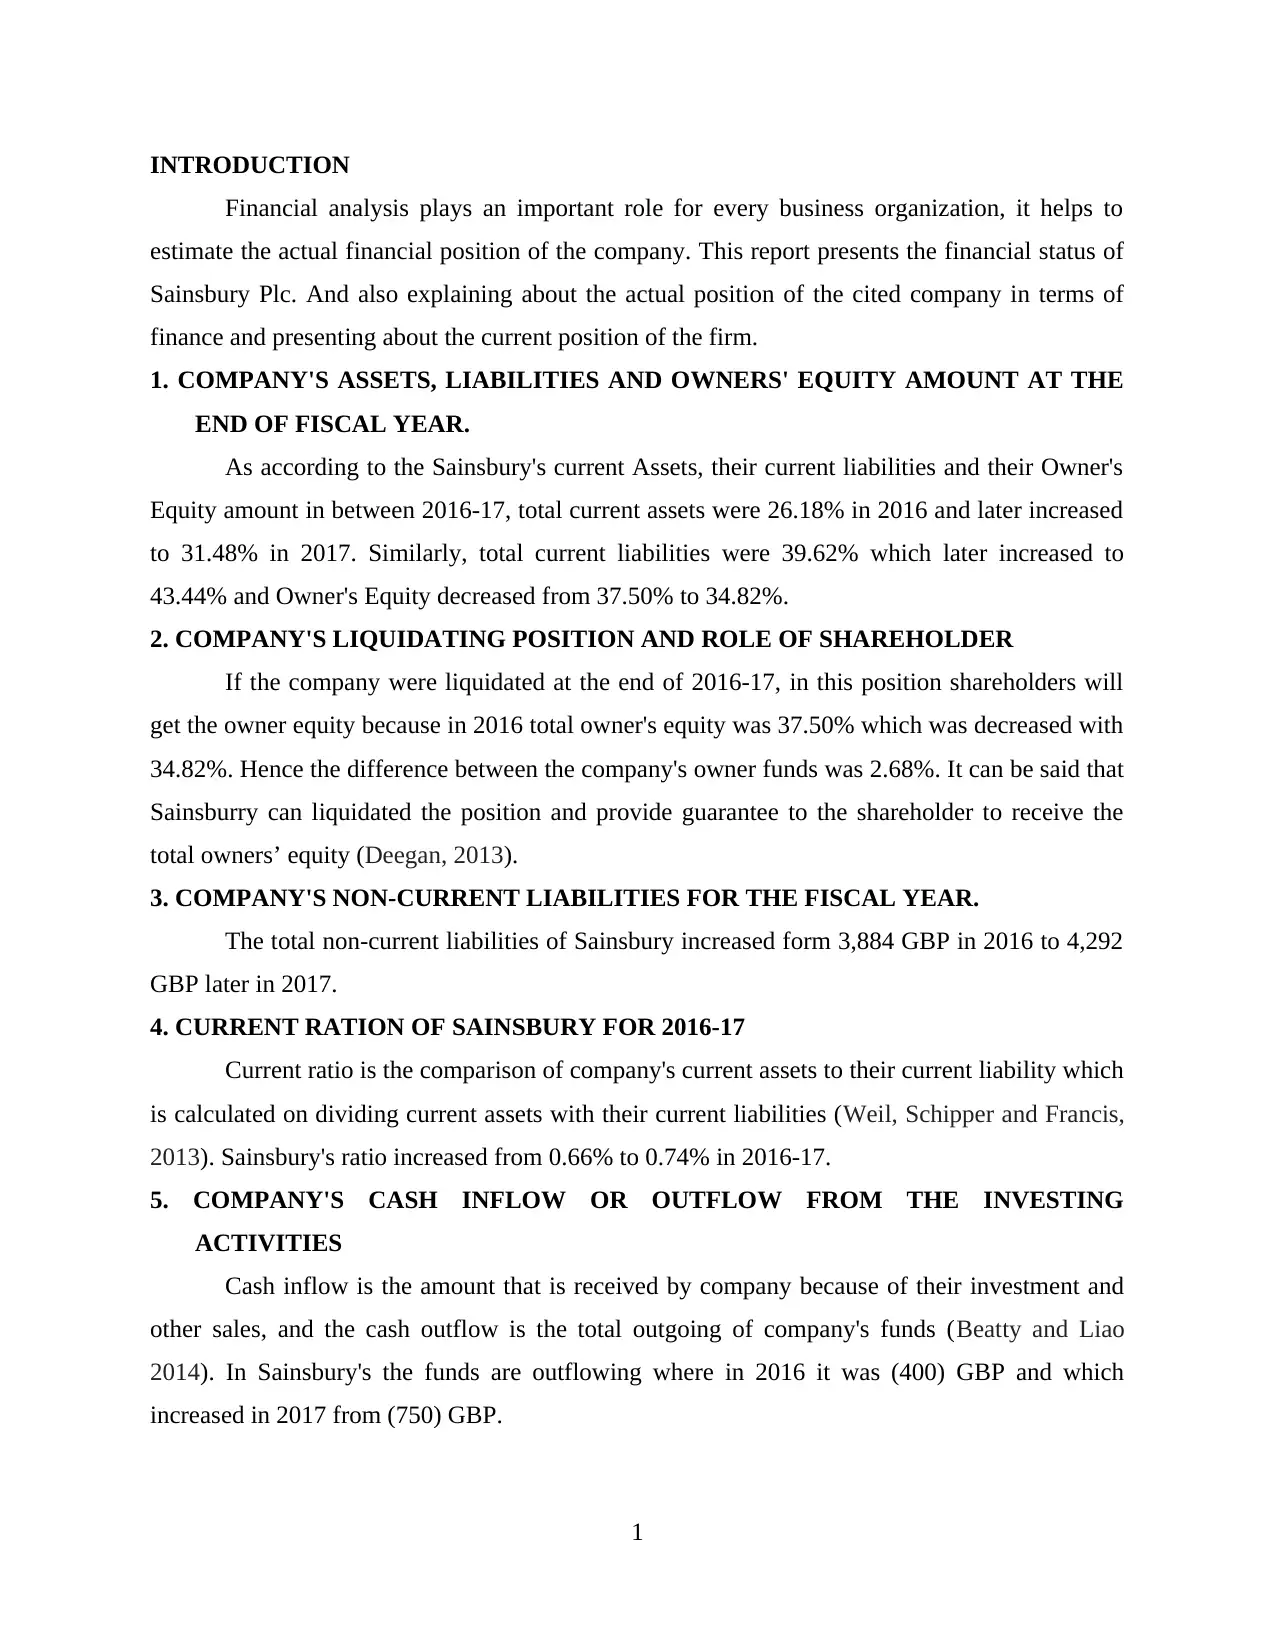
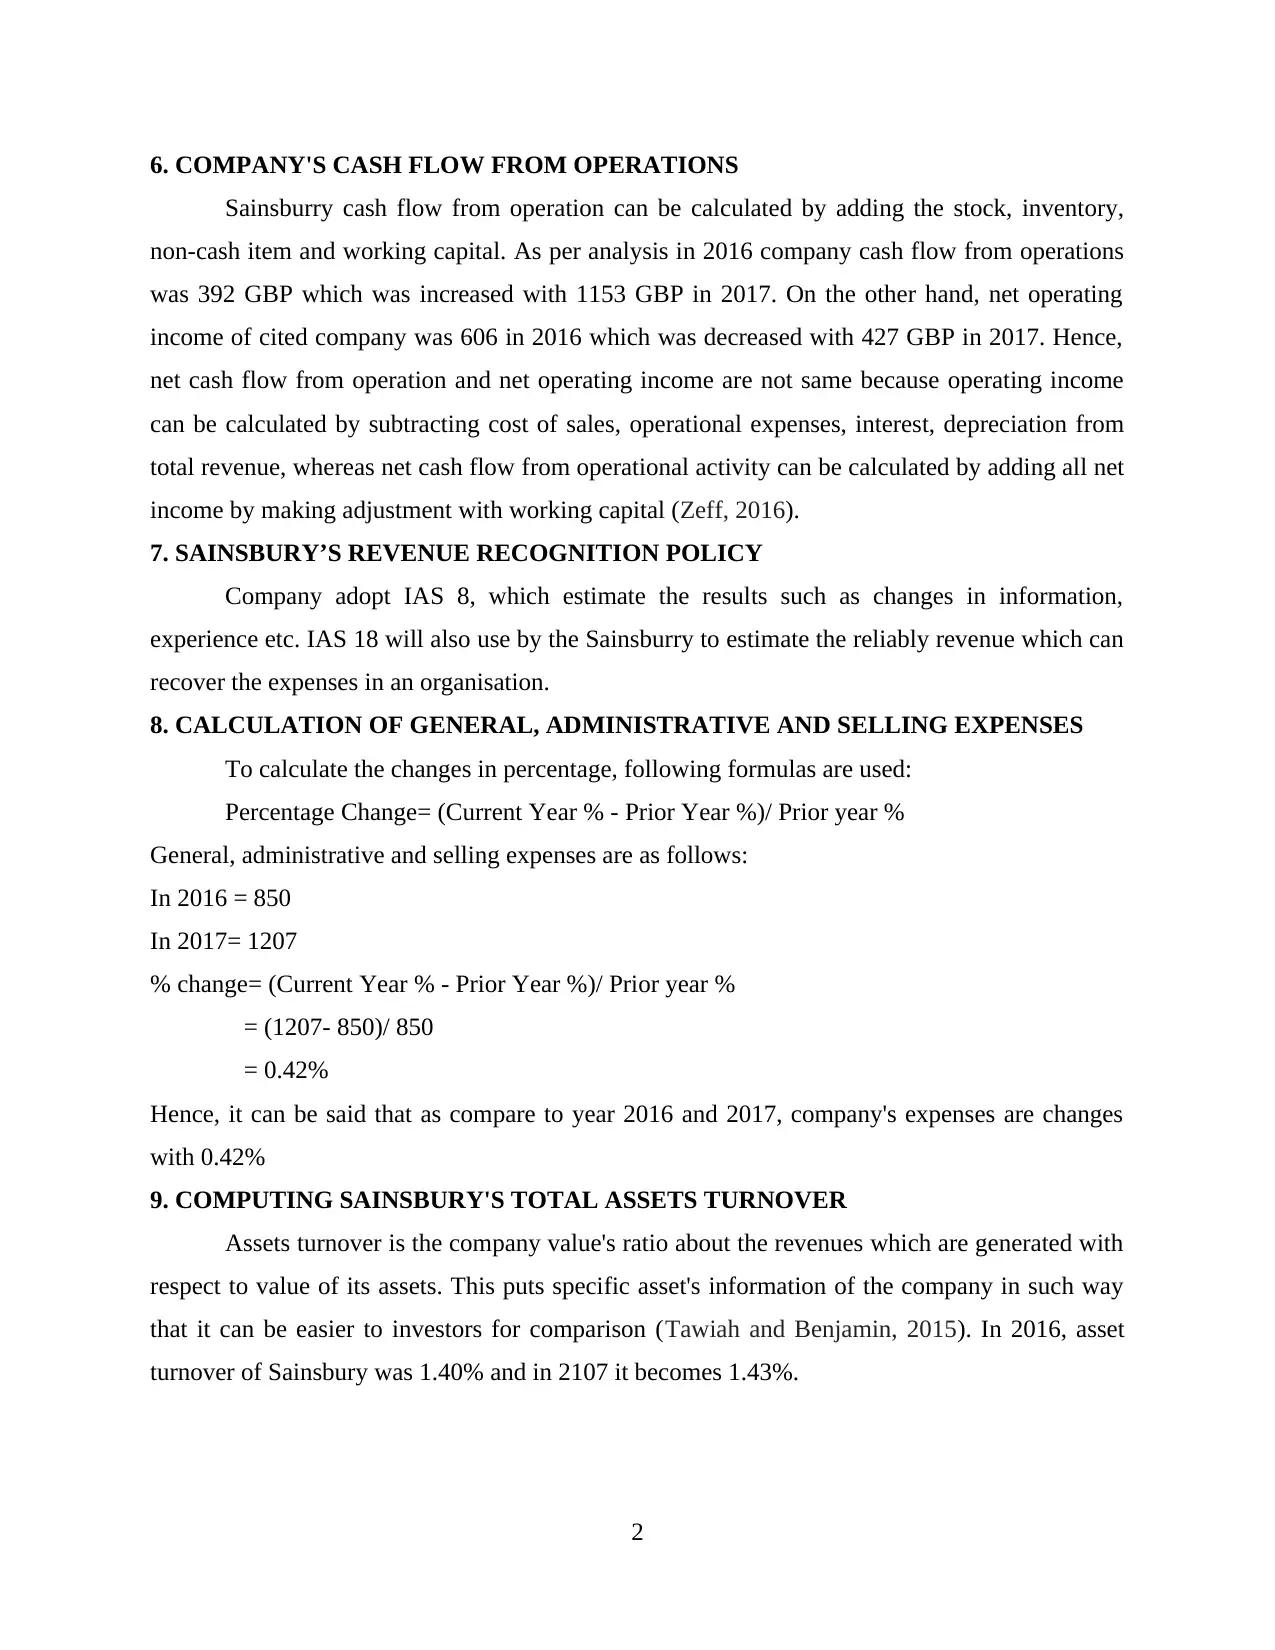
This report presents a comprehensive financial analysis of Sainsbury's, evaluating its performance during the 2016-2017 fiscal years. It examines key financial aspects, including assets, liabilities, and owner's equity, highlighting changes and trends. The analysis delves into Sainsbury's liquidating position, the role of shareholders, and non-current liabilities. It also covers the current ratio, cash flow from investing and operations, revenue recognition policies, and the calculation of various expenses. The report further explores asset turnover, prepaid expenses, deferred rent, assured liabilities, and interest income. It provides an overview of the company's earnings per share, net profit margin, cash and cash equivalents, changes in accounts receivable, and gross profit percentage. The report concludes with a summary of Sainsbury's financial standing and recommendations, supported by references to relevant financial literature.
Contribute Materials
Your contribution can guide someone’s learning journey. Share your
documents today.

Business Memo
Secure Best Marks with AI Grader
Need help grading? Try our AI Grader for instant feedback on your assignments.

Table of Contents
INTRODUCTION...........................................................................................................................1
1. COMPANY'S ASSETS, LIABILITIES AND OWNERS' EQUITY AMOUNT AT THE END
OF FISCAL YEAR..........................................................................................................................1
2. COMPANY'S LIQUIDATING POSITION AND ROLE OF SHAREHOLDER.......................1
3. COMPANY'S NON-CURRENT LIABILITIES FOR THE FISCAL YEAR.............................1
4. CURRENT RATION OF SAINSBURY FOR 2016-17..............................................................1
5. COMPANY'S CASH INFLOW OR OUTFLOW FROM THE INVESTING ACTIVITIES.....1
6. COMPANY'S CASH FLOW FROM OPERATIONS................................................................2
7. SAINSBURY’S REVENUE RECOGNITION POLICY............................................................2
8. CALCULATION OF GENERAL, ADMINISTRATIVE AND SELLING EXPENSES...........2
9. COMPUTING SAINSBURY'S TOTAL ASSETS TURNOVER ..............................................2
10. PREPAID EXPENSES AND OTHER CURRENT ASSETS ACCOUNT AT THE END OF
FISCAL YEAR................................................................................................................................3
11. COMPANY REPORT FOR DEFERRED RENT AND OTHER LIABILITIES. ...................3
12. DIFFERENCE BETWEEN PREPAID RENT AND DEFERRED RENT...............................3
13. ASSURED LIABILITIES.........................................................................................................3
14. INTEREST INCOME GENERATION REPORTED ON INCOME STATEMENT...............4
15. COMPANY'S EARNING PER SHARE OF THREE YEARS.................................................4
16. NET PROFIT MARGIN OF LAST THREE YEARS AND TREND ANALYSIS .................4
17. CASH AND CASH EQUIVALENTS.......................................................................................4
18. CHANGE IN ACCOUNTS RECEIVABLE............................................................................5
19. COMPANY'S GROSS PROFIT PERCENTAGE ....................................................................5
Summary..........................................................................................................................................5
REFERENCES................................................................................................................................6

INTRODUCTION
Financial analysis plays an important role for every business organization, it helps to
estimate the actual financial position of the company. This report presents the financial status of
Sainsbury Plc. And also explaining about the actual position of the cited company in terms of
finance and presenting about the current position of the firm.
1. COMPANY'S ASSETS, LIABILITIES AND OWNERS' EQUITY AMOUNT AT THE
END OF FISCAL YEAR.
As according to the Sainsbury's current Assets, their current liabilities and their Owner's
Equity amount in between 2016-17, total current assets were 26.18% in 2016 and later increased
to 31.48% in 2017. Similarly, total current liabilities were 39.62% which later increased to
43.44% and Owner's Equity decreased from 37.50% to 34.82%.
2. COMPANY'S LIQUIDATING POSITION AND ROLE OF SHAREHOLDER
If the company were liquidated at the end of 2016-17, in this position shareholders will
get the owner equity because in 2016 total owner's equity was 37.50% which was decreased with
34.82%. Hence the difference between the company's owner funds was 2.68%. It can be said that
Sainsburry can liquidated the position and provide guarantee to the shareholder to receive the
total owners’ equity (Deegan, 2013).
3. COMPANY'S NON-CURRENT LIABILITIES FOR THE FISCAL YEAR.
The total non-current liabilities of Sainsbury increased form 3,884 GBP in 2016 to 4,292
GBP later in 2017.
4. CURRENT RATION OF SAINSBURY FOR 2016-17
Current ratio is the comparison of company's current assets to their current liability which
is calculated on dividing current assets with their current liabilities (Weil, Schipper and Francis,
2013). Sainsbury's ratio increased from 0.66% to 0.74% in 2016-17.
5. COMPANY'S CASH INFLOW OR OUTFLOW FROM THE INVESTING
ACTIVITIES
Cash inflow is the amount that is received by company because of their investment and
other sales, and the cash outflow is the total outgoing of company's funds (Beatty and Liao
2014). In Sainsbury's the funds are outflowing where in 2016 it was (400) GBP and which
increased in 2017 from (750) GBP.
1

6. COMPANY'S CASH FLOW FROM OPERATIONS
Sainsburry cash flow from operation can be calculated by adding the stock, inventory,
non-cash item and working capital. As per analysis in 2016 company cash flow from operations
was 392 GBP which was increased with 1153 GBP in 2017. On the other hand, net operating
income of cited company was 606 in 2016 which was decreased with 427 GBP in 2017. Hence,
net cash flow from operation and net operating income are not same because operating income
can be calculated by subtracting cost of sales, operational expenses, interest, depreciation from
total revenue, whereas net cash flow from operational activity can be calculated by adding all net
income by making adjustment with working capital (Zeff, 2016).
7. SAINSBURY’S REVENUE RECOGNITION POLICY
Company adopt IAS 8, which estimate the results such as changes in information,
experience etc. IAS 18 will also use by the Sainsburry to estimate the reliably revenue which can
recover the expenses in an organisation.
8. CALCULATION OF GENERAL, ADMINISTRATIVE AND SELLING EXPENSES
To calculate the changes in percentage, following formulas are used:
Percentage Change= (Current Year % - Prior Year %)/ Prior year %
General, administrative and selling expenses are as follows:
In 2016 = 850
In 2017= 1207
% change= (Current Year % - Prior Year %)/ Prior year %
= (1207- 850)/ 850
= 0.42%
Hence, it can be said that as compare to year 2016 and 2017, company's expenses are changes
with 0.42%
9. COMPUTING SAINSBURY'S TOTAL ASSETS TURNOVER
Assets turnover is the company value's ratio about the revenues which are generated with
respect to value of its assets. This puts specific asset's information of the company in such way
that it can be easier to investors for comparison (Tawiah and Benjamin, 2015). In 2016, asset
turnover of Sainsbury was 1.40% and in 2107 it becomes 1.43%.
2
Secure Best Marks with AI Grader
Need help grading? Try our AI Grader for instant feedback on your assignments.

10. PREPAID EXPENSES AND OTHER CURRENT ASSETS ACCOUNT AT THE END
OF FISCAL YEAR
It is an expenditure which is paid for an accounting period, whose underlying assets will
not be used until the future period. Later after its consumption it changes to expanse. Whereas,
other current assets are listed according to balance sheet of the company (Board, 2015). In 2016
prepaid expanses of Sainsburg was 107 GBP which later increases in 2017 that is 157 GBP. The
above information is collected from the MorningStar website.
11. COMPANY REPORT FOR DEFERRED RENT AND OTHER LIABILITIES.
For Sainsbury, their deferred rent was 237 GBP in 2016 and later in 2017 it was
decreased to 172 GBP.
Whereas, their other liabilities also were increased from 2016 to 2017 which is in 2016
their other liabilities were 4261 GBP and later in 2017 it has increased to 5497 GBP.
12. DIFFERENCE BETWEEN PREPAID RENT AND DEFERRED RENT
Deferred Rent: It shows the payment of rent which is related to more than one year. It can
be recorded on balance sheet as a non-current assets manner.
Prepaid Rent: On the other hand, prepaid rent shows the payment which was made less
than one year and it is recorded on the balance sheet in current asset side.
13. ASSURED LIABILITIES
These are an expanse which the company has obtained but not applied and paid. These
enables accountants of the company to project clear image of company's finances (Sangster,
2015).
14. INTEREST INCOME GENERATION REPORTED ON INCOME STATEMENT
On the basis of the analysis on Sainsbury annual financial report, it is come to know that
the Interest income in 2016 was 471 GBP which later decreased in 2017 and become 377 GBP.
15. COMPANY'S EARNING PER SHARE OF THREE YEARS
Particulars Earnings per share
2015 -0.08
2016 0.23
2017 0.17
3

As per the above table, it has been analysed that Earning per share of Sainsbury was
fluctuated per the changes in the market. In 2015, it was -0.08% which was increased with
0.23%. On the other hand, it will decrease with 0.17%
16. NET PROFIT MARGIN OF LAST THREE YEARS AND TREND ANALYSIS
Particulars Net margin%
2015 -0.70
2016 2.00
2017 1.44
As per the above table, it has been analysed that trend lines of net margin of Sainsbury
are as follows:
In 2015, net profit ratio was decreased and show negative ratio with -0.70%
In 2016, ratio was increased with 2%
In 2017, it will decrease with 1.44%. All these trends show that company is in good
position and try to adopt various changes so that it can overcome its threats.
17. CASH AND CASH EQUIVALENTS
At the beginning of the year in 2016 it was 1.92GBP which later at the end of the year
decreased and become 1.72 GBP. Whereas, in the case of the beginning of the year of 2017 it
was 1.49GBP which later with the end of year become 1.41GBP.
18. CHANGE IN ACCOUNTS RECEIVABLE
For Sainsbury in 2016 their account receivable was 96 GBP million and later in 2017 it
becomes 106 GBP million, and the cash provided by the operating activities was 1242 GBP in
2016 and 1277 GBP in 2017.
19. COMPANY'S GROSS PROFIT PERCENTAGE
YEAR GROSS PROFIT %
2016 6.2
2017 6.2
As according to the analysis, it is found that the rate of Gross profit percentage is being
constant for Sainsbury.
4

The organization should maintain their investment portfolio, the should not only invest in
the simple investment market, but they need to invest in the different market so that they can able
to large revenue, it helps the organization to cope up with the market where the revenue is
negative with the market the revenue is going in the positive way. Investment portfolio is the
best way to generate high revenue for the company like Sanisbury.
Summary
As per the report Sainbury is doing well in the market and its current position is quite
stable as compared to other companies in the market. According to the study it can be
recommend to the company to increase the percentage of their Gross profit which will assist
them to become more stable in the market.
5
Paraphrase This Document
Need a fresh take? Get an instant paraphrase of this document with our AI Paraphraser

REFERENCES
Books and Journals
Deegan, C., 2013. Financial accounting theory. McGraw-Hill Education Australia.
Weil, R.L., Schipper, K. and Francis, J., 2013. Financial accounting: an introduction to
concepts, methods and uses. Cengage Learning.
Beatty, A. and Liao, S., 2014. Financial accounting in the banking industry: A review of the
empirical literature. Journal of Accounting and Economics. 58(2). pp.339-383.
Zeff, S.A., 2016. Forging accounting principles in five countries: A history and an analysis of
trends. Routledge.
Tawiah, V.K. and Benjamin, M., 2015. Conservatism analysis on Indian Generally Accepted
Accounting Principles (GAAP) and International Financial Reporting Standards (IFRS).
Board, A.P., 2015. Tetranormalization and the Accounting Standard-Setting Process.
Organizational Change and Global Standardization: Solutions to Standards and Norms
Overwhelming Organizations. p.69.
Sangster, A., 2015. The genesis of double entry bookkeeping. The Accounting Review. 91(1).
pp.299-315.
6
1 out of 8
Related Documents

Your All-in-One AI-Powered Toolkit for Academic Success.
+13062052269
info@desklib.com
Available 24*7 on WhatsApp / Email
Unlock your academic potential
© 2024 | Zucol Services PVT LTD | All rights reserved.